Quick notes on trying out Kind for a local and lightweight Kubernetes cluster.
The “getting started” steps for Kind are easy and well documented on the Kind site, but I didn’t find a good guide on adding the Kubernetes Dashboard to a newly created Kind cluster… I’m planning on using this as the basis for a few local projects so wanted to capture it here, plus checkout using the Lens IDE to manage and monitor a local “Kind” cluster.
As it says on the Kind website… if you have go 1.16+ and docker or podman installed go install sigs.k8s.io/kind@v0.20.0 && kind create cluster is all you need!
Here’s me doing just that to create a new kind cluster on my Mac in 21 seconds….
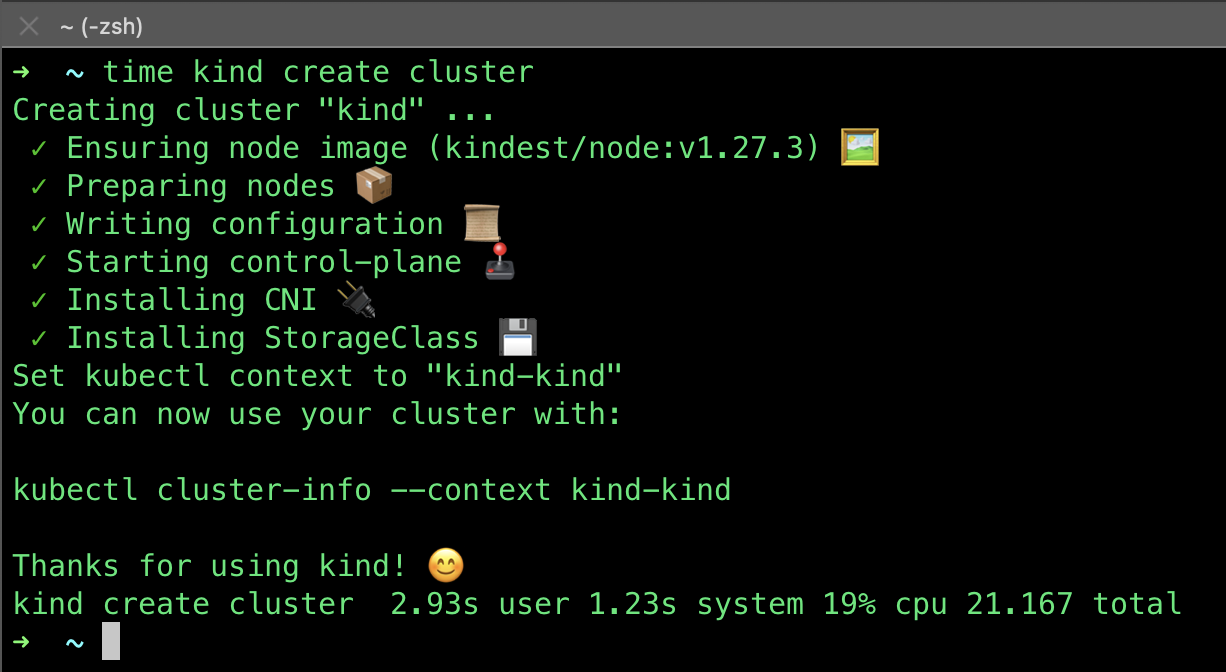
all very quick and very easy, and it is incredibly light on resources too.
Notes on adding the Kubernetes Dashboard to a new Kind cluster
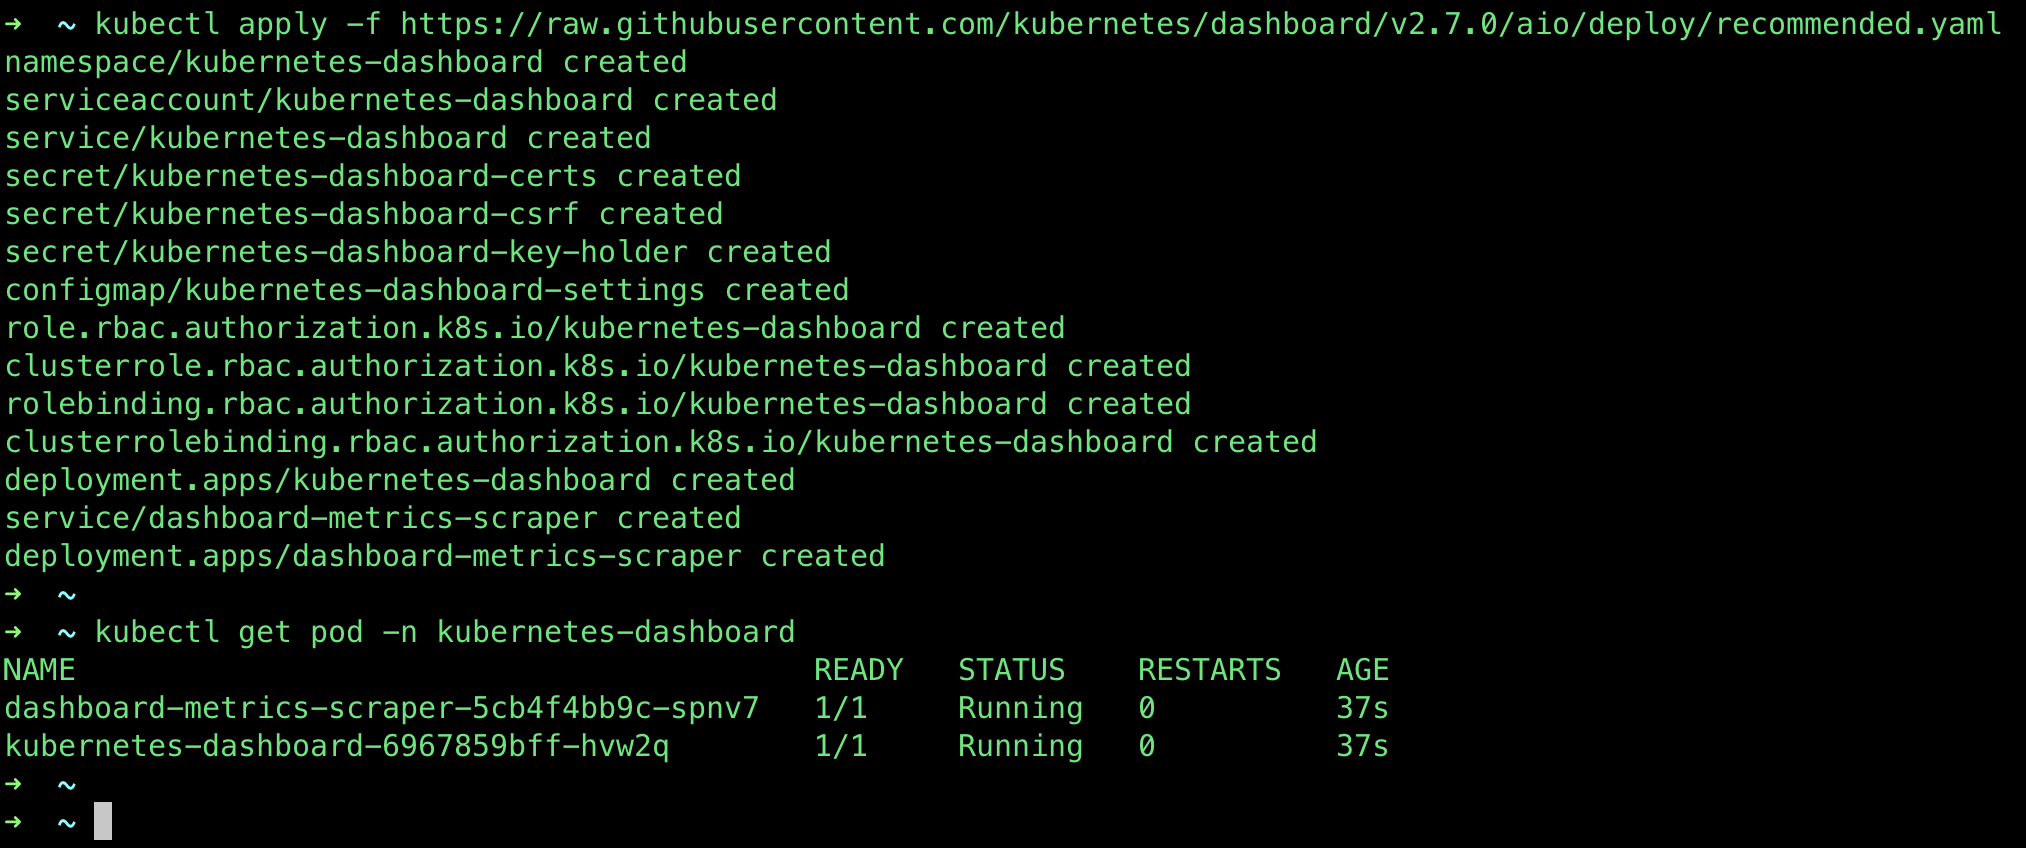
Apply the dashboard yaml
kubectl apply -f https://raw.githubusercontent.com/kubernetes/dashboard/v2.7.0/aio/deploy/recommended.yaml
Give it a moment or two to start up, checking with:
kubectl get pod -n kubernetes-dashboard
then create the admin user & cluster role bindings
kubectl create serviceaccount -n kubernetes-dashboard admin-user

kubectl create clusterrolebinding -n kubernetes-dashboard admin-user --clusterrole cluster-admin --serviceaccount=kubernetes-dashboard:admin-user
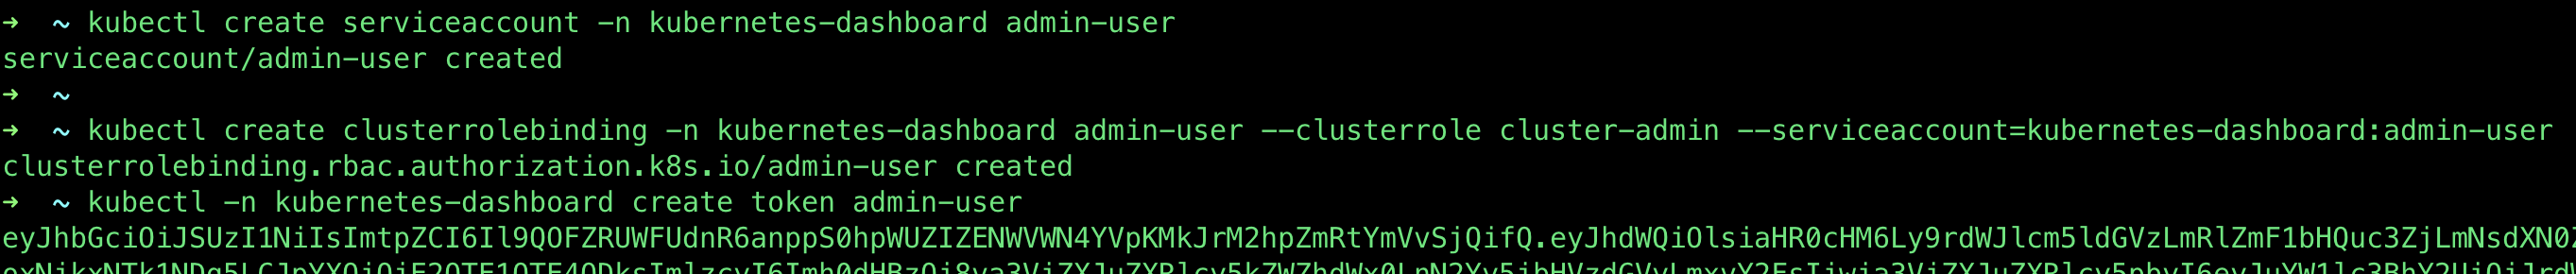
Next, get the auth token:
kubectl -n kubernetes-dashboard create token admin-user
Start up the local proxy
kubectl proxy
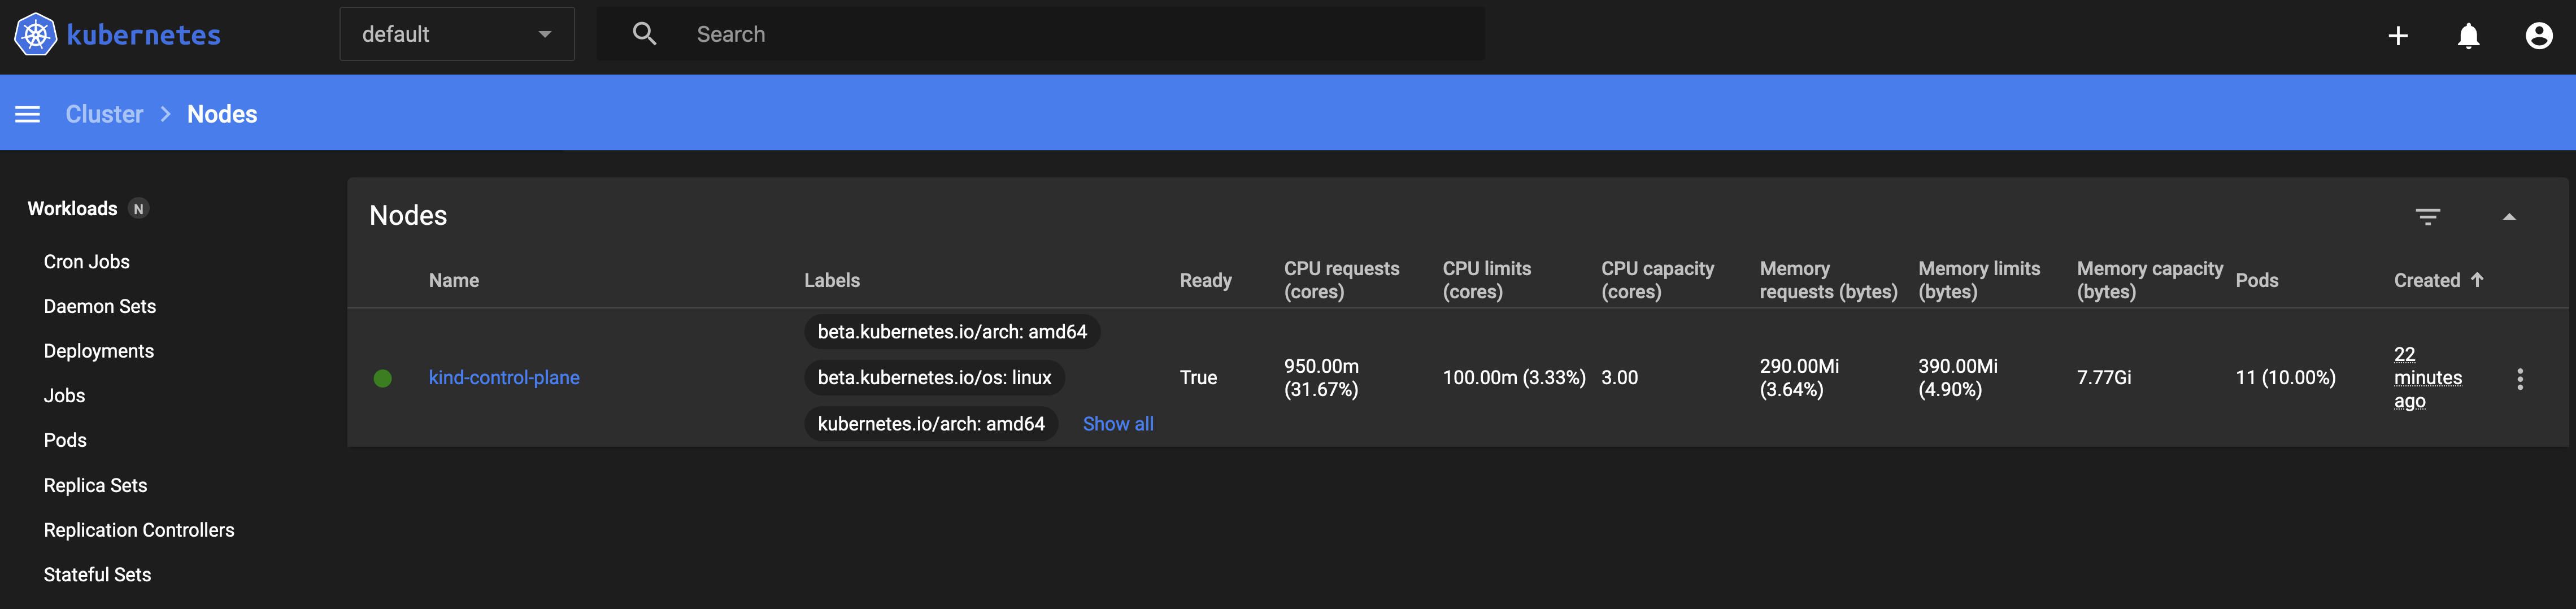
Browse to the local login endpoint here and pass it the token from above
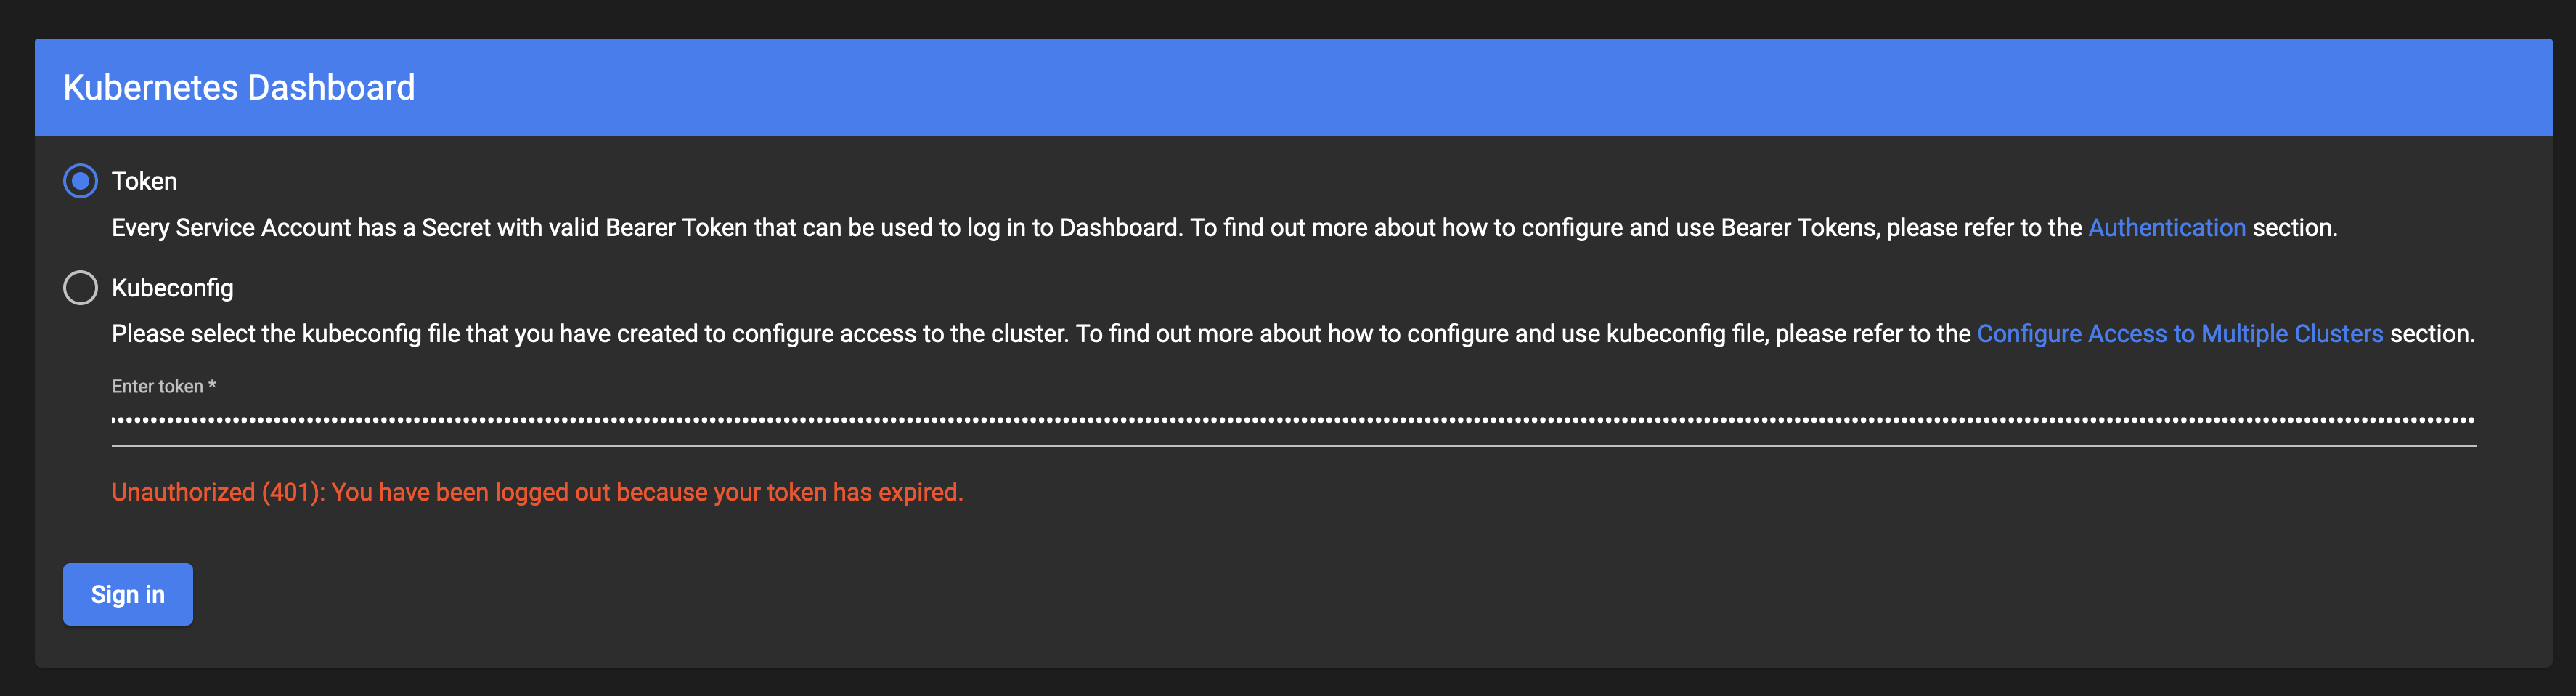
and you should see the Kubernetes Dashboard for your (very new) Kind cluster like this…
The Kubernetes Dashboard could also be deployed via Helm:
helm install stable/kubernetes-dashboard --name my-releaseor via the Lens UI (more on that below):
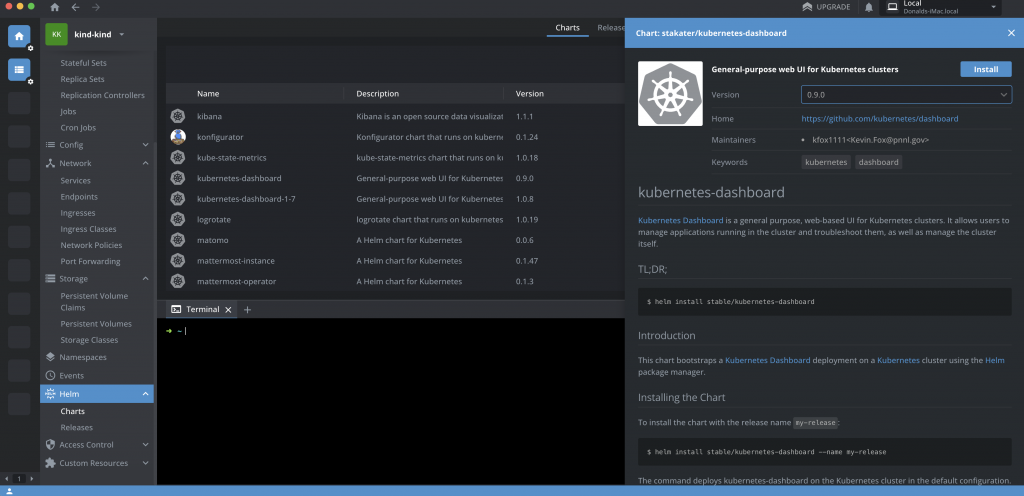
Setting up Lens is even simpler
Download Lens and log in:
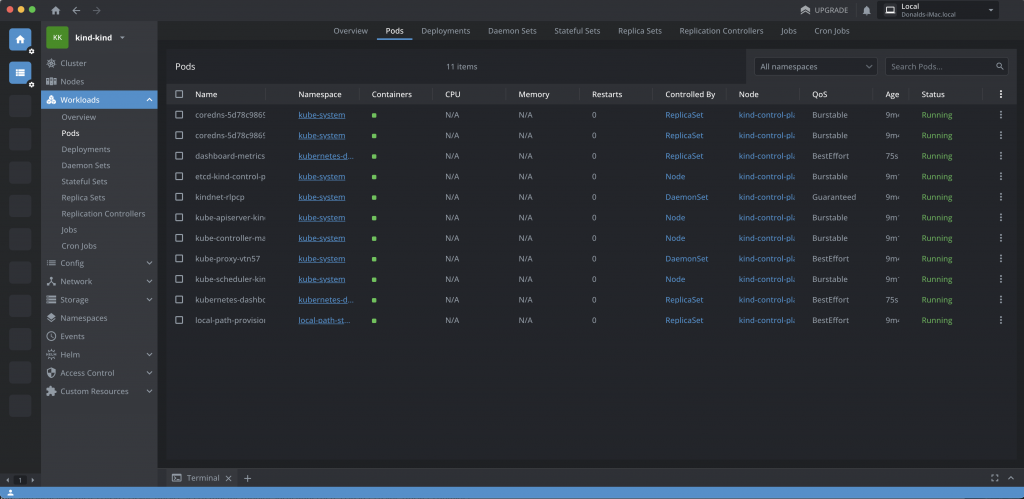
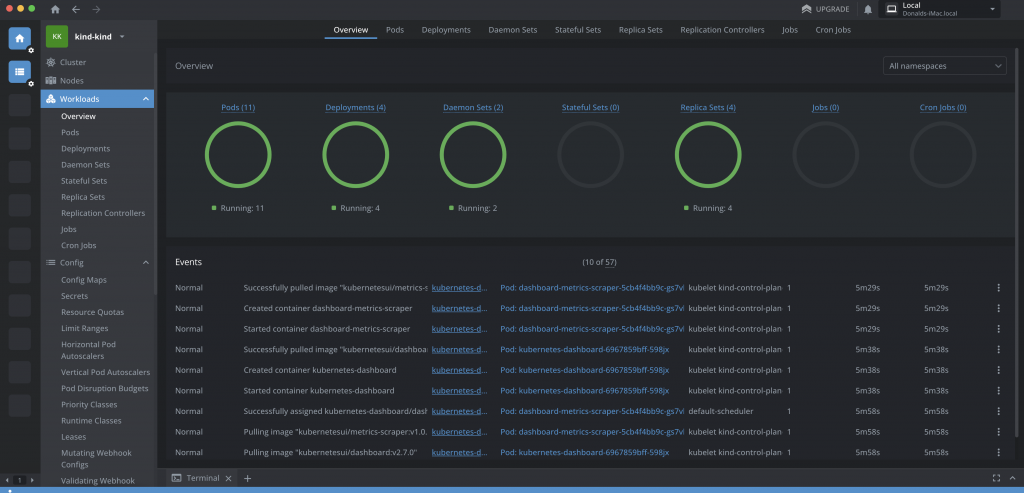
then select your “kind-kind” cluster from Lens > Catalogue > Clusters and you can see & do a whole load more with your cluster via Lens:
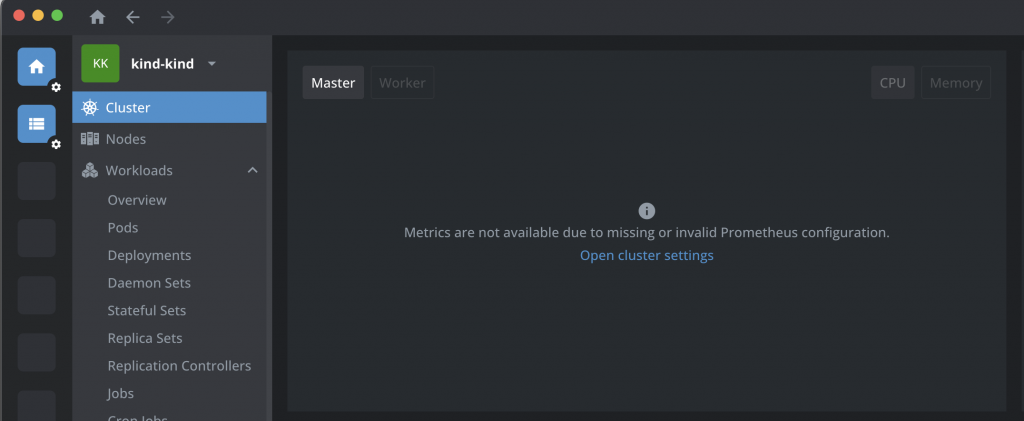
The missing metrics warning in Lens saying “Metrics are not available due to missing or invalid prometheus configuration.”
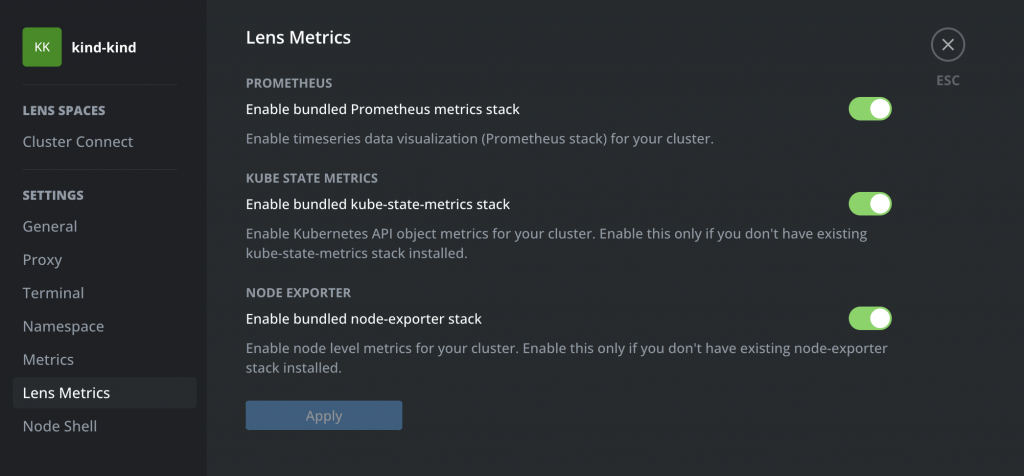
can be sorted by installing Prometheus using Helm via the CLI or from Lens:
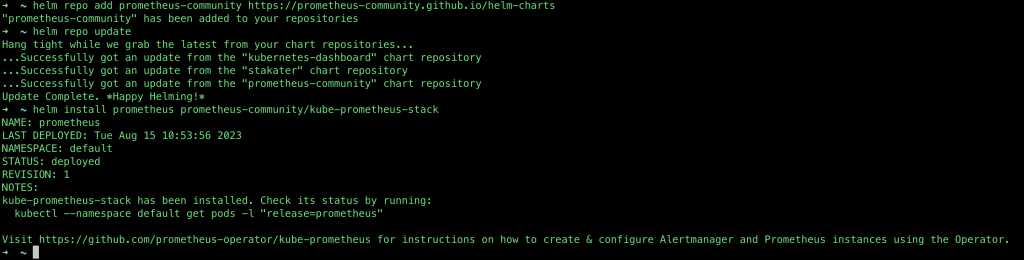
helm repo add prometheus-community https://prometheus-community.github.io/helm-chartshelm repo updatehelm install prometheus prometheus-community/kube-prometheus-stackAlternatively, you can enable the inbuilt Metrics options in Lens:
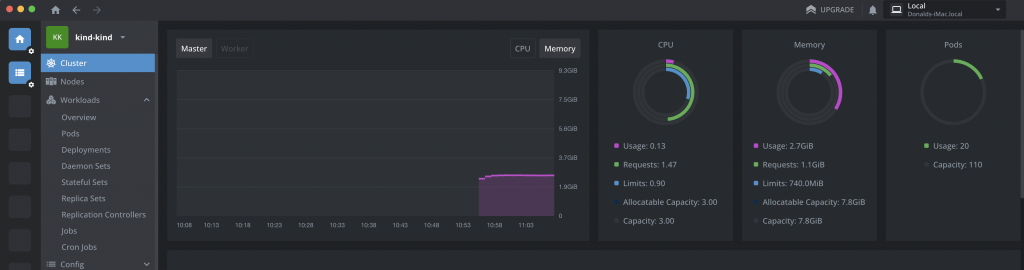
Either way, things should soon look much better:
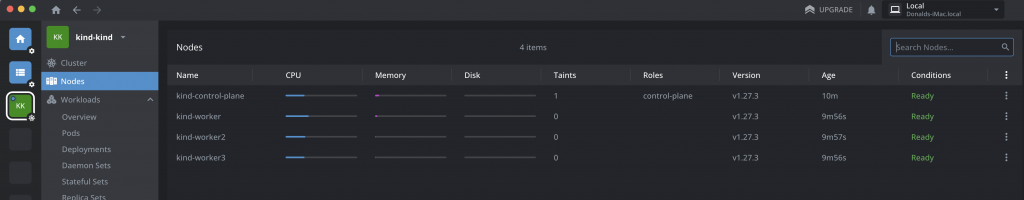
Adding multiple worker nodes to a kind cluster
This can be done in Kind by defining a cluster manifest with multiple worker nodes like this:
kind: Cluster
apiVersion: kind.x-k8s.io/v1alpha4
nodes:
- role: control-plane
- role: worker
- role: worker
- role: worker
then creating the cluster specifying that file, e.g.
kind create cluster --config my-kind-cluster-config.yaml“docker ps” should then show your multiple nodes, as will Lens: