I took these notes while setting up Grafana and InfluxDB on Proxmox.
I hit a few minor issues so thought I’d post it here as a mini “How To” or reference for others.
NOTE: If you are just looking for a simple and light-weight way to monitor Proxmox stats (including memory, CPU, disk for your LXCs and VMs), check out the brief section on “Pulse” at the end of this page!
This setup allows me to easily monitor my Proxmox host and the VMs and LXCs it runs via a nice Grafana dashboard, with the data/metrics stored in InfluxDB.
Note that the default user:password for Grafana is admin:admin
Configure Proxmox
Next you need to set the Metrics Server used byProxmox, this will tell proxmox to send all metrics on itself and the VMs and LXCs it runs to InfluxDB.
This is set under “Datacenter” in the proxmox UI:
This looked straightforward too, but there were conflicting opinions on how to do it. I initially went with UDP which didn’t work for me; there was nowhere to set any authentication and I wasn’t allowing anonymous access to InfluxDB, so I switched to using HTTP which then allowed me to specify the (InfluxDB) credentials.
Configure InfluxDB
I created a “proxmox” organisation and a “proxmox” bucket in InfluxDB
I then created an API key/Token specifically for that proxmox bucket, which I used in the above pic.
To verify things were working between Proxmox and InfluxDB, I took a look in the data explorer:
You can see in that pic that InfluxDB has data on my VMs and LXCs, which it must have received from Proxmox, so I then knew my remaining issues were with the connection between InfluxDB <-> Grafana.
Configure Grafana
Initially I was getting “InfluxDB returned error: Unauthorized error reading influxDB” – hence the check above to confirm that Proxmox -> InfluxDB was working ok.
I couldn’t see anywhere in this version of Grafana to specify the Token for InfluxDB though – other screenshots on the ‘net had & used that option, but it wasn’t available for me 🙁
After some reading I learned you could set the Token by creating a new Custom HTTP Header called “Authorization” with the value “Token BXx…….7yBkw==” (that’s the word Token, a space, then the full Token you got from InfluxDB, all set as the Value for a new Custom HTTP Header called Authorization…)
This seemed surprisingly flaky to me, but it worked.
My (working) connection details look like this:
Prior to adding that HTTP Header, I was getting a successful connection but “0 measurements found”.
you don’t need to sign up there or anything else, just enter the ID: 10048 like in this pic and it’ll pull the Dashboard down:
Now I was finally able to see data being populated in Grafana from my Proxmox node & its VMs & LXCs:
Happy days.
The Pulse option
A possible alternative to the above Grafana and InfluxDB stack is to use “Pulse” – this was new to me and I have recently set it up too (you can never have enough monitoring!).
This is a very lightweight and more focused option that is really quick and easy to set up.
While the InfluxDB and Grafana approach can be extended to cover a vast range of monitoring and alerting for all sorts of things – I have set up and used it in several large companies I’ve worked for – if all you really want is Proxmox monitoring without those possibilities, this looks perfect.
This took me a little while to piece together, so I thought I’d write it up here in case it’s of use to anyone else, or if I ever need to go through it again….
Background
I use Frigate to to access and manage my home CCTV cameras. It is awesome, and I would like to be able to access it securely from outside my local network/LAN.
I also use HomeAssistant (“HA”) to process the feeds and notifications from Frigate, but would like to directly access the Frigate web UI. I’ll keep HA mostly out of this post.
– Homeassistant also on Proxmox but as a VM (HAOS)
– Frigate and MQTT run as Docker containers on Ubuntu, on an old HP Prodesk. I may eventually migrate these over to Proxmox too, but they are working happily on this device and there may be issue migrating them to a VM or LXC due to harware; I use a USB Coral TPU for processing, and while I know you can pass that through to an LXC or VM, I haven’t gotten around to it.
Installing Nginx Proxy Manager on Proxmox
Thanks to Proxmox and the amazing community scripts, this was very quick and easy. I used this script to deploy it as an LXC:
When that was completed I opened up a firewall rule on my router to allow traffic via HTTPS/443 to the new Nginx LXC’s address.
Configure Nginx Proxy Manager and Frigate
The next step – and the crux of this post – was to setup Nginx Proxy Manager to allow access through to Frigate and handle authentication:
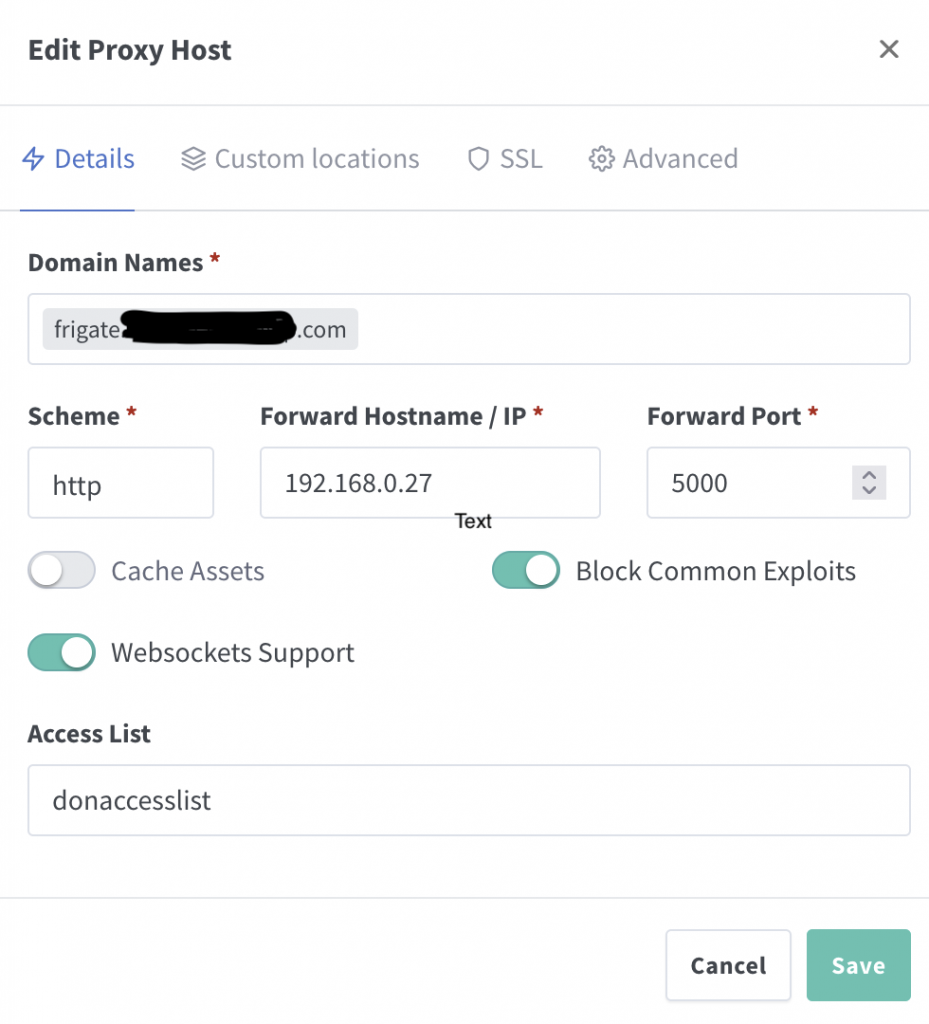
create a new Proxy Host
This is reasonably simple; specify a domain name that resolves to your host/router, then set the local IP your Frigate runs on and the port. I gather Websocket Suport is required, and you only need HTTPS here if your Frigate endpoint is using it. Nginx will serve this connection as HTTPS once setup to do so.
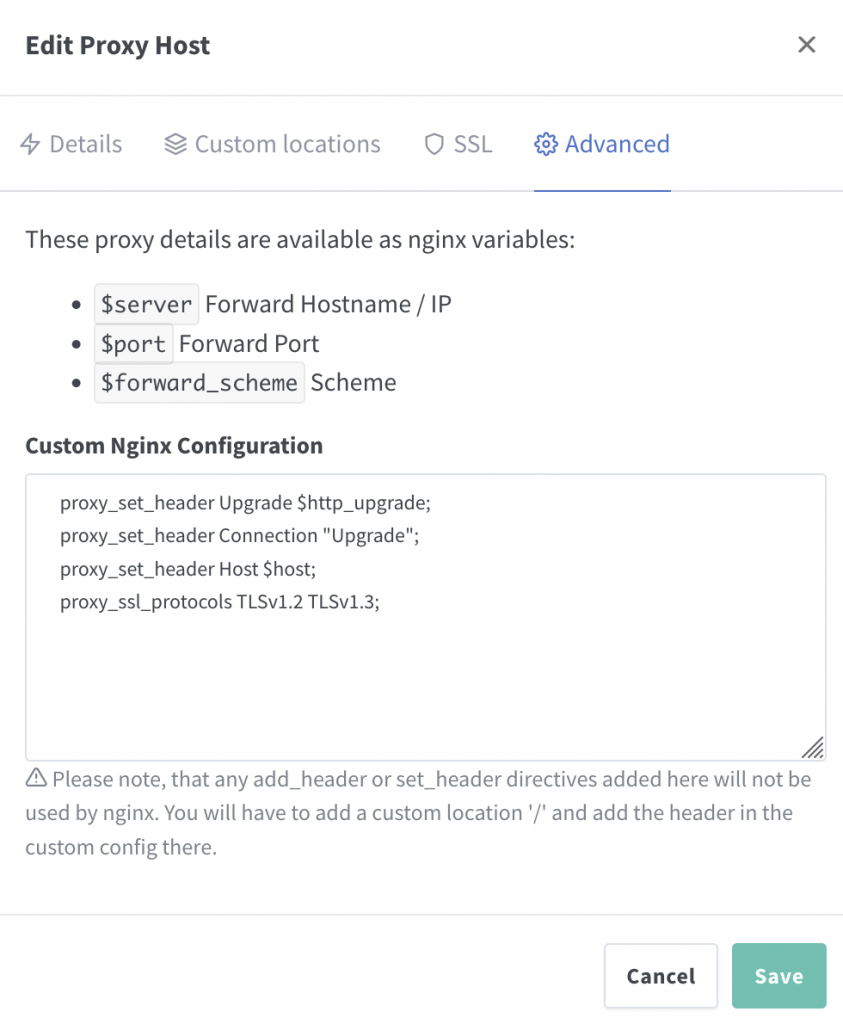
After some googling I found the following Nginx config was also recommended:
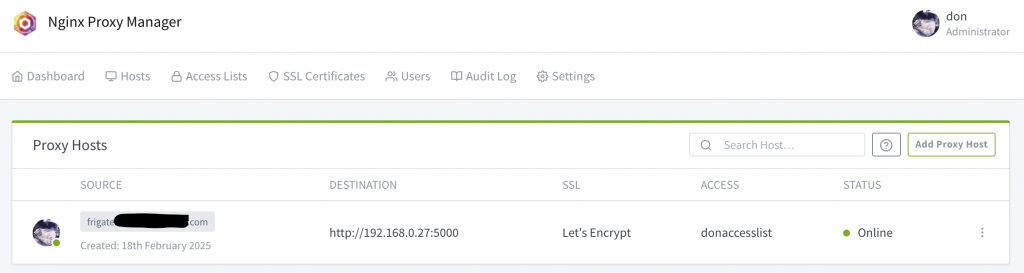
Once done, you should have an “Online” Proxy Host combining your domain name, your Frigate (destination) IP & listening port, with SSL option (I use Let’s Encrypt):
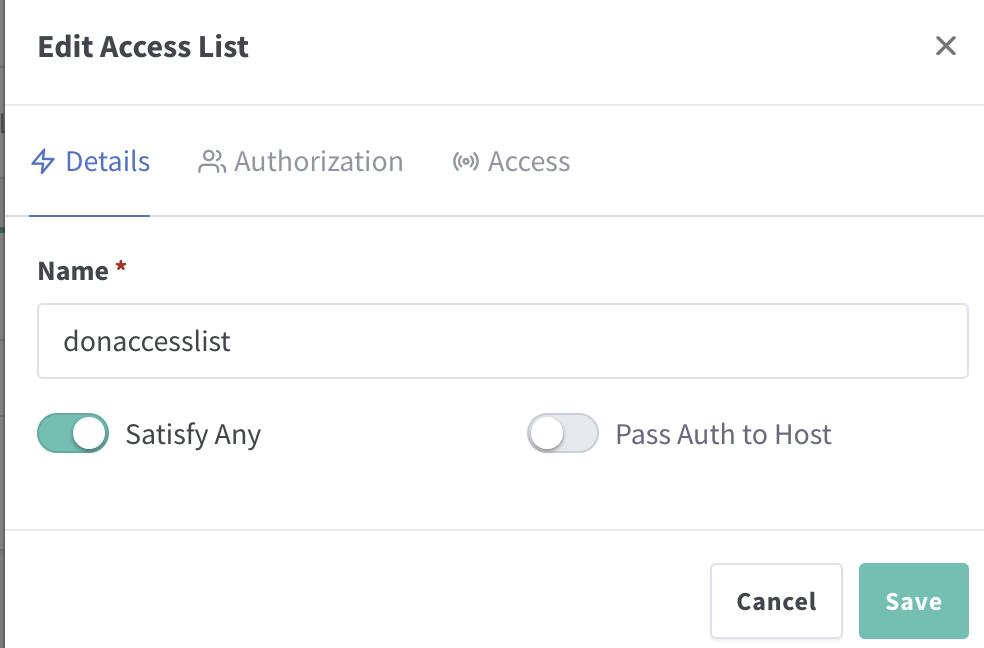
A simple Access List was defined prior to the above, just containing a user & password set under ‘Athorisation’. You will need to use these credentials to log in.
Frigate updates for TLS?
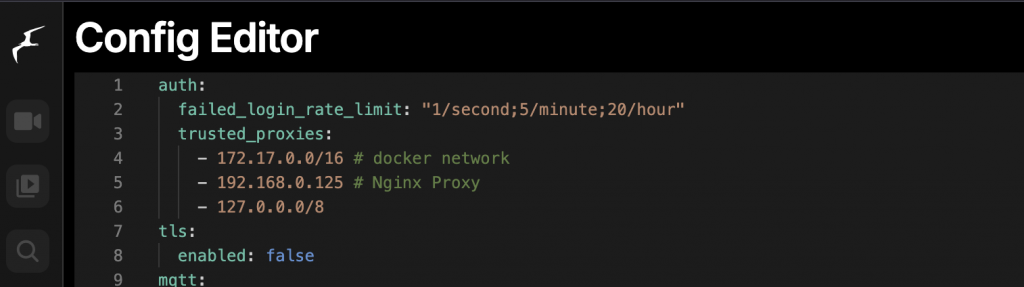
The trusted_proxies below were also recommended, but I didn’t need them in my case:
When I eventually got things working using port 8971 (instead of 5000) I was prompted for a login by Frigate, but I hadn’t set up auth in Frigate, just Nginx.
Nginx has the option to pass auth through to the destination, which may be nice, but for now I just disabled the feature in Frigate and after a restart things worked as expected, with the basic Nginx auth only:
auth:
  enabled: False
tls:
  enabled: false
It may be better/safer/nicer to have the auth passed through, enabled and managed in Frigate, along with TLS, but I haven’t done so yet.
This didn’t work for me; I then discovered I couldn’t connect to that port at all (even locally) so I went with 5000 initially as I knew that did work locally at least.
Eventually I realised that I’d never needed or opened up that port to my Frigate container! I updated my config to map port 8971 to 8971:
-p 8971:8971
after that little oversight was corrected, it worked correctly!
When testing via a Browser (behind a VPN to emulate external access) I was prompted once for a login and then everything just worked; perfect!
I then went to check via my mobile phone, and that kept asking me to log in, with the message “Authorization required”
This was fixed by updating the Nginx Access List and setting “Satisfy Any” to be On/checked. That small change seems to have sorted the issue and everything now works perfectly on my phone too.
Being a fan of Solana and interested in exploring and using the technology, I wanted to find some practical use for it in my role as a DevOps Engineer.
This post attempts to do that, by integrating Solana in to a CI/CD workflow to provide an audit of build artefacts. Yes, there are many other ways & tools you could do this, but I found this particular combination interesting.
Overview
Solana is a high-performance blockchain platform known for its speed and scalability.
Integrating Solana with GitHub Workflows can bring a new level of security, transparency, and efficiency to your CI/CD pipelines.
This blog post demonstrates how to leverage Solana in a GitHub Workflow to enhance your development and deployment processes.
What is Solana?
Solana is a decentralised blockchain platform designed for high throughput and low latency. It supports smart contracts and decentralized applications (dApps) with a focus on scalability and performance. Solana’s unique consensus mechanism, Proof of History (PoH), allows it to process thousands of transactions per second.
Why Integrate Solana with GitHub Workflows?
Integrating Solana with GitHub Workflows can provide several benefits:
Immutable Build Artifacts: Store cryptographic hashes of build artifacts on the Solana blockchain to ensure their integrity and immutability.
Automated Smart Contract Deployment: Use Solana smart contracts to automate deployment processes.
Transparent Audit Trails: Record CI/CD pipeline activities on the blockchain for transparency and auditability.
Setting Up Solana in a GitHub Workflow
Let’s walk through an example of how to integrate Solana with a GitHub Workflow to store build artifact hashes on the Solana blockchain.
Step 1: Install Solana CLI
Ensure you have the Solana CLI installed on your local machine or CI environment:
sh -c "$(curl -sSfL https://release.solana.com/v1.8.0/install)"
Step 2: Set Up a Solana Wallet
Then, you need a Solana wallet to interact with the blockchain. You can use the Solana CLI to create a new wallet:
solana-keygen new --outfile ~/my-solana-wallet.json
This command generates a new wallet and saves the keypair to ~/my-solana-wallet.json.
Step 3: Create a GitHub Workflow
Create a new GitHub Workflow file in your repository at .github/workflows/solana.yml:
name: Solana Integration

on:
  push:
    branches:
      - main

jobs:
  build:
    runs-on: ubuntu-latest

    steps:
      - name: Checkout code
        uses: actions/checkout@v2

      - name: Set up Solana CLI
        run: |
          sh -c "$(curl -sSfL https://release.solana.com/v1.8.0/install)"
          export PATH="/home/runner/.local/share/solana/install/active_release/bin:$PATH"
          solana --version

      - name: Build project
        run: |
          # Replace with your build commands
          echo "Building project..."
          echo "Build complete" > build-artifact.txt

      - name: Generate SHA-256 hash
        run: |
          sha256sum build-artifact.txt > build-artifact.txt.sha256
          cat build-artifact.txt.sha256

      - name: Store hash on Solana blockchain
        env:
          SOLANA_WALLET: ${{ secrets.SOLANA_WALLET }}
        run: |
          echo $SOLANA_WALLET > ~/my-solana-wallet.json
          solana config set --keypair ~/my-solana-wallet.json
          solana airdrop 1
          HASH=$(cat build-artifact.txt.sha256 | awk '{print $1}')
          solana transfer <RECIPIENT_ADDRESS> 0.001 --allow-unfunded-recipient --memo "$HASH"
Step 4: Configure GitHub Secrets
To securely store your Solana wallet keypair, add it as a secret in your GitHub repository:
Go to your repository on GitHub.
Click on Settings.
Click on Secrets in the left sidebar.
Click on New repository secret.
Add a secret with the name SOLANA_WALLET and the content of your ~/my-solana-wallet.json file.
Step 5: Run the Workflow
Push your changes to the main branch to trigger the workflow. The workflow will:
Check out the code.
Set up the Solana CLI.
Build the project.
Generate a SHA-256 hash of the build artifact.
Store the hash on the Solana blockchain.
Example Output and Actions
After the workflow runs, you can verify the transaction on the Solana blockchain using a block explorer like Solscan. The memo field of the transaction will contain the SHA-256 hash of the build artifact, ensuring its integrity and immutability.
Example Output:
Run sha256sum build-artifact.txt > build-artifact.txt.sha256
b1946ac92492d2347c6235b4d2611184a1e3d9e6 build-artifact.txt
Run solana transfer <RECIPIENT_ADDRESS> 0.001 --allow-unfunded-recipient --memo "b1946ac92492d2347c6235b4d2611184a1e3d9e6"
Signature: 5G9f8k9... (shortened for brevity)
Possible Actions:
Verify Artifact Integrity: Use the stored hash to verify the integrity of the build artifact before deployment.
Audit Trail: Maintain a transparent and immutable audit trail of all build artifacts.
Automate Deployments: Extend the workflow to trigger automated deployments based on the stored hashes.
Conclusion
Integrating Solana with GitHub Workflows provides a powerful way to enhance the security, transparency, and efficiency of your CI/CD pipelines.
By leveraging Solana’s blockchain technology, you can ensure the integrity and immutability of your build artifacts, automate deployment processes, and maintain transparent audit trails.
I have used solutions similar to this previously; by automatically adding a containers hash to an immutable database when it passes testing, while at the same time ensuring that the only images permissable for deployment in the next environment up (e.g. Production) exist on that list, you can (at least help to) ensure that only approved code is deployed.
In the ever-evolving landscape of software development, ensuring the integrity and security of build artifacts is paramount. As CI/CD pipelines become more sophisticated, integrating cryptocurrency technologies can provide a robust solution for managing and securing build artifacts. This blog post delves into the concept of immutable build artifacts and how crypto technologies can enhance CI/CD pipelines.
Understanding CI/CD Pipelines
CI/CD pipelines are automated workflows that streamline the process of integrating, testing, and deploying code changes. They aim to:
Continuous Integration (CI): Automatically integrate code changes from multiple contributors into a shared repository, ensuring a stable and functional codebase.
Continuous Deployment (CD): Automatically deploy integrated code to production environments, delivering new features and fixes to users quickly and reliably.
The Importance of Immutable Build Artifacts
Build artifacts are the compiled binaries, libraries, and other files generated during the build process. Ensuring these artifacts are immutable—unchangeable once created—is crucial for several reasons:
Security: Prevents tampering and unauthorized modifications.
Reproducibility: Ensures that the same artifact can be deployed consistently across different environments.
Auditability: Provides a clear and verifiable history of artifacts.
Leveraging Crypto Technologies for Immutable Build Artifacts
Decentralization: Distributes data across multiple nodes, reducing the risk of a single point of failure.
Immutability: Ensures that once data is written, it cannot be altered or deleted.
Transparency: Provides a transparent and auditable history of all transactions.
Implementing Immutable Build Artifacts in CI/CD Pipelines
Generate Build Artifacts: During the CI process, generate the build artifacts as usual.
   # Example: Building a Docker image
   docker build -t my-app:latest .
Create a Cryptographic Hash: Generate a cryptographic hash (e.g., SHA-256) of the build artifact to ensure its integrity.
   # Example: Generating a SHA-256 hash of a Docker image
   docker save my-app:latest | sha256sum
Store the Hash on a Blockchain: Store the cryptographic hash on a blockchain to ensure immutability and transparency.
   # Example: Using a blockchain-based storage service
   blockchain-store --hash <generated-hash> --metadata "Build #123"
Retrieve and Verify the Hash: When deploying the artifact, retrieve the hash from the blockchain and verify it against the artifact to ensure integrity.
Verify the artifact’s integrity using the retrieved hash.
Deploy the verified artifact to the production environment.
Benefits of Using Immutable Build Artifacts
Enhanced Security: Blockchain’s immutable nature ensures that build artifacts are secure and tamper-proof.
Improved Reproducibility: Immutable artifacts guarantee consistent deployments across different environments.
Increased Transparency: Blockchain provides a transparent and auditable history of all build artifacts.
Conclusion
Integrating cryptocurrency technologies with CI/CD pipelines to manage immutable build artifacts offers a range of benefits that enhance security, reproducibility, and transparency. By leveraging blockchain’s decentralized and immutable nature, organizations can ensure the integrity and authenticity of their build artifacts, providing a robust foundation for their CI/CD processes.
As the software development landscape continues to evolve, embracing these cutting-edge technologies will be crucial for maintaining a competitive edge and ensuring the reliability and security of software deployments. By implementing immutable build artifacts, organizations can build a more secure and efficient CI/CD pipeline, paving the way for future innovations.
This post covers a lot (very quickly and reasonably easily);
It starts with using Kuberenets in Docker (KinD) to create a minimal but functional local Kubernetes Cluster. Then, ArgoCD is setup and a sample app is deployed to the cluster. Finally, k8sgpt is configured and a basic analysis of the cluster is run.
The main point of all of this was to try out k8sgpt in a safe and disposable environment.
Possible Fix: Address any issues preventing the deployment from scaling, such as resource constraints or scheduling issues.
Conclusion
Ok, addmitedly that was a bit of a whirlwind, but if you followed it you have successfully deployed ArgoCD to a kind cluster, deployed an application using ArgoCD to that new cluster, then inspected the cluster & app using K8sGPT.
The example output and associated actions provide guidance on how to address common issues identified by K8sGPT.
This setup allows you to manage your applications and monitor the health of your Kubernetes cluster effectively, and being able to spin up a disposable cluster like this is handy for many reasons.
Next, you need java installed to run the jar file with, the easist way for this (and for adding lots of other useful tools to your Mac) is to use HomeBrew, install instructions for that are here:
My notes on setting up Frigate NVR for a home CCTV setup.
The main focus of this post is on object detection (utilising a Google Coral TPU) and configuring notifications to Amazon Fire TVs (and other devices) via intregration with HomeAssistant.
There’s a lot to cover and no point in reproducing the existing documentation, you can find full details & info on setting up the main components here:
I used Zoneminder for many years to capture and display my home CCTV cameras. There are several posts – going back to around 2016 – on this site under the ZoneMinder category here
This worked really well for me all that time, but I was never able to setup Object Detection in a way I liked – it can be done in a number of different ways, but everything I tried out was either very resource intensive, required linking to Cloud services like TensorFlow for processing, or was just too flaky and unreliable. It was fun trying them out, but none of them ever suited my needs. Integration and notification options were also possible, but were not straightforward.
So, I eventually took the plunge and switched to Frigate along with HomeAssistant. There was a lot to learn and figure out, so I’m posting some general info here in case it helps other people – or myself in future when I wonder why/how I did things this way….
Hardware
I have 4 CCTV cameras, these are generic and cheap 1080p Network IP cameras, connected via Ethernet. I don’t permit them any direct access to the Internet for notifications, updates, event analysis or anything.
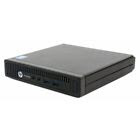
I ran ZoneMinder (the server software that manages and presents the feeds from the cameras) on various hardware over the years, but for the Frigate and HomeAssistant setup I have gone for an energy-efficient and quiet little “server” – an HP ProDesk 600 G1 Mini – it’s very very basic and very low powered… and cost £40 on eBay:
After testing Object Detection using the CPU (this is waaaay too much load for the CPU to cope with longer-term, but really helps to test proves the concept) I have since added a Google Coral Edge TPU to the host via USB. This enables me to offload the detection/inference work to the TPU and spare the little CPU’s energy for other tasks:
Objectives
My key goals here were to:
Setup and trial Frigate – to see if it could fit my requirements and replace ZoneMinder
Add Object Detection – without having to throw a lot of hardware at it or use Cloud Services like TensorFlow
Integrate with HomeAssistant – I’d been wanting to try this for a while, to integrate my HomeKit devices with other things like Sonos, Amazon Fire TVs, etc
Note that you do not need to use HomeAssistant or MQTT in order to use or try Frigate, it can run as a standalone insatnce if you like. Frigate also comes with its own web interface which is very good, and I run this full-screen/kiosk mode on one of my monitors.
Setup and trial Frigate: setting up Frigate was easy, I went for Ubuntu on my host and installed Docker on that, then configured Frigate and MQTT containers to communicate. These are both simply declared in the Frigate config like this:
mqtt:
  host: 192.168.0.27
detectors:
  coral:
    type: edgetpu
    device: usb
Add Object Detection: with Frigate, this can be done by a Google Coral Edge TPU (pic above) – more info here: https://coral.ai/products/accelerator/ and details on my config below. I first trialled this using the host CPU and it ‘worked’ but was very CPU intensive: adding the dedicated TPU makes a massive difference and inference speeds are usually around 10ms for analysis of 4 HD feeds. This means the host CPU is free to focus on running other things (which is just as well given the size of the thing).
Integrate with HomeAssistant : Added the HomeAssistant Docker instance to my host, then ran and configured MQTT container for Frigate then configured Frigate + HomeAssistant to work together. This was done by first installing HACS in HA, then using the Frigate Integration as explained here: https://docs.frigate.video/integrations/home-assistant/
Setup Notifications
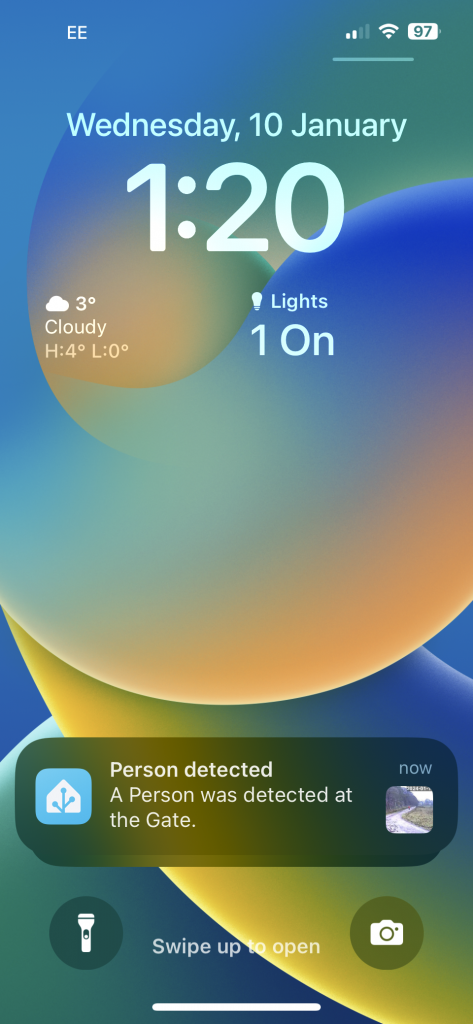
Phone notifications – I have previosuly had (and postedabout my) issues with CGNAT and expected I would need to set up and ngrok tunnel and certs and jump through all sorts of hoops to get HA working remotely.
I trialled this and was so impressed I have already signed up for a year – it’s well worth it for me and makes things much simpler. Phone notifications can be setup under HomeAssistant > Settings > Automations and Scenes > Frigate Notifications – after installing the Frigate Notifications Bueprint via HACS.
I can now open HomeAssistant on my phone from anywhere in the World and view a dashboard that has live feeds from my CCTV cameras at home. I have also set it up to show recently detected objects from certain cameras too.
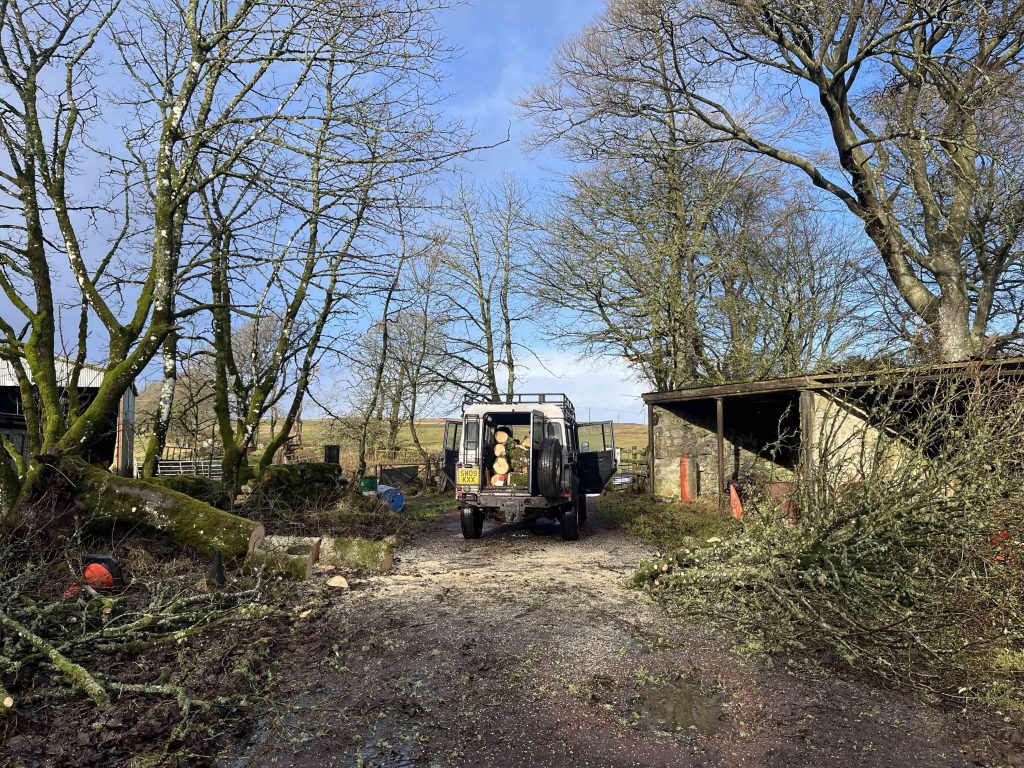
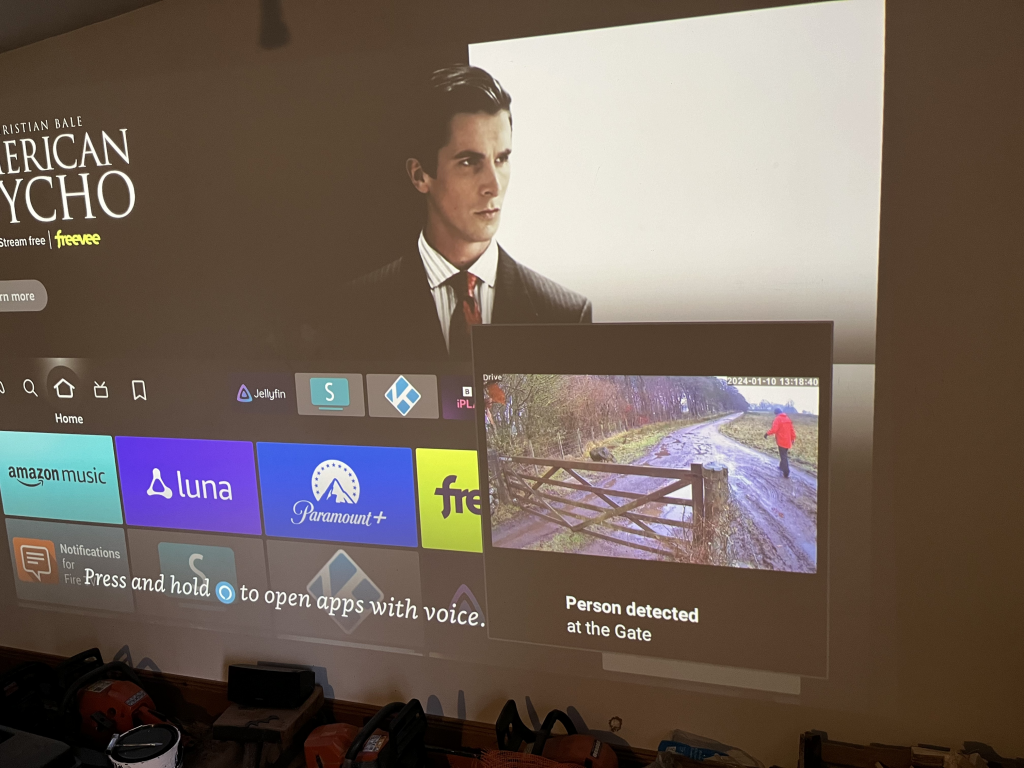
This is a quick (and poor quality) pic of my projector screen (and chainsaw collection) with an Amazon Fire TV 4k displaying a pop-up notification in the bottom-right corner:
This means I now don’t need to leave a monitor on showing my CCTV feeds any more, as I am notified either via my mobile or on screen. And my notifications are only set up for specific object types – people & cars, and not for things it picks up frequently that I don’t want to be alerted on, like birds or passing sheep or cows.
Minor Apple Watch update – these notifications are also picked up on my Apple Watch, which is set to display my phone notifications. So I also get a short video clip of the key frames which is pretty awesome and works well.
My Frigate Config – here’s an example from the main “driveway” camera feed, this is the one I want to be montoring & ntoified about most. It’s using RTSP to connect, record and detect the listed object types that I am interested in:
The full 24/7 recordings are all kept (one file/hour) for a few days then deleted and can be seen via HA under Media > Frigate > Recordings > {camera name} > {date}> {hour}
Docker container start scripts
A note of the scripts I use to start the various docker containers.
This would be much better managed under Docker Compose or something, there are plenty of examples of that online, but I’d like to look at setting all of this up on Kubernetes so leaving this as rough as it is for now.
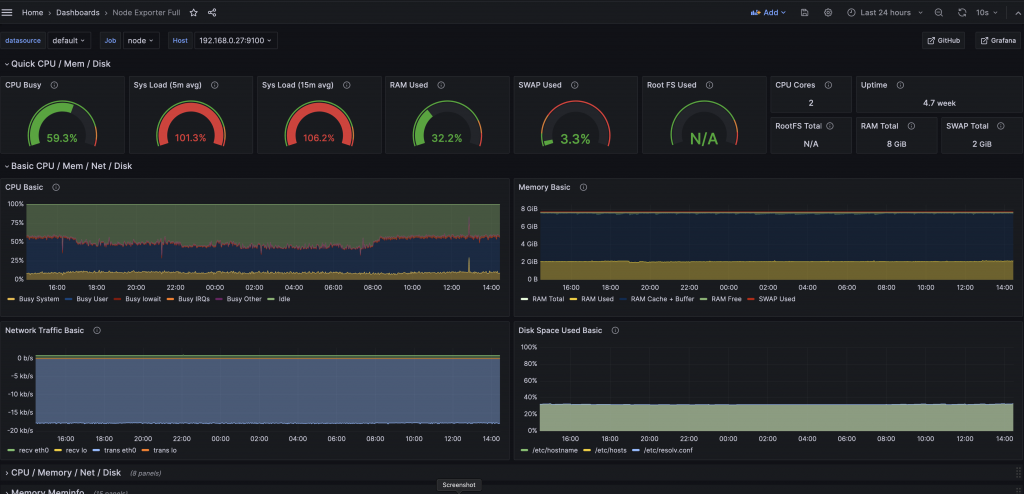
I am also running Grafana and NodeExporter at the moment to keep an eye on the stats, although things would probably look less worrying if I wasn’t adding to the load just to monitor them:
<help!>
I’ll need to do something about that system load; it’s tempting to just get a second HP host & Coral TPU and put some of the load and half of the cameras on that – will see… a k8s cluster of them would be neat.