Kubernetes Operators for Monitoring with Prometheus and Grafana Dashboards

Introduction

This post takes a look at setting up monitoring and alerting in Kubernetes, using Helm and Kubernetes Operators to deploy and configure Prometheus and Grafana.

This platform is quickly and easily deployed to the cluster using a Helm Chart, which in turn uses a Kubernetes Operator, to setup all of the required resources in an existing Kubernetes Cluster.

I’m re-using the Minikube Kubernetes cluster with Helm that was built and described in previous posts here and here, but the same steps should work for any working Kubernetes & Helm setup.

An example Grafana Dashboard for Kubernetes monitoring is then imported and we take a quick look at monitoring of Cluster components with other dashboards

Kubernetes Operators & Helm combo

K8s Operators are described ‘in plain English’ here:
https://enterprisersproject.com/article/2019/2/kubernetes-operators-plain-english

and defined by CoreOS as “a method of packaging, deploying and managing a Kubernetes application

The Operator used in this post can be seen here:

https://github.com/coreos/prometheus-operator

and this is deployed to the Cluster using this Helm Chart:

https://github.com/helm/charts/tree/master/stable/prometheus-operator

It may sound like Helm and Operators do much the same thing, but they are different and complimentary

Helm and Operators are complementary technologies. Helm is geared towards performing day-1 operations of templatization and deployment of Kubernetes YAMLs — in this case Operator deployment. Operator is geared towards handling day-2 operations of managing application workloads on Kubernetes.

from https://medium.com/@cloudark/kubernetes-operators-and-helm-it-takes-two-to-tango-3ff6dcf65619

Let’s get (re)started

I’m reusing the Minikube cluster from previous posts, so start it back up with:

minikube start

which outputs the following in the console

🎉  minikube 1.10.1 is available! Download it: https://github.com/kubernetes/minikube/releases/tag/v1.10.1
💡  To disable this notice, run: ‘minikube config set WantUpdateNotification false’

🙄  minikube v1.9.2 on Darwin 10.13.6
✨  Using the virtualbox driver based on existing profile
👍  Starting control plane node m01 in cluster minikube
🔄  Restarting existing virtualbox VM for “minikube” …
🐳  Preparing Kubernetes v1.18.0 on Docker 19.03.8 …
🌟  Enabling addons: dashboard, default-storageclass, helm-tiller, metrics-server, storage-provisioner
🏄  Done! kubectl is now configured to use “minikube”

this all looks ok, and includes the minikube addons I’d selected previously.
Now a quick check to make sure my local helm repo is up to date:

helm repo update

I then used this command to find the latest version of the stable prometheus-operator via a helm search:
helm search stable/prometheus-operator --versions | head -2

there’s no doubt a neater/builtin way to find out the latest version, but this did the job – I’m going to install 8.13.8:

install the prometheus operator using Helm, in to a new dedicated “monitoring” namespace just takes this one command:
helm install stable/prometheus-operator --version=8.13.8 --name=monitoring --namespace=monitoring

Ooops

that should normally be it, but for me, this resulted in some issues along these lines:

Error: Get http://localhost:8080/version?timeout=32s: dial tcp 127.0.0.1:8080: connect: connection refused

– looks like Helm can’t communicate with Tiller any more; I confirmed this with a simple helm ls which also failed with the same message. This shouldn’t be a problem when v3 of Helm goes “tillerless”, but to fix this quickly I simply re-enabled Tiller in my cluster via Minikube Addons:


➞  minikube addons disable helm-tiller
➞  minikube addons enable helm-tiller

verified things worked again with helm ls, then the helm install... command worked and started to do its thing…

New Operator and Namespace

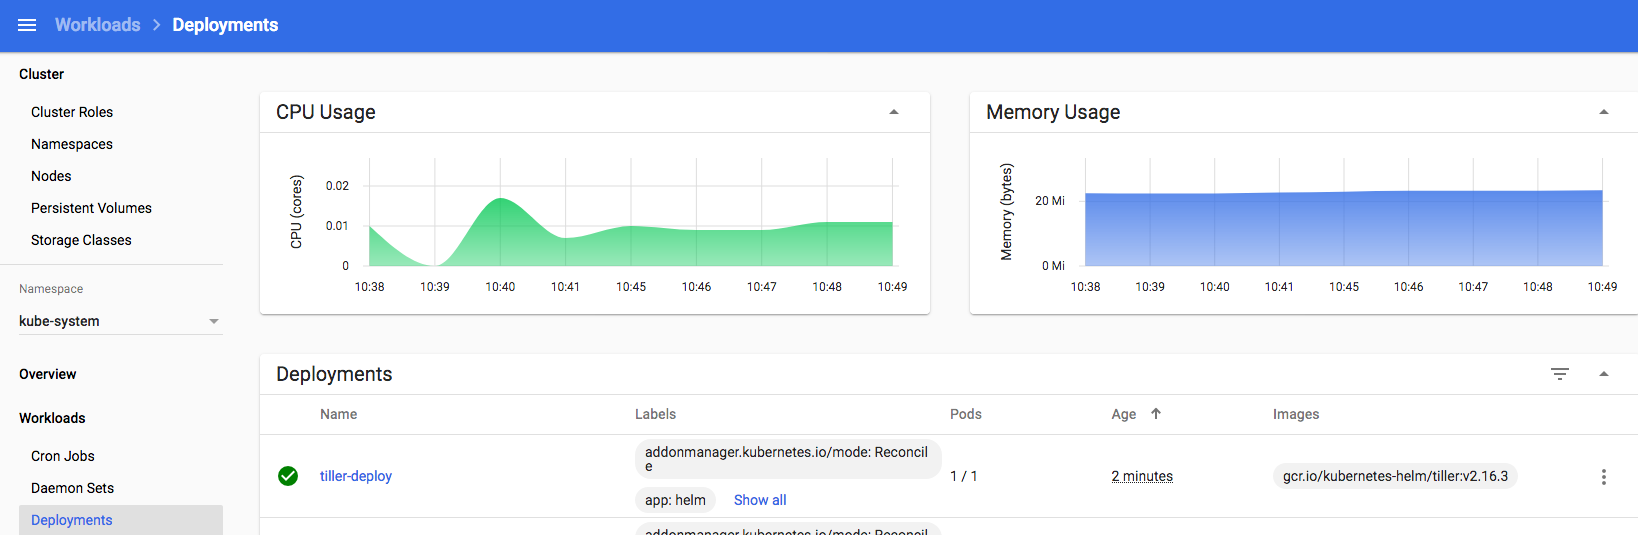
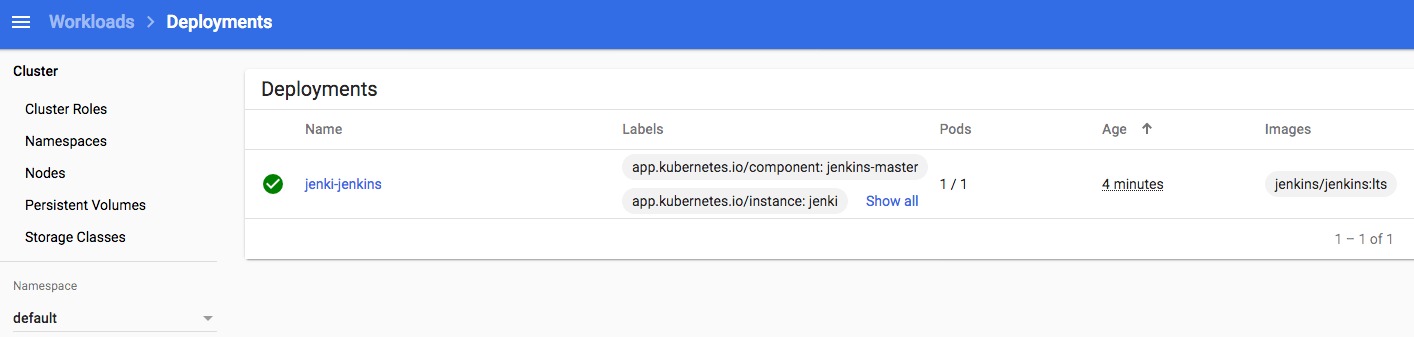
Keeping an eye on progress in my k8s dashboard, I can see the new “monitoring” namespace has been created, and the various Operator components are being downloaded, started up and configured:

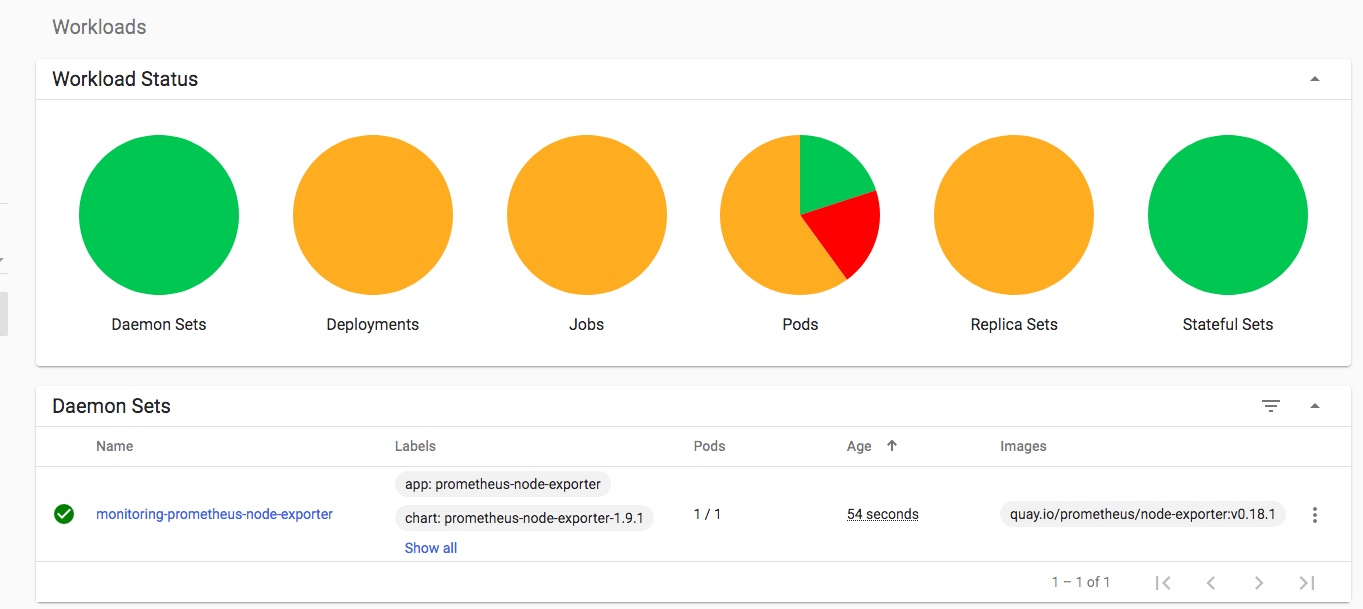
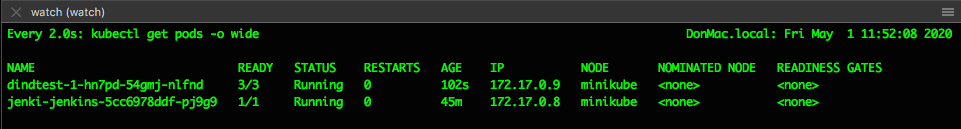
you can also keep an eye on progress with:
watch -d kubectl get po --namespace=monitoring

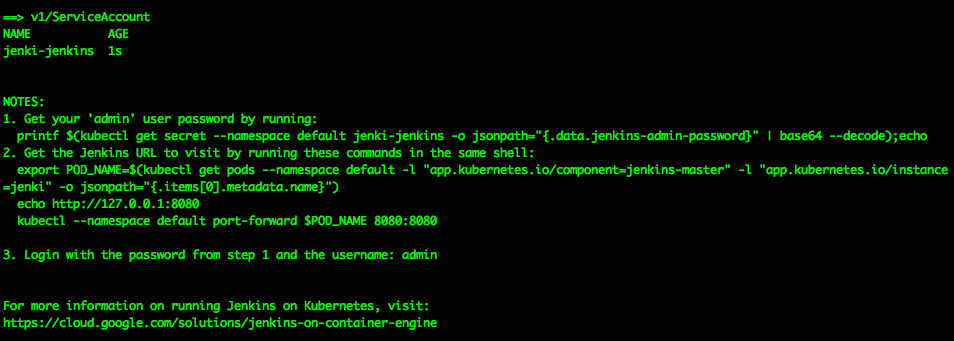
this takes a while on my machine, but eventually completes with this console output:

NOTES:
The Prometheus Operator has been installed. Check its status by running:
  kubectl –namespace monitoring get pods -l “release=monitoring”

Visit https://github.com/coreos/prometheus-operator for instructions on how
to create & configure Alertmanager and Prometheus instances using the Operator.

kubectl get po --namespace=monitoring shows the pods now running in the cluster, and for this quick example the easiest way to get access to the new Grafana instance is to forward the pods port 3000 to localhost like this:

➞  kubectl --namespace monitoring port-forward monitoring-grafana-64d4f6fcf7-t5zkv 3000:3000

(check and adjust the above to use the full/correct name of your monitoring-grafana-* pod)

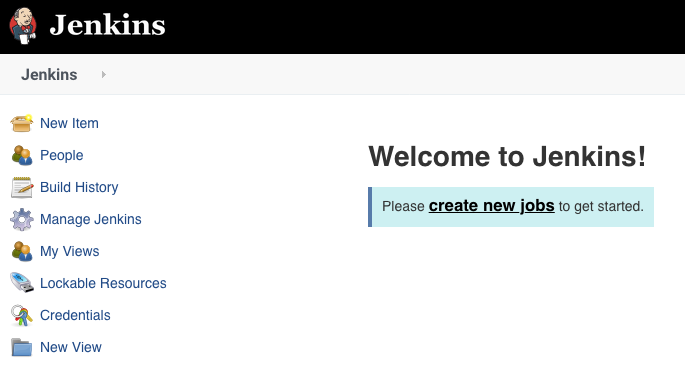
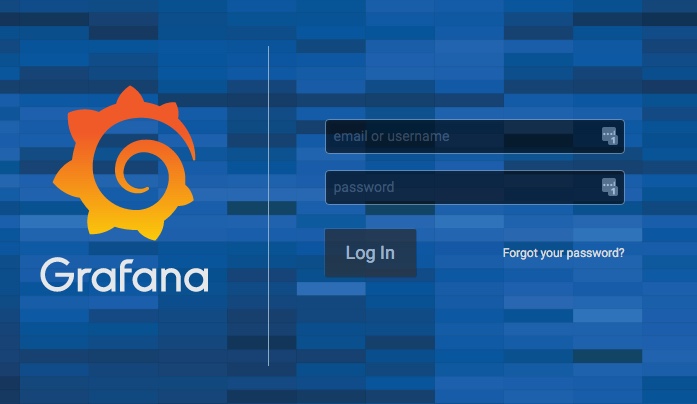
Connecting to Grafana

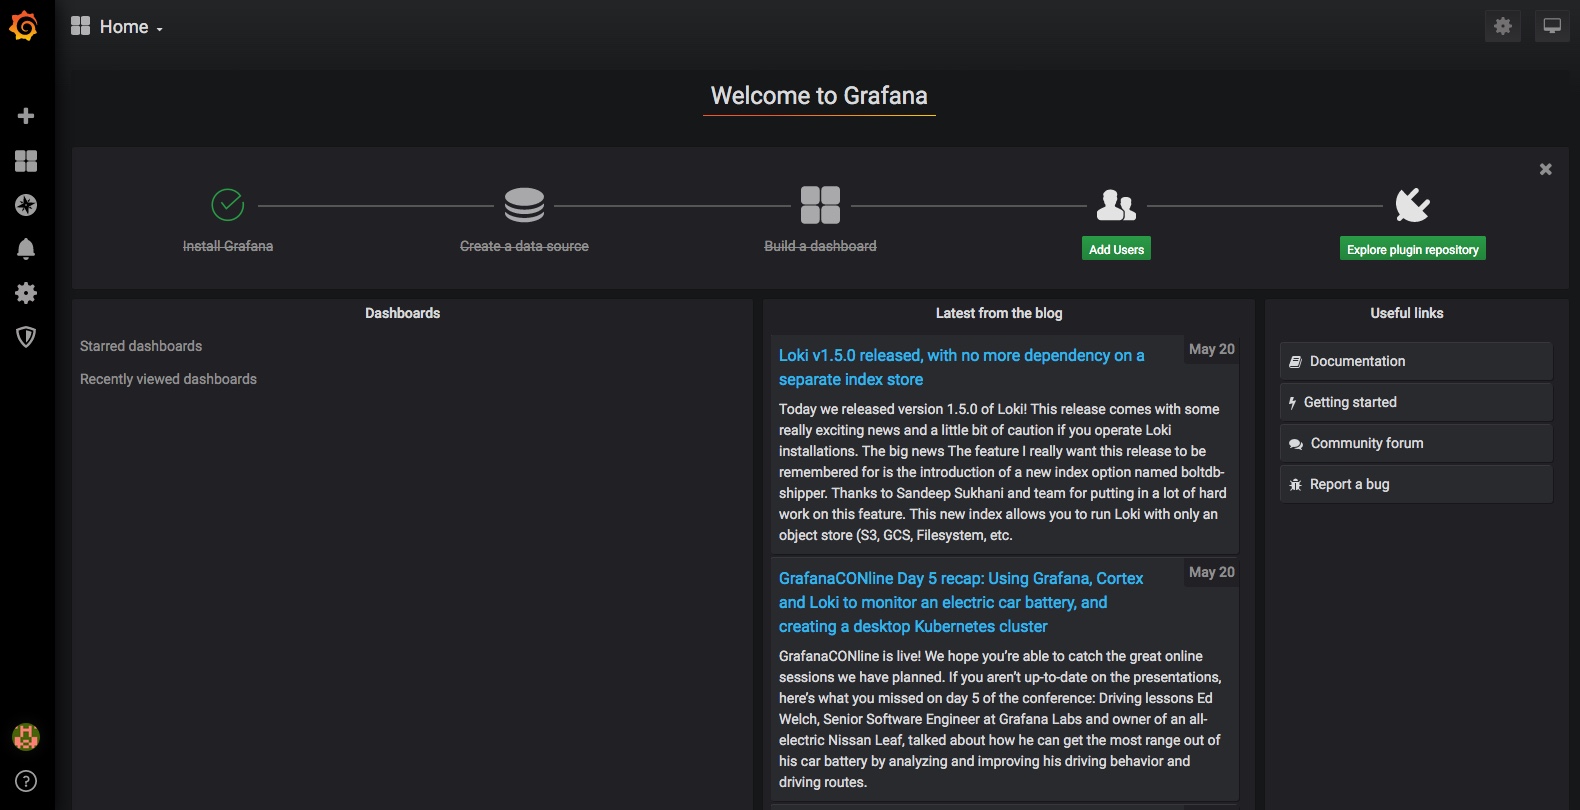
now I can hit http://localhost:3000 and have that connect to port 3000 in the Grafana pod:


from the documentation on the Helm Chart and Operator here:

https://github.com/helm/charts/tree/master/stable/prometheus-operator

the default user for this Grafana is “admin” and the password for that user is “prom-operator“, so log in with those credentials…

Grafana Dashboards for Kubernetes

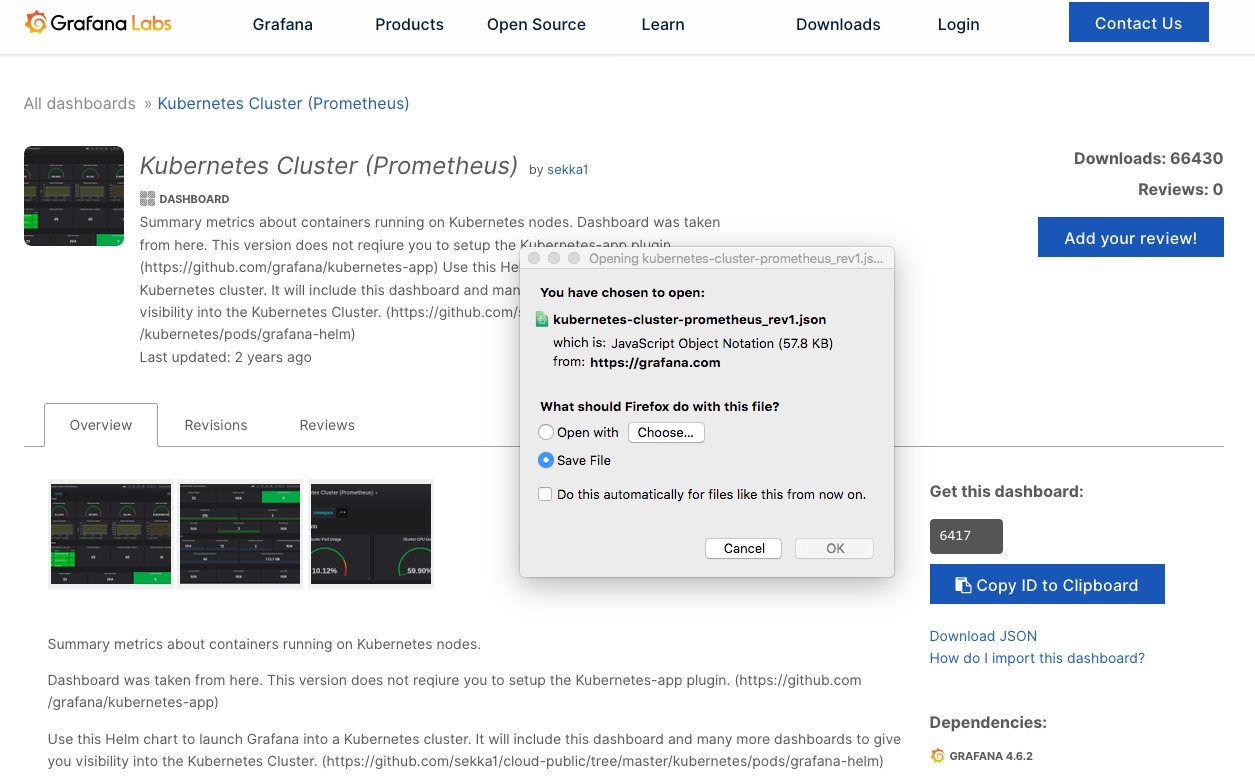
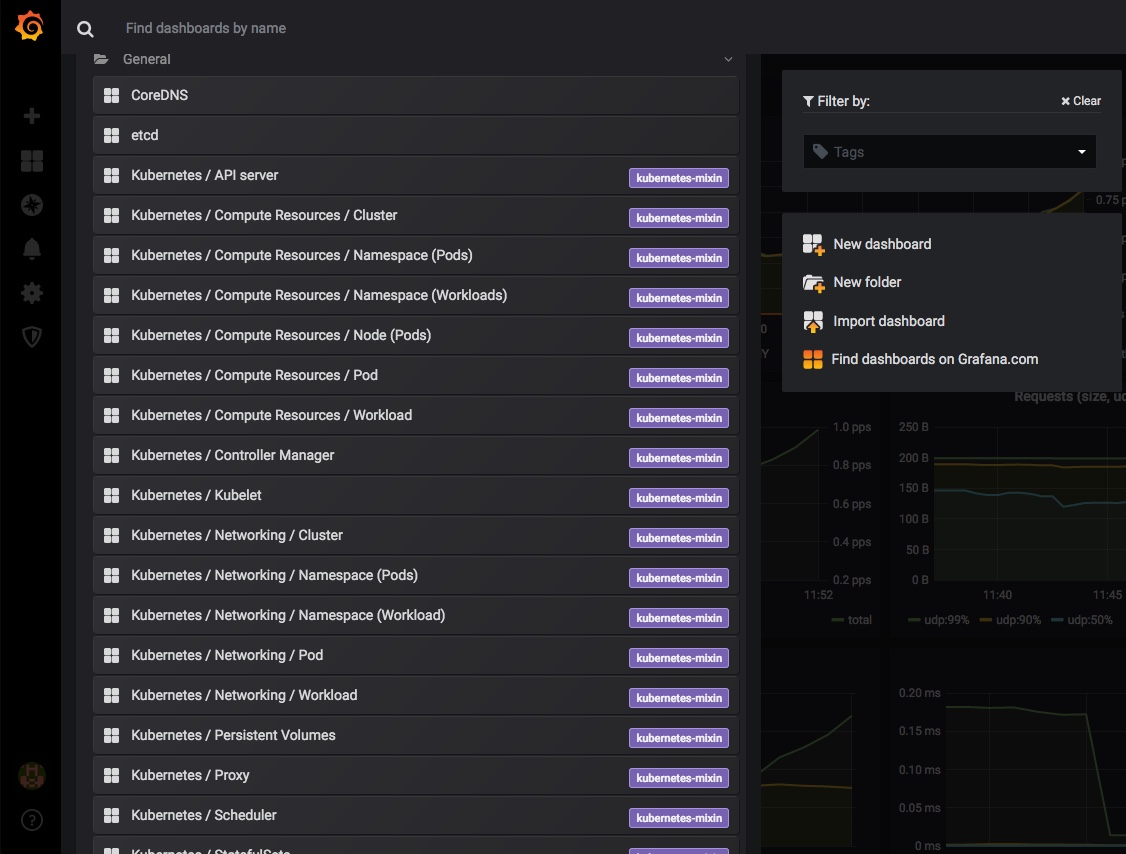
We can now use the ready-made Grafana dashboards, or add/import ones from the extensive online collection, like this one here for example: https://grafana.com/grafana/dashboards/6417 – simply save the JSON file

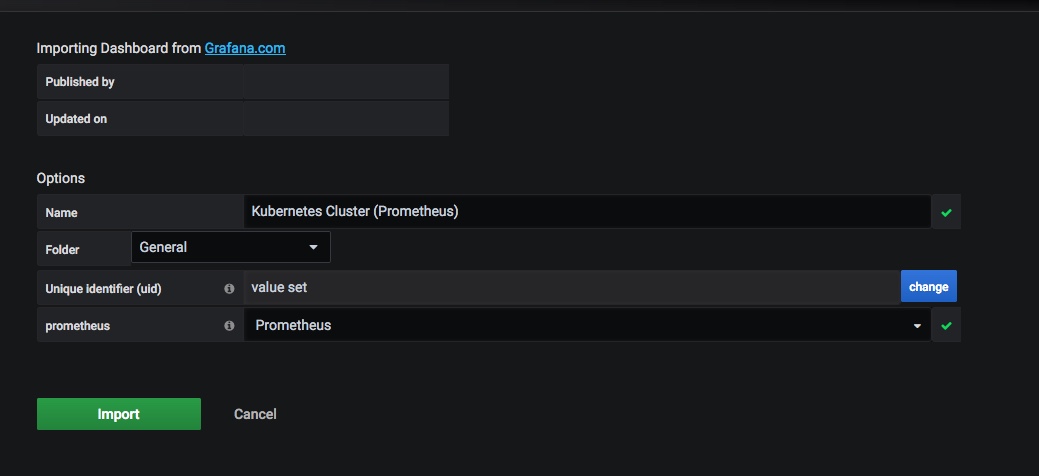
then go to Grafana and import it with these settings:

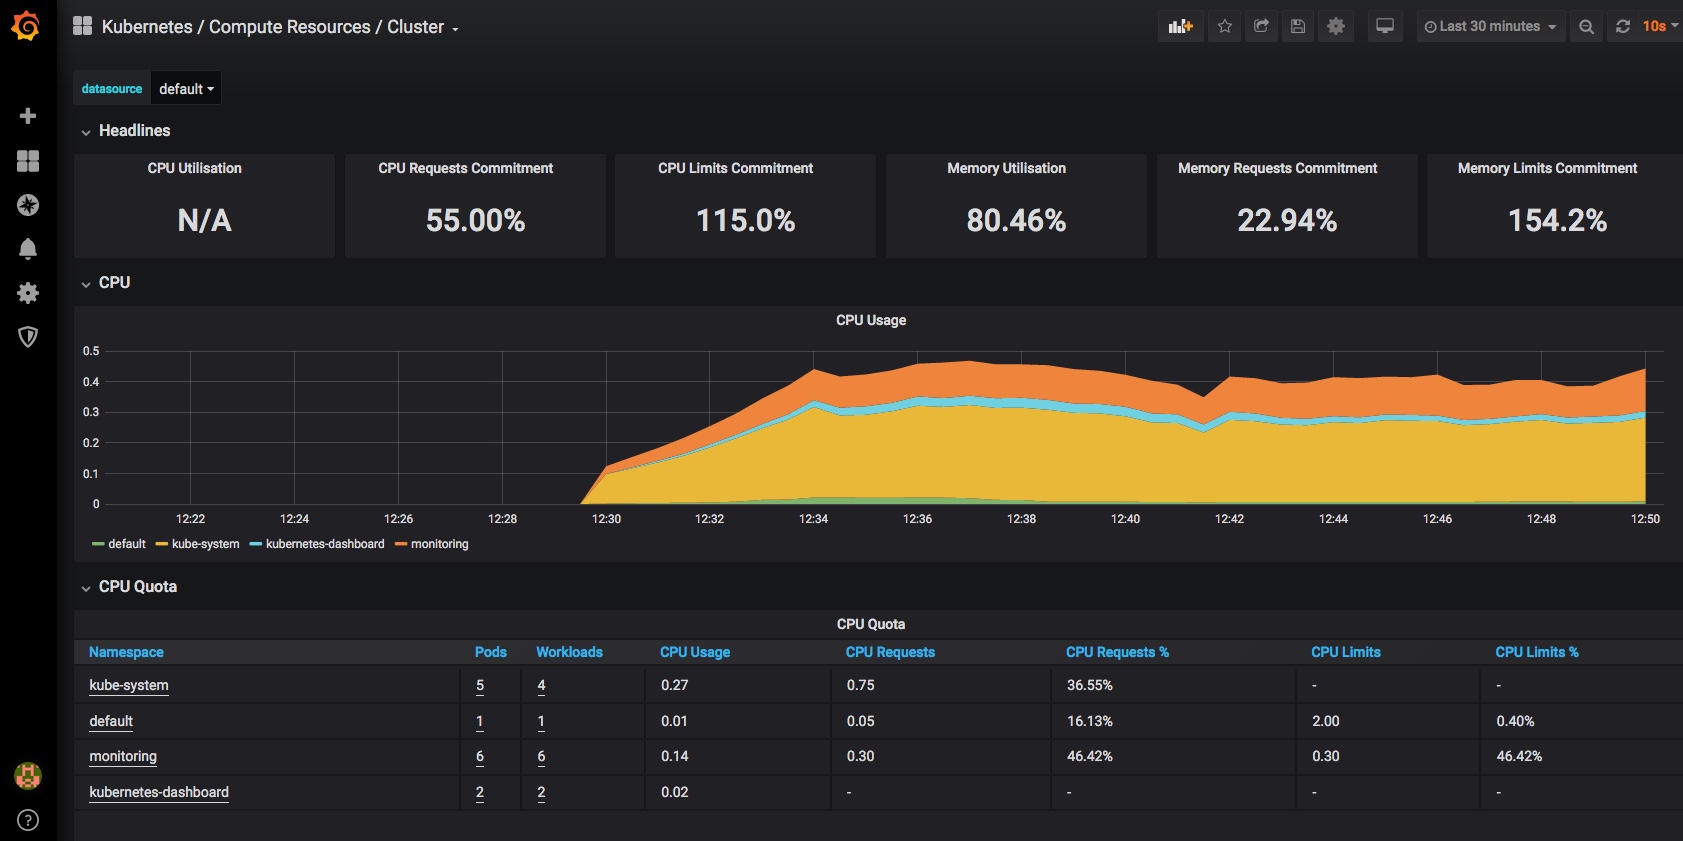
and you should now have a dashboard showing some pretty helpful stats on your kubernetes cluster, it’s health and resource usage:

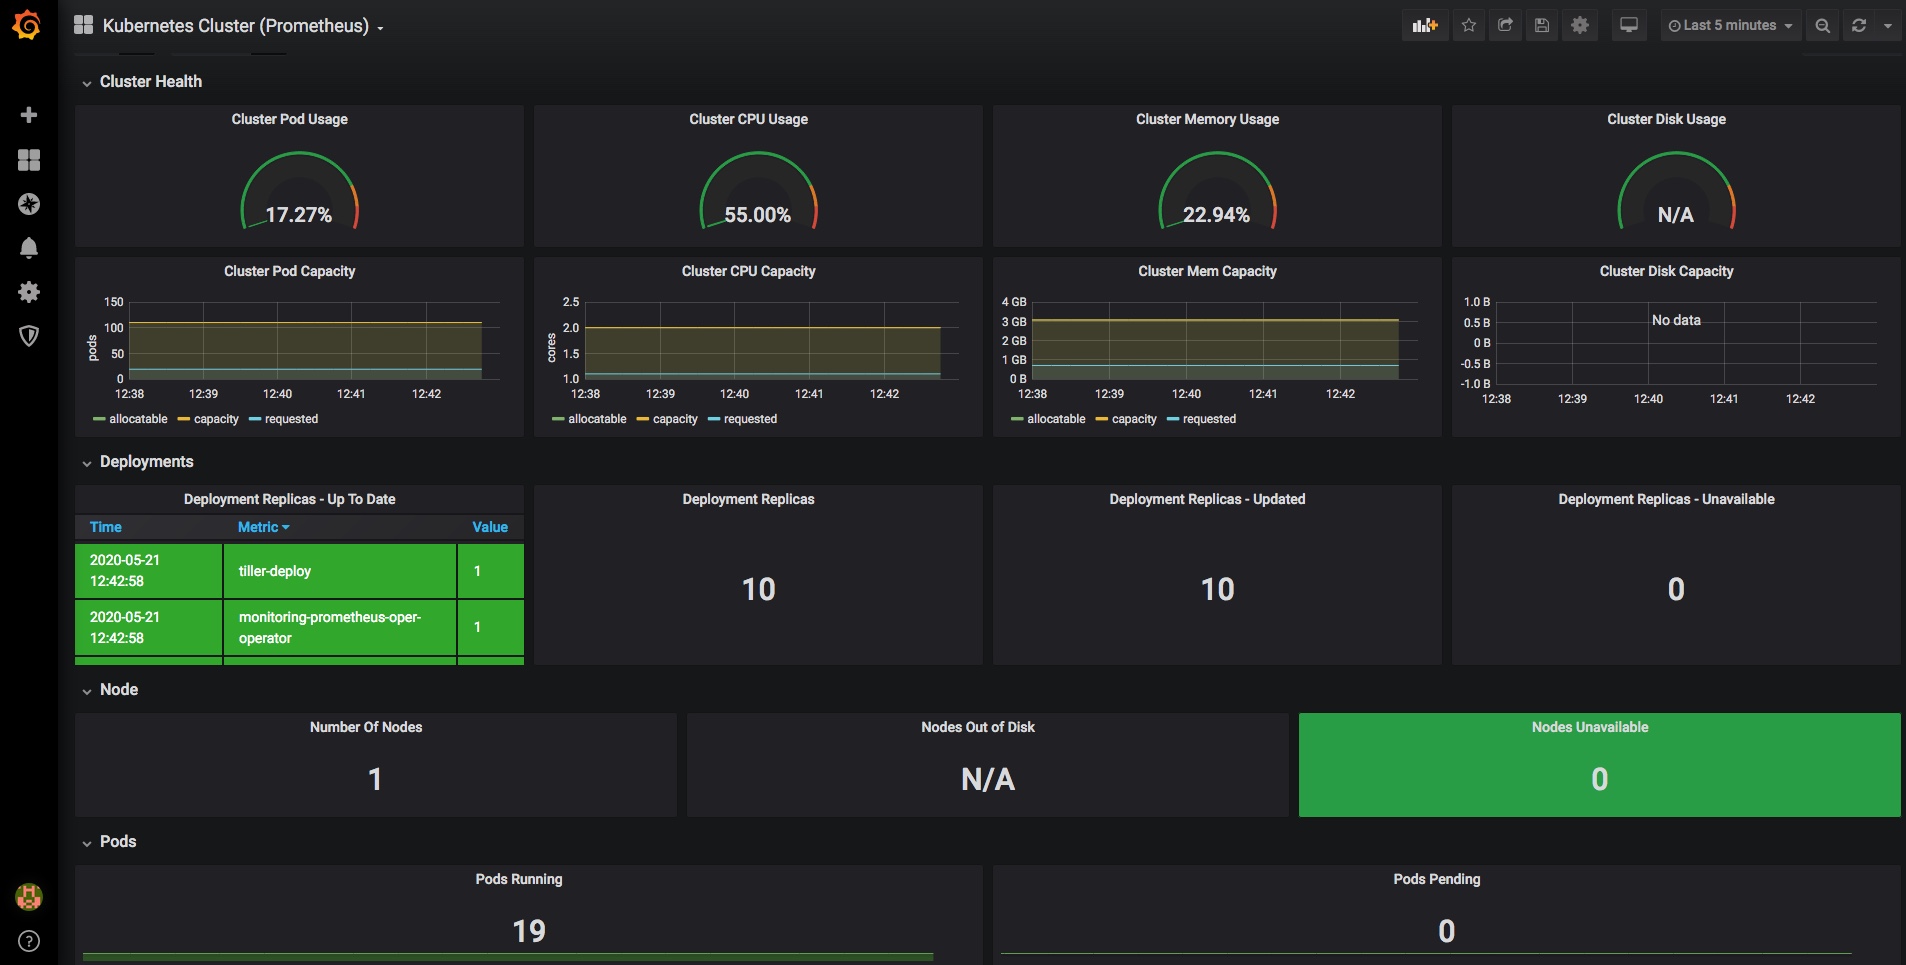
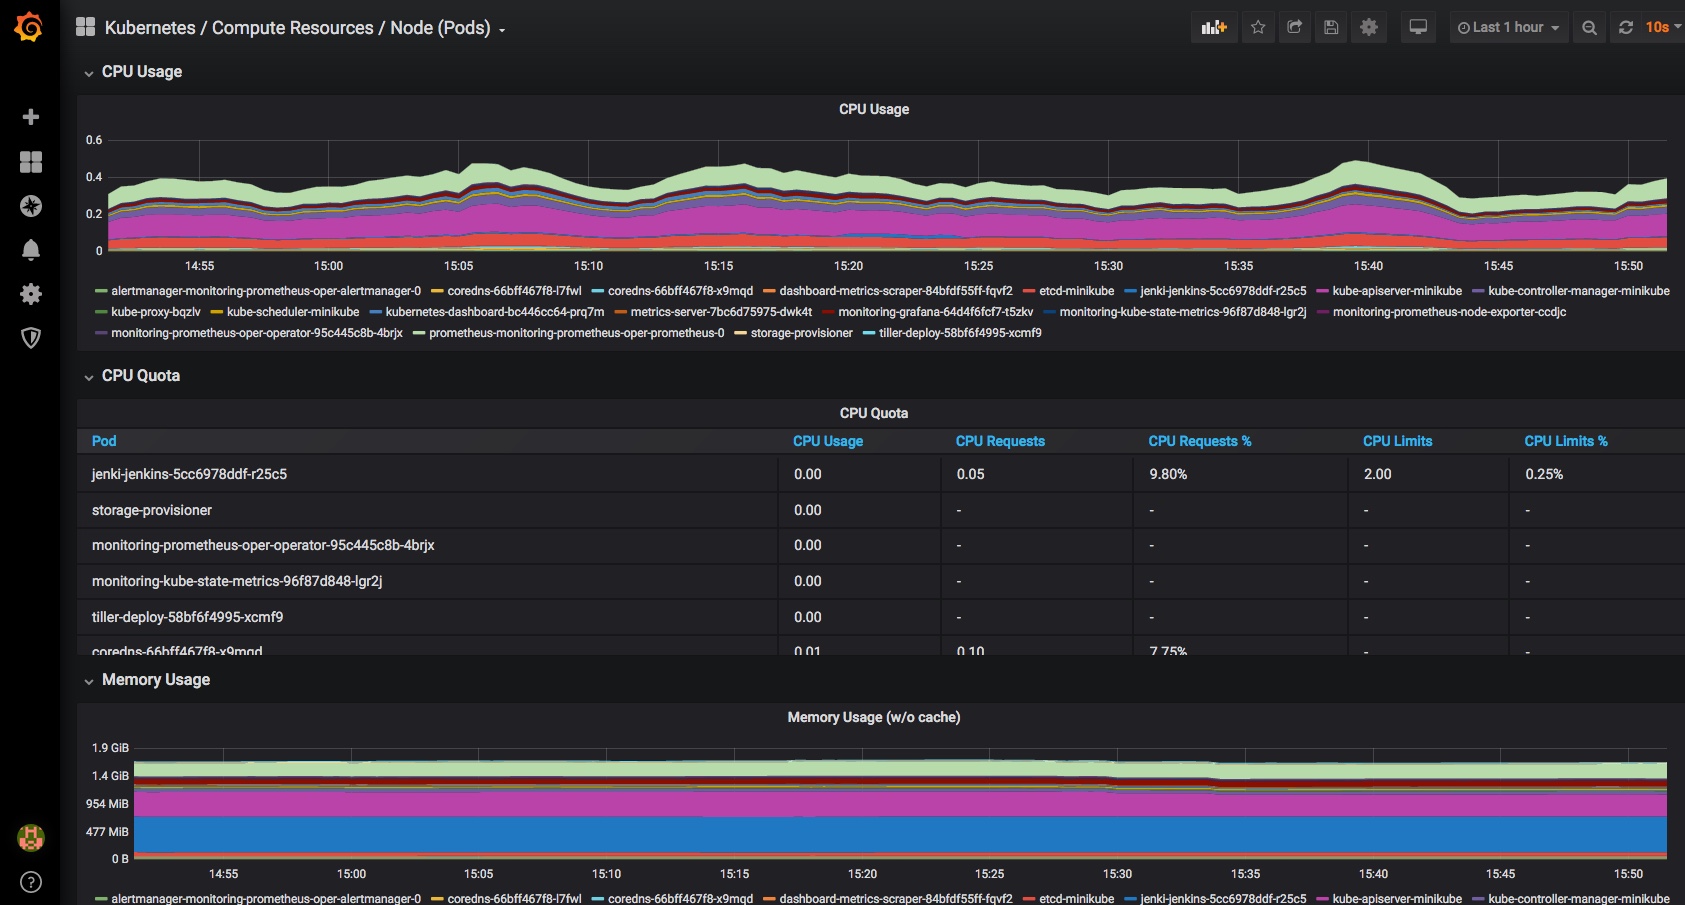
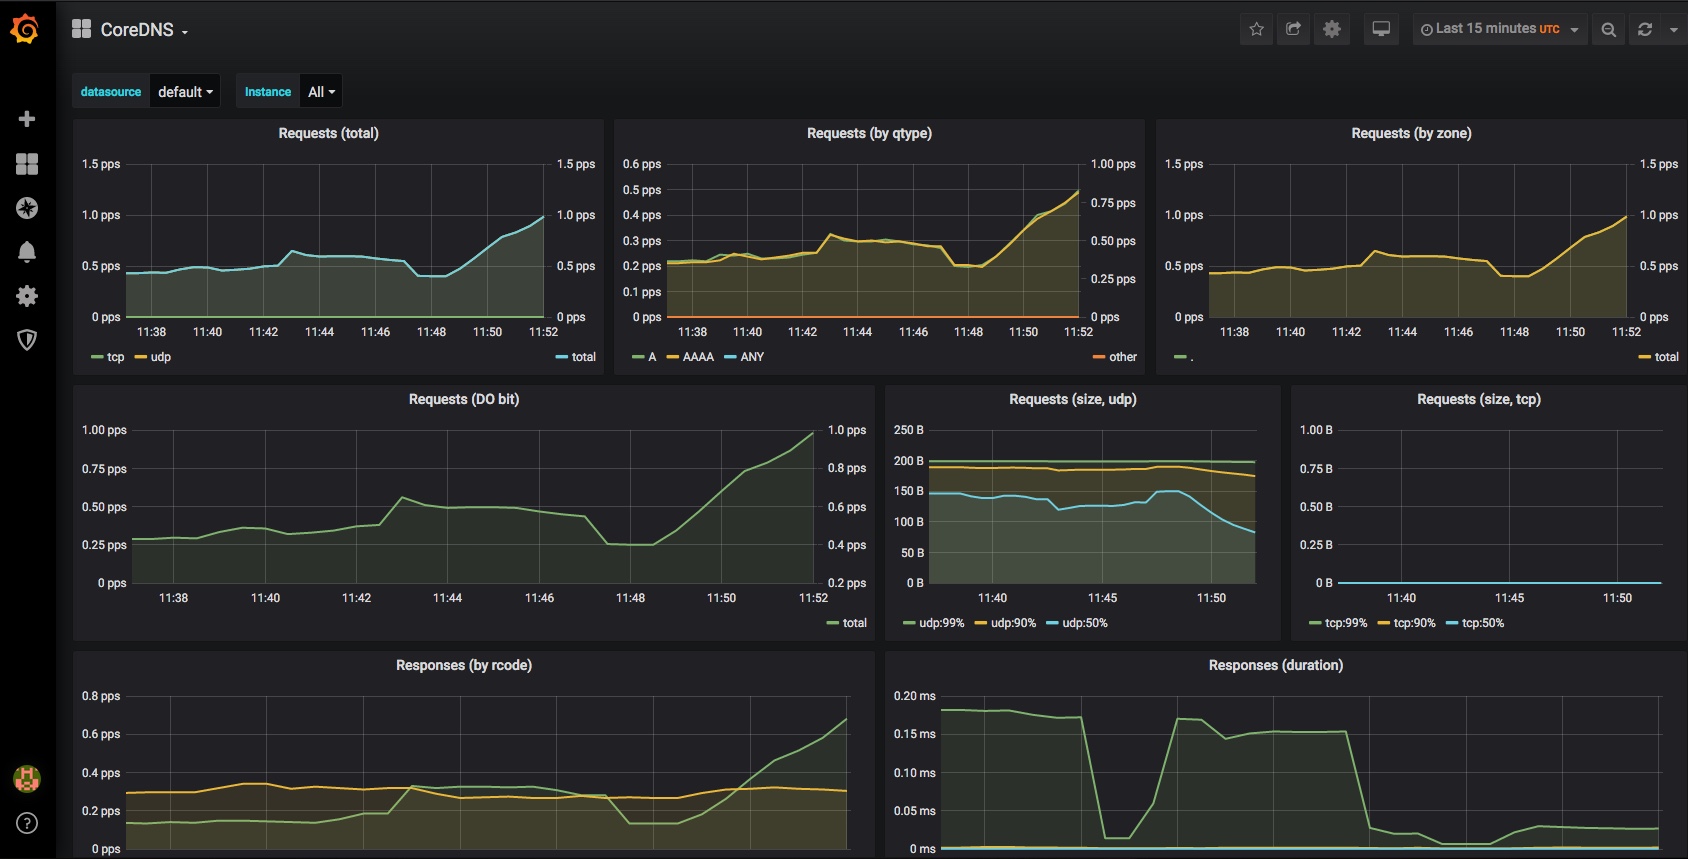
Finally a very quick look at some of the other inbuilt dashboards – you can use and adjust these to monitor all of the components that comprise your cluster and set up alerting when limits or triggers are reached:

All done & next steps

There’s a whole lot more that can be done here, and many other ways to get to this point, but I found this pretty quick and easy.

I’ve only been looking at monitoring of k8s resources here, but you can obviously set up grafana dashboards for many other things, like monitoring your deployed applications. Many applications (and charts and operators) come with prom endpoints built in, and can easily and automatically be added to your monitoring and alerting dashboards along with other datasources.

Cheers,

Don

Kubernetes – Jenkins Pipelines with Docker Agents

This is the second post on Jenkins Pipelines on Kubernetes with Minikube, following on from the initial setup steps here:

That post went as far as having a Kubernetes cluster up and running for local development. That was primarily focused on Mac, but once you reach the point of having a running Kubernetes Cluster with kubectl configured to talk to it, the hosting platform/OS makes little difference.

This second section takes a more detailed look at running Jenkins Pipelines inside the Kubernetes Cluster, and automatically provisioning Jenkins JNLP Agents via Kubernetes, then takes an in-depth look at what we can do with all of that, with a complete working example.

This post covers quite a lot:

  • Adding Helm to the Kubernetes cluster for package management
  • Deploying Jenkins on Kubernetes with Helm
  • Connecting to the Jenkins UI
  • Setting up a first Jenkins Pipeline job
  • Running our pipeline and taking a look at the results
  • What Next

Adding Helm to the Kubernetes cluster for package management

Helm is a package manager for Kubernetes, and like Minikube it is ideal for quickly setting up development environments, plus much more if you want to. Take a look through the Helm hub to see just some of the other things it can do.

On Mac you can use brew to install the local helm component:

brew install helm

and again you can use minikube addons for the k8s cluster side – note that helm v3 removes the requirement for tiller.

minikube addons enable helm-tiller

you should then see a tiller pod start up in your Kubernetes kube-system namespace:

Before you can use Helm we first need to initialise the local Helm client, so simply run:

helm init --client-only

as our earlier minikube addons command has configured the connectivity and cluster already. Before we can use Helm to install Jenkins (or any of the many other things it can do), we need to update the local repo that contains the Helm Charts:

helm repo update

Hang tight while we grab the latest from your chart repositories…
…Skip local chart repository
…Successfully got an update from the "stable" chart repository
Update Complete.

That should be Helm setup complete and ready to use now.

Deploying Jenkins on Kubernetes with Helm

Now that Helm is setup and can speak to our k8s instance, installing 100’s of software packages suddenly becomes very simple – including, Jenkins. We’ll just give the install a friendly name “jenki” and use NodePort to simplify the networking, nothing more is required for this dev setup:

helm install --set serviceType=NodePort --name jenki stable/jenkins

obviously we’re skipping over all the for-real things you may want for a longer lived Jenkins instance, like backups, persistence, resilience, authentication and authorisation etc., but this bare-bones setup is sufficient for now.

Connect to the Jenkins UI

The Helm install should spit out some helpful info like this, explaining how to get the Jenkins Admin password and how to connect to the UI:

  1. Get your ‘admin’ user password by running:
    printf $(kubectl get secret –namespace default jenki-jenkins -o jsonpath=”{.data.jenkins-admin-password}” | base64 –decode);echo
  2. Get the Jenkins URL to visit by running these commands in the same shell:
    export POD_NAME=$(kubectl get pods –namespace default -l “app.kubernetes.io/component=jenkins-master” -l “app.kubernetes.io/instance=jenki” -o jsonpath=”{.items[0].metadata.name}”)
    echo http://127.0.0.1:8080
    kubectl –namespace default port-forward $POD_NAME 8080:8080
  3. Login with the password from step 1 and the username: admin

For more information on running Jenkins on Kubernetes, visit:
https://cloud.google.com/solutions/jenkins-on-container-engine

looking something like this in the console:


going back to the Kubernetes Dashboard we can now see the “jenki” Jenkins deployment in the default namespace:

and you can monitor the pods via the console with:

watch kubectl get pods -o wide

Note: I install the useful ‘watch‘ command via brew too, along with the zsh plugin for minikube

After following the steps to get the admin password and hit the Jenkins URL http://127.0.0.1:8080 in your desktop browser, you should see the familiar “Welcome to Jenkins!” page…

Pause a moment to appreciate that this Jenkins is running in a JVM inside a Docker container on a Kubernetes Pod as a Service in a Namespace in a Kubernetes Instance that’s running inside a Virtual Machine running under a Hypervisor on a host device….

turtles all the way down

there are many things I’ve skipped over here, including looking at storage, auth, security and all the usual considerations but the aim has been to quickly and easily get to this point so we can start developing the pipelines and processes we’re really wanting to focus on.

Navigating to Manage Jenkins then Plugins Manager should show some updates already available – this proves we have connectivity to the public Jenkins Update Centre out of the box. The Kubernetes Jenkins plugin is the key thing I’m looking for – select and update if required:

If you go to http://127.0.0.1:8080/configure you should see a link at the foot of the page to the new location for “Clouds”: http://127.0.0.1:8080/configureClouds/ – that should already be configured with sufficient settings for Jenkins to use your Kubernetes cluster, but it’s worthwhile taking a look through the settings and options there. No changes should be required here now though.

Setup a first Jenkins Pipeline job

Create a new Jenkins Pipeline job and add the following settings as shown in the picture below…

In the job config page under “Pipeline”, for “Definition” select “Pipeline script from SCM” and enter the URL of this github project which contains my example pipeline code:

https://github.com/DonaldSimpson/minikube-pipelines.git

everything else can be left as the default, and should look something like this:

This means that your Job will checkout my example repo and run the pipeline Groovy code in the Jenkinsfile, which you can see here:

https://github.com/DonaldSimpson/minikube-pipelines/blob/master/Jenkinsfile

This file has been heavily commented to explain every part of the pipeline and shows what each step is doing. Taking a read through it should show you how pipelines work, how Jenkins is creating Docker Containers for the different Stages, and give you some ideas on how you could develop this simple example further.

Run it and take a look at the results

Save and run the job, and you should (eventually) see something like this:

The jobs Console Output will have a ton of info, showing everything from the container images being pulled, the git repo being cloned, the very verbose gradle build output and all the local files.

So in summary, what just happened?

Jenkins connected to Kubernetes via the Kubernetes plugin and its settings

The required Docker images (git and gradle, as specified at the top of the Jenkinsfile pipeline) were pulled from Docker Hub

A git Docker container was started up (as a new pod in k8s) and connected to Jenkins as an Agent using JNLP

A ‘git clone’ was run inside that container to check out the source code from an example repo

A gradle Docker container was started and connected as a Jenkins JNLP Agent, running as another k8s pod

The gradle build stage was run inside that gradle container, using the source files checked out from git in the previous Stage

The newly built JAR file was archived so we could use it later if wanted

The pipeline ends, and k8s will clean up the containers

This pipeline could easily be expanded to run that new JAR file as an application as demonstrated here: https://github.com/AutomatedIT/springbootjenkinspipelinedemo/blob/master/Jenkinsfile#L5, or, you could build a new Docker image containing this version of the JAR file and start that up and test it and so on. You could also automate this so that whenever the source code is changed a build is triggered that does all of this automatically and records the result… hello CI/CD!

What next?

From the above demo you can hopefully see how easy it is to create an end to end pipeline that will automatically provision Jenkins Agents running on Kubernetes for you.

You can use this functionality to quickly and safely develop pipeline processes like the one we have examined, that run across multiple Agents, using each for a particular function/step in your workflow, leaving the provisioning and housekeeping work to the underlying Kubernetes cluster. With this, you can build or pull docker images, run them, test them, start them up as other Jenkins JNLP Agents and so on, all “as code” and all fully automated.

And after all that… ?

Being able to fire up Docker containers and use them as Jenkins Agents running on a Kubernetes platform is extremely powerful in itself, but you can go a step further and start using this setup to build, deploy and manage Kubernetes resources directly, too – from Jenkins Pipelines running on the same Kubernetes Cluster – or even from one Kubernetes to another.

We’ve seen during setup that we can use kubectl to manage the k8s cluster and its components – we can also do that from within containers and stages in our pipelines, wherever they are.

This example project demonstrates just that:

https://github.com/DonaldSimpson/devdoncoin

and contains an example pipeline and supporting files to build, lint, security scan, push to registry, deploy to Kubernetes, run, test and clean up the example “doncoin” application via a Jenkins pipeline running on Kubernetes.

It also includes outlines and suggestions for expanding things even further, in to a more mature and production-ready setup, introducing things like Jenkins shared libraries, linting and testing, automating vulnerability scanning within the pipeline, and so on.

Note the docker containers used there, the kubernetes yaml file and shell script, and the simple container with kubectl inside it.

Cheers,

Don

Lockdown lumber

Some pics of a fallen beech tree being chopped up for firewood and milling.

One half of this tree had fallen on a neighbours track, and I spent a sunny afternoon self-isolating with it and a couple of chainsaws.

The “before” pics… it looks like a branch in these shots, but it was quite a lot of wood.

After some limbing and bucking and a mild case of sunburn:

Gear – the Husqvarna 365 with its 20″ bar on and a recent chain from chainsawbars did almost all of the work no problem. My old Mountfield was having an off-day.

Root cause analysis – the lower 4 foot was rotten through.
The other half of the tree is still standing and looks to be ok though.

The good bits – I left these nice and straight looking 6 and 4 foot sections in place to bring home with the tractor later.
The ends have been sealed and I plan to mill them in to 2″ planks and maybe some thicker slabs

The (panoramic) aftermath

And a truck full (ok, not quite, it was a long afternoon) of firewood that was delivered to a neighbour

Random Landy pics

Woodturning a Yew Bowl

A family friend gave me a Land Rover boot-load of old Yew wood. It’s from a very old tree, is very dense and has loads of character.

The wood had been stored in her garden for several years prior to me getting it.

There were a lot of marks, holes and cracks to work around. It also felt very hard to cut and turn, possibly due to the complex grain patterns.

I was pleased with the end result and the different colours & patterns, and have enough wood left to make several more, hopefully.

NOTE: I wore a decent mask and kept the dust extractor on while turning this, and removed as much of the bark as I could first – apparently Yew dust is highly toxic.

Pin It on Pinterest

%d bloggers like this: