MLOps for DevOps Engineers – MiniLM & MLflow pipeline demo
By Donald Simpson – Published:
As a DevOps and SRE engineer, I’ve spent a lot of time building automated, reliable pipelines and cloud platforms. Over the last couple of years, I’ve been applying the same principles to machine learning (ML) and AI projects.
One of those projects is CarHunch, a vehicle insights platform I developed. CarHunch ingests and analyses MOT data at scale, using both traditional pipelines and applied AI. Building it taught me first-hand how DevOps practices map directly onto MLOps: versioning datasets and models, tracking experiments, and automating deployment workflows. It’a a new and exciting area but the core idea is very much the same, with some interesting new tools and concepts added.
To make those ideas more approachable for other DevOps engineers, I have put together a minimal, reproducible demo using MiniLM and MLflow.
The simplest way to try this demo is with the included Makefile; that way all you need is Docker installed
# clone the repo
git clone https://github.com/DonaldSimpson/mlops_minilm_demo.git

cd mlops_minilm_demo

# build and run everything (training + MLflow UI)
make run
That one ‘make run’ command will:
– Spin up a containerised environment
– Run the demo training script (using MiniLM embeddings + Logistic Regression)
– Start the MLflow tracking server and UI
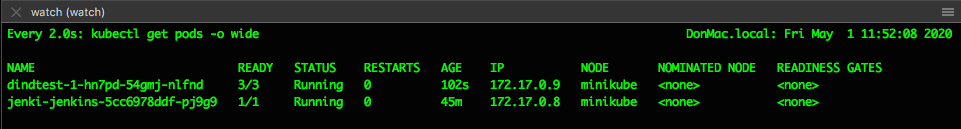
Here’s a quick screngrab of it running in the console:
Once it’s up & running, open http://localhost:5001
in your browser to explore logged experiments
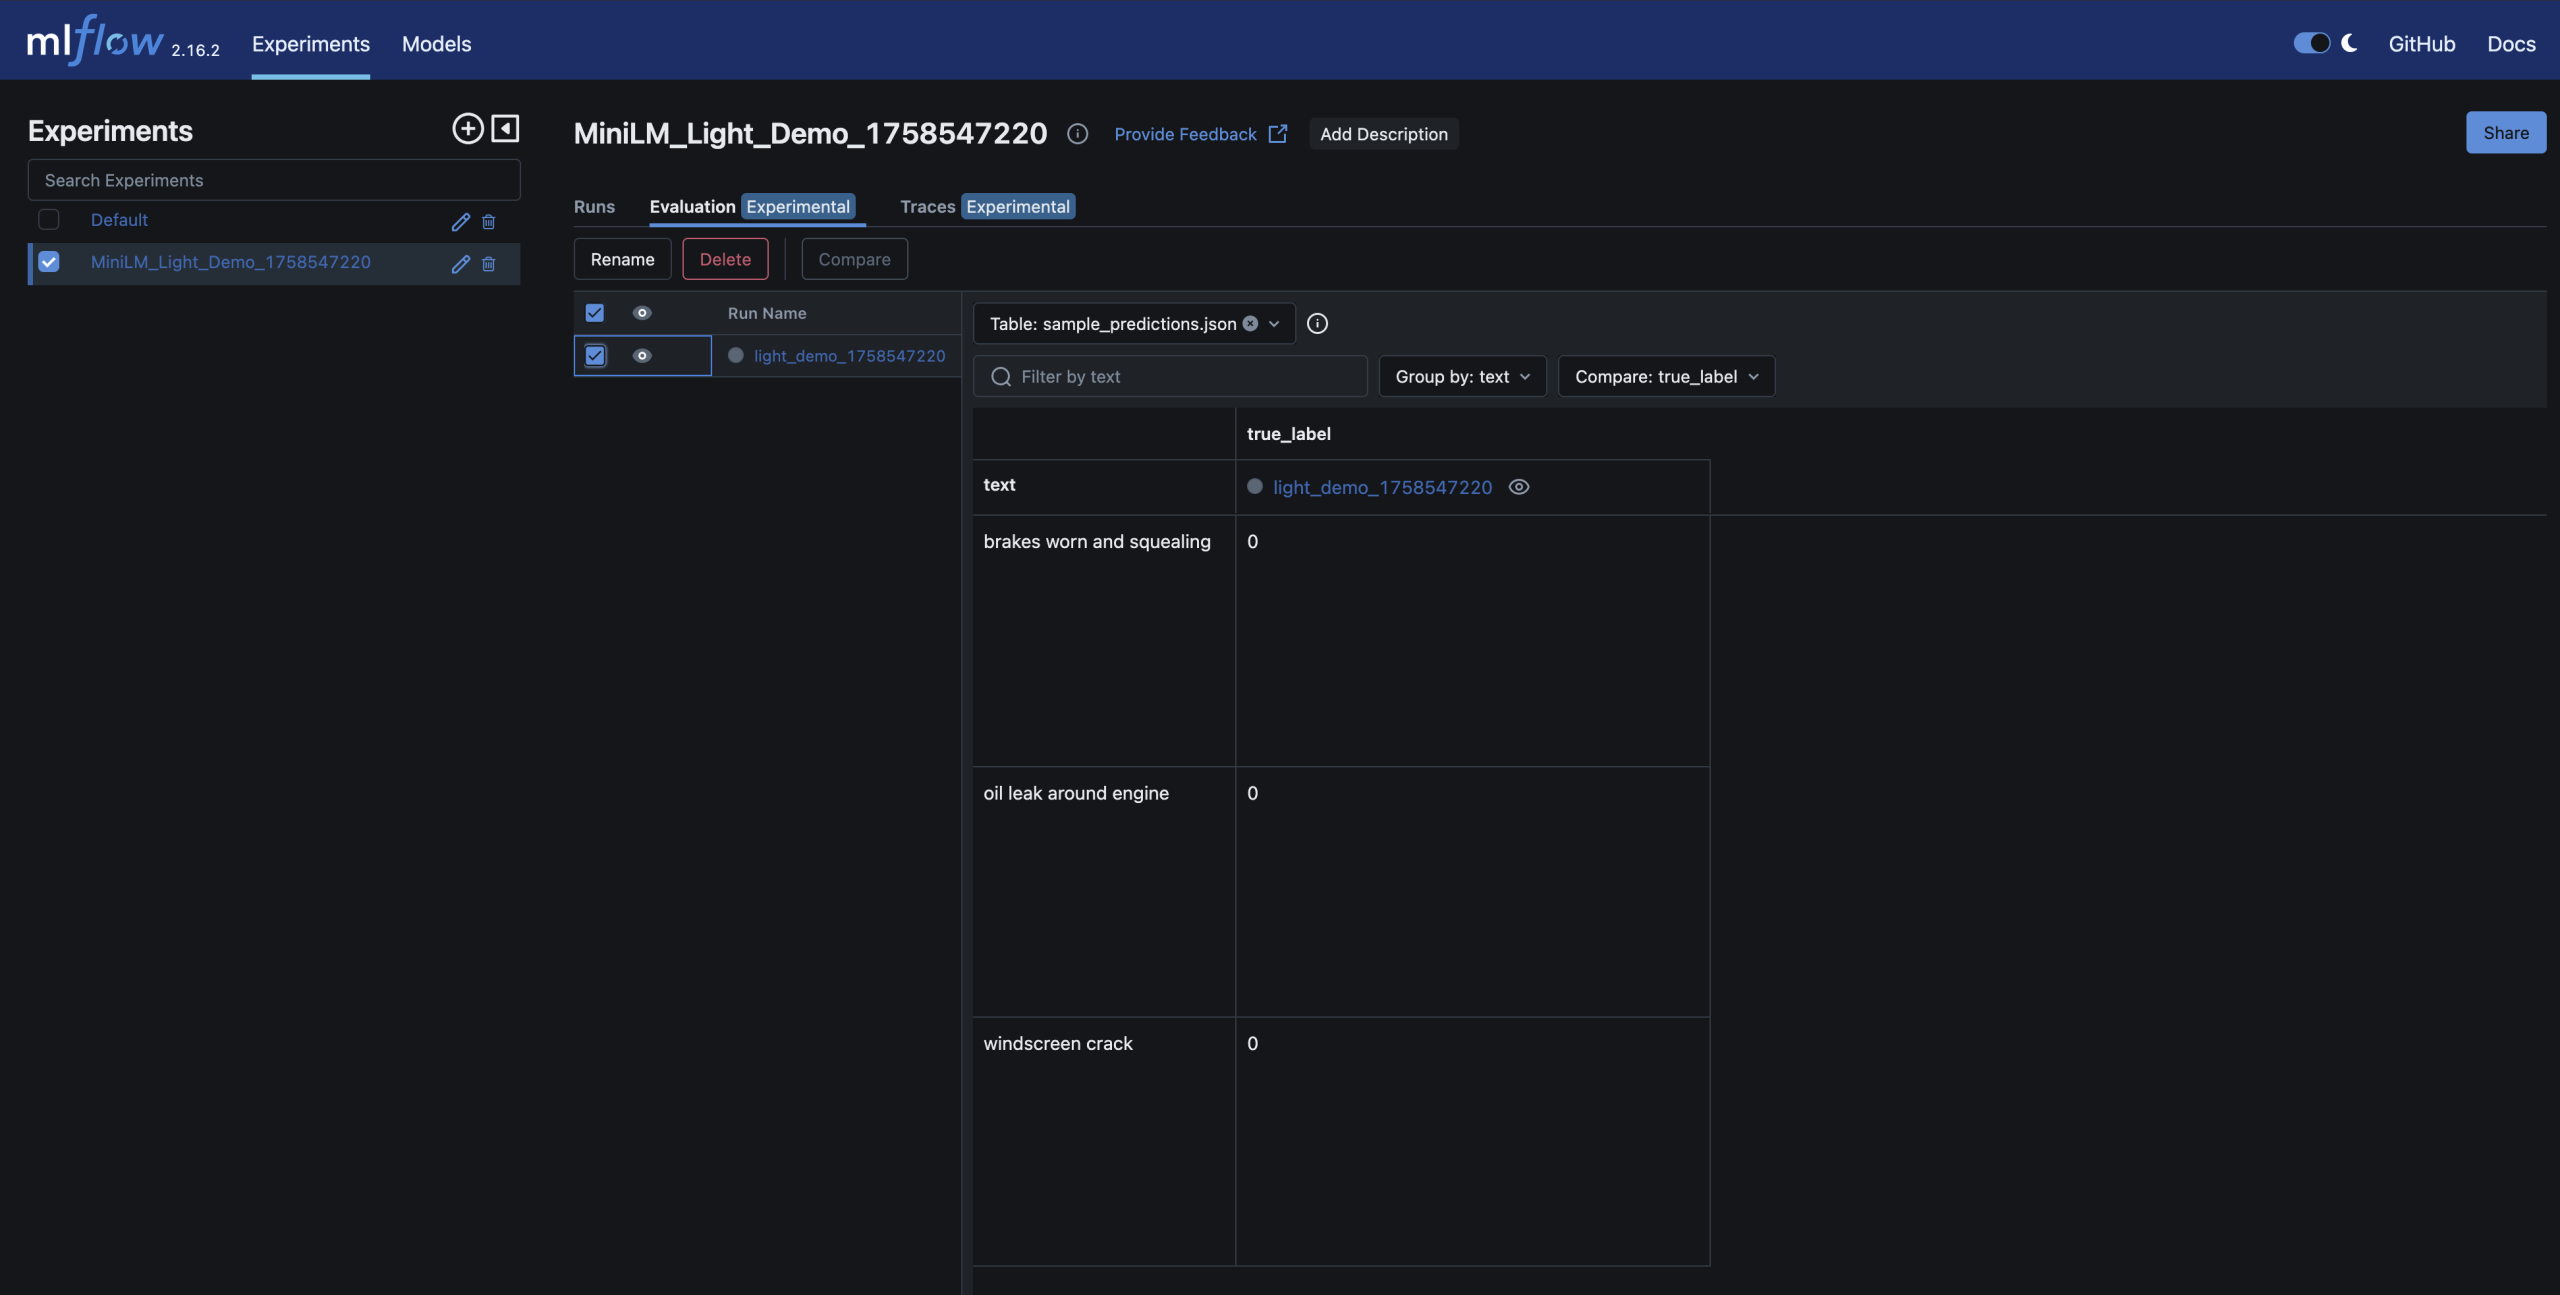
What the demo shows
– MiniLM embeddings turn short MOT-style notes (e.g. “brakes worn”) into vectors
– A Logistic Regression classifier predicts pass/fail
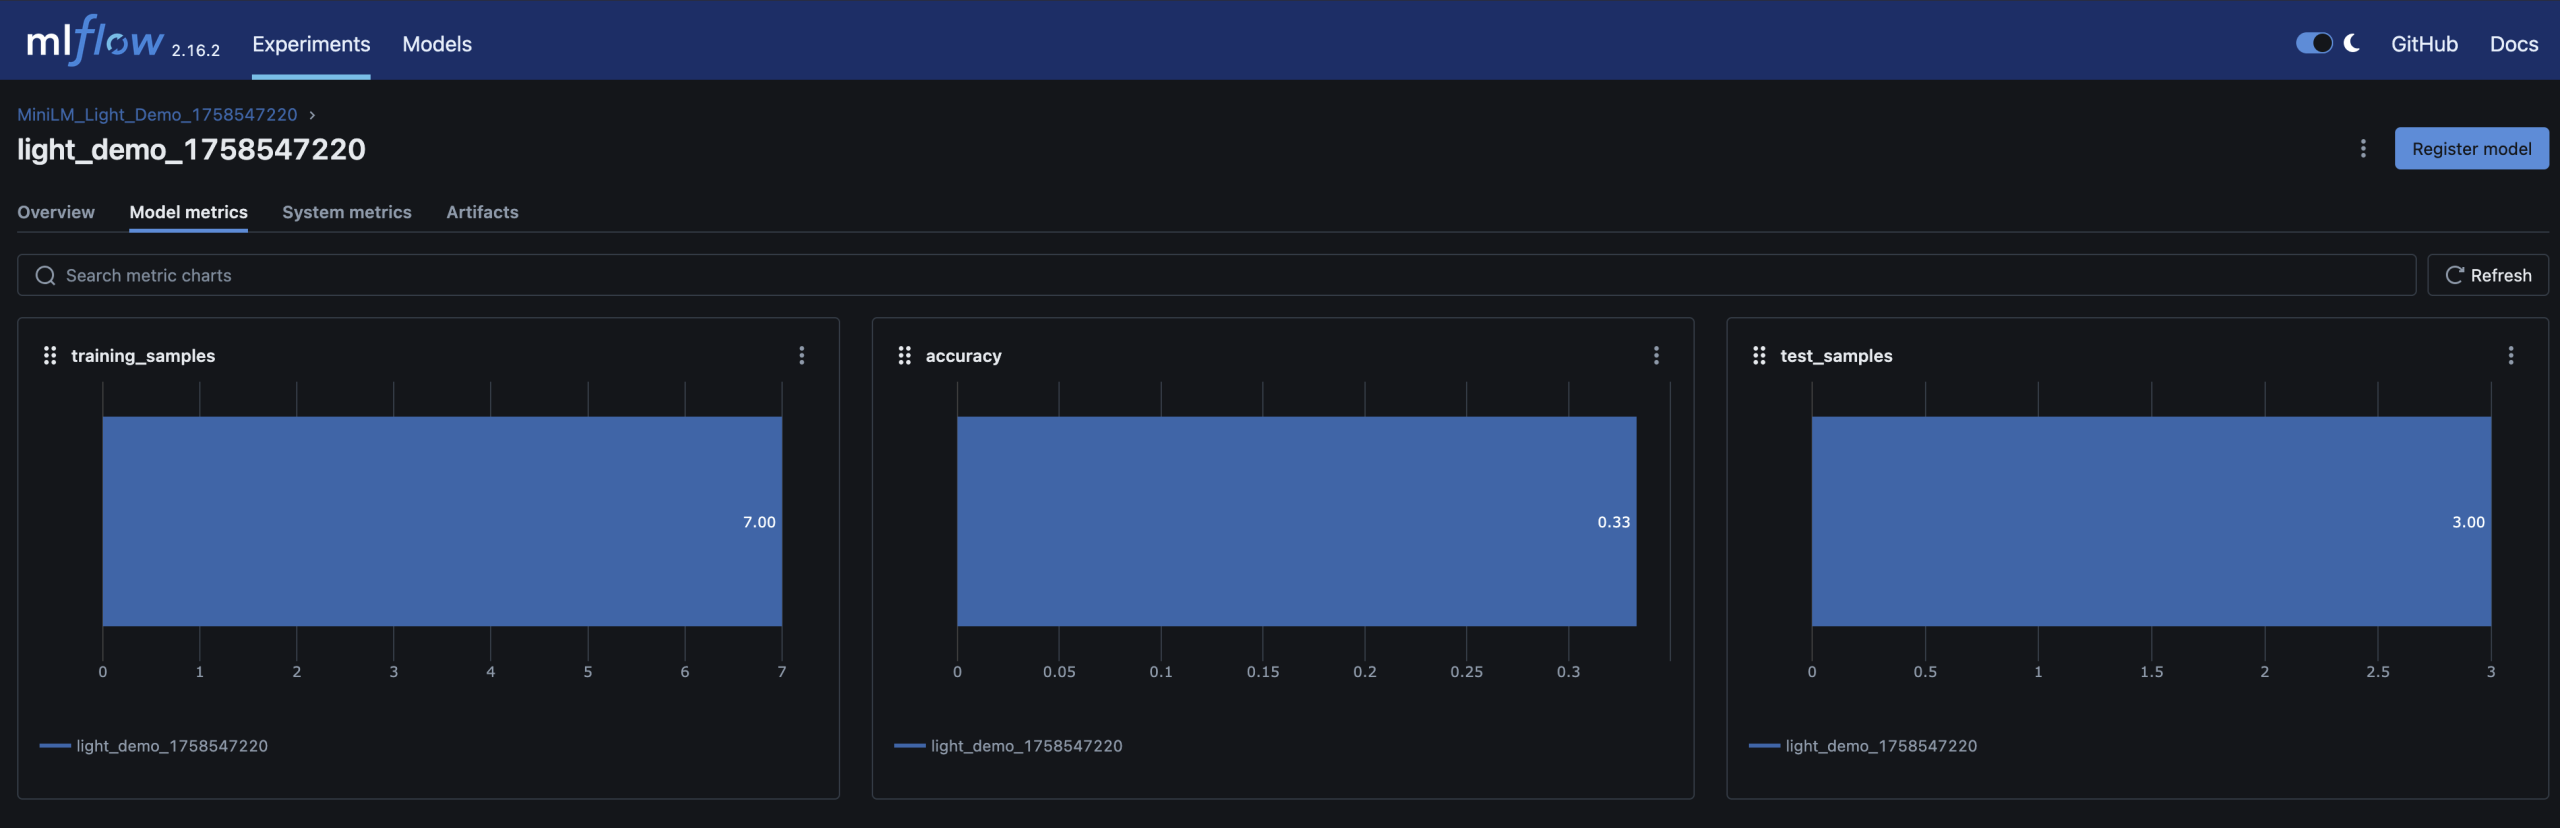
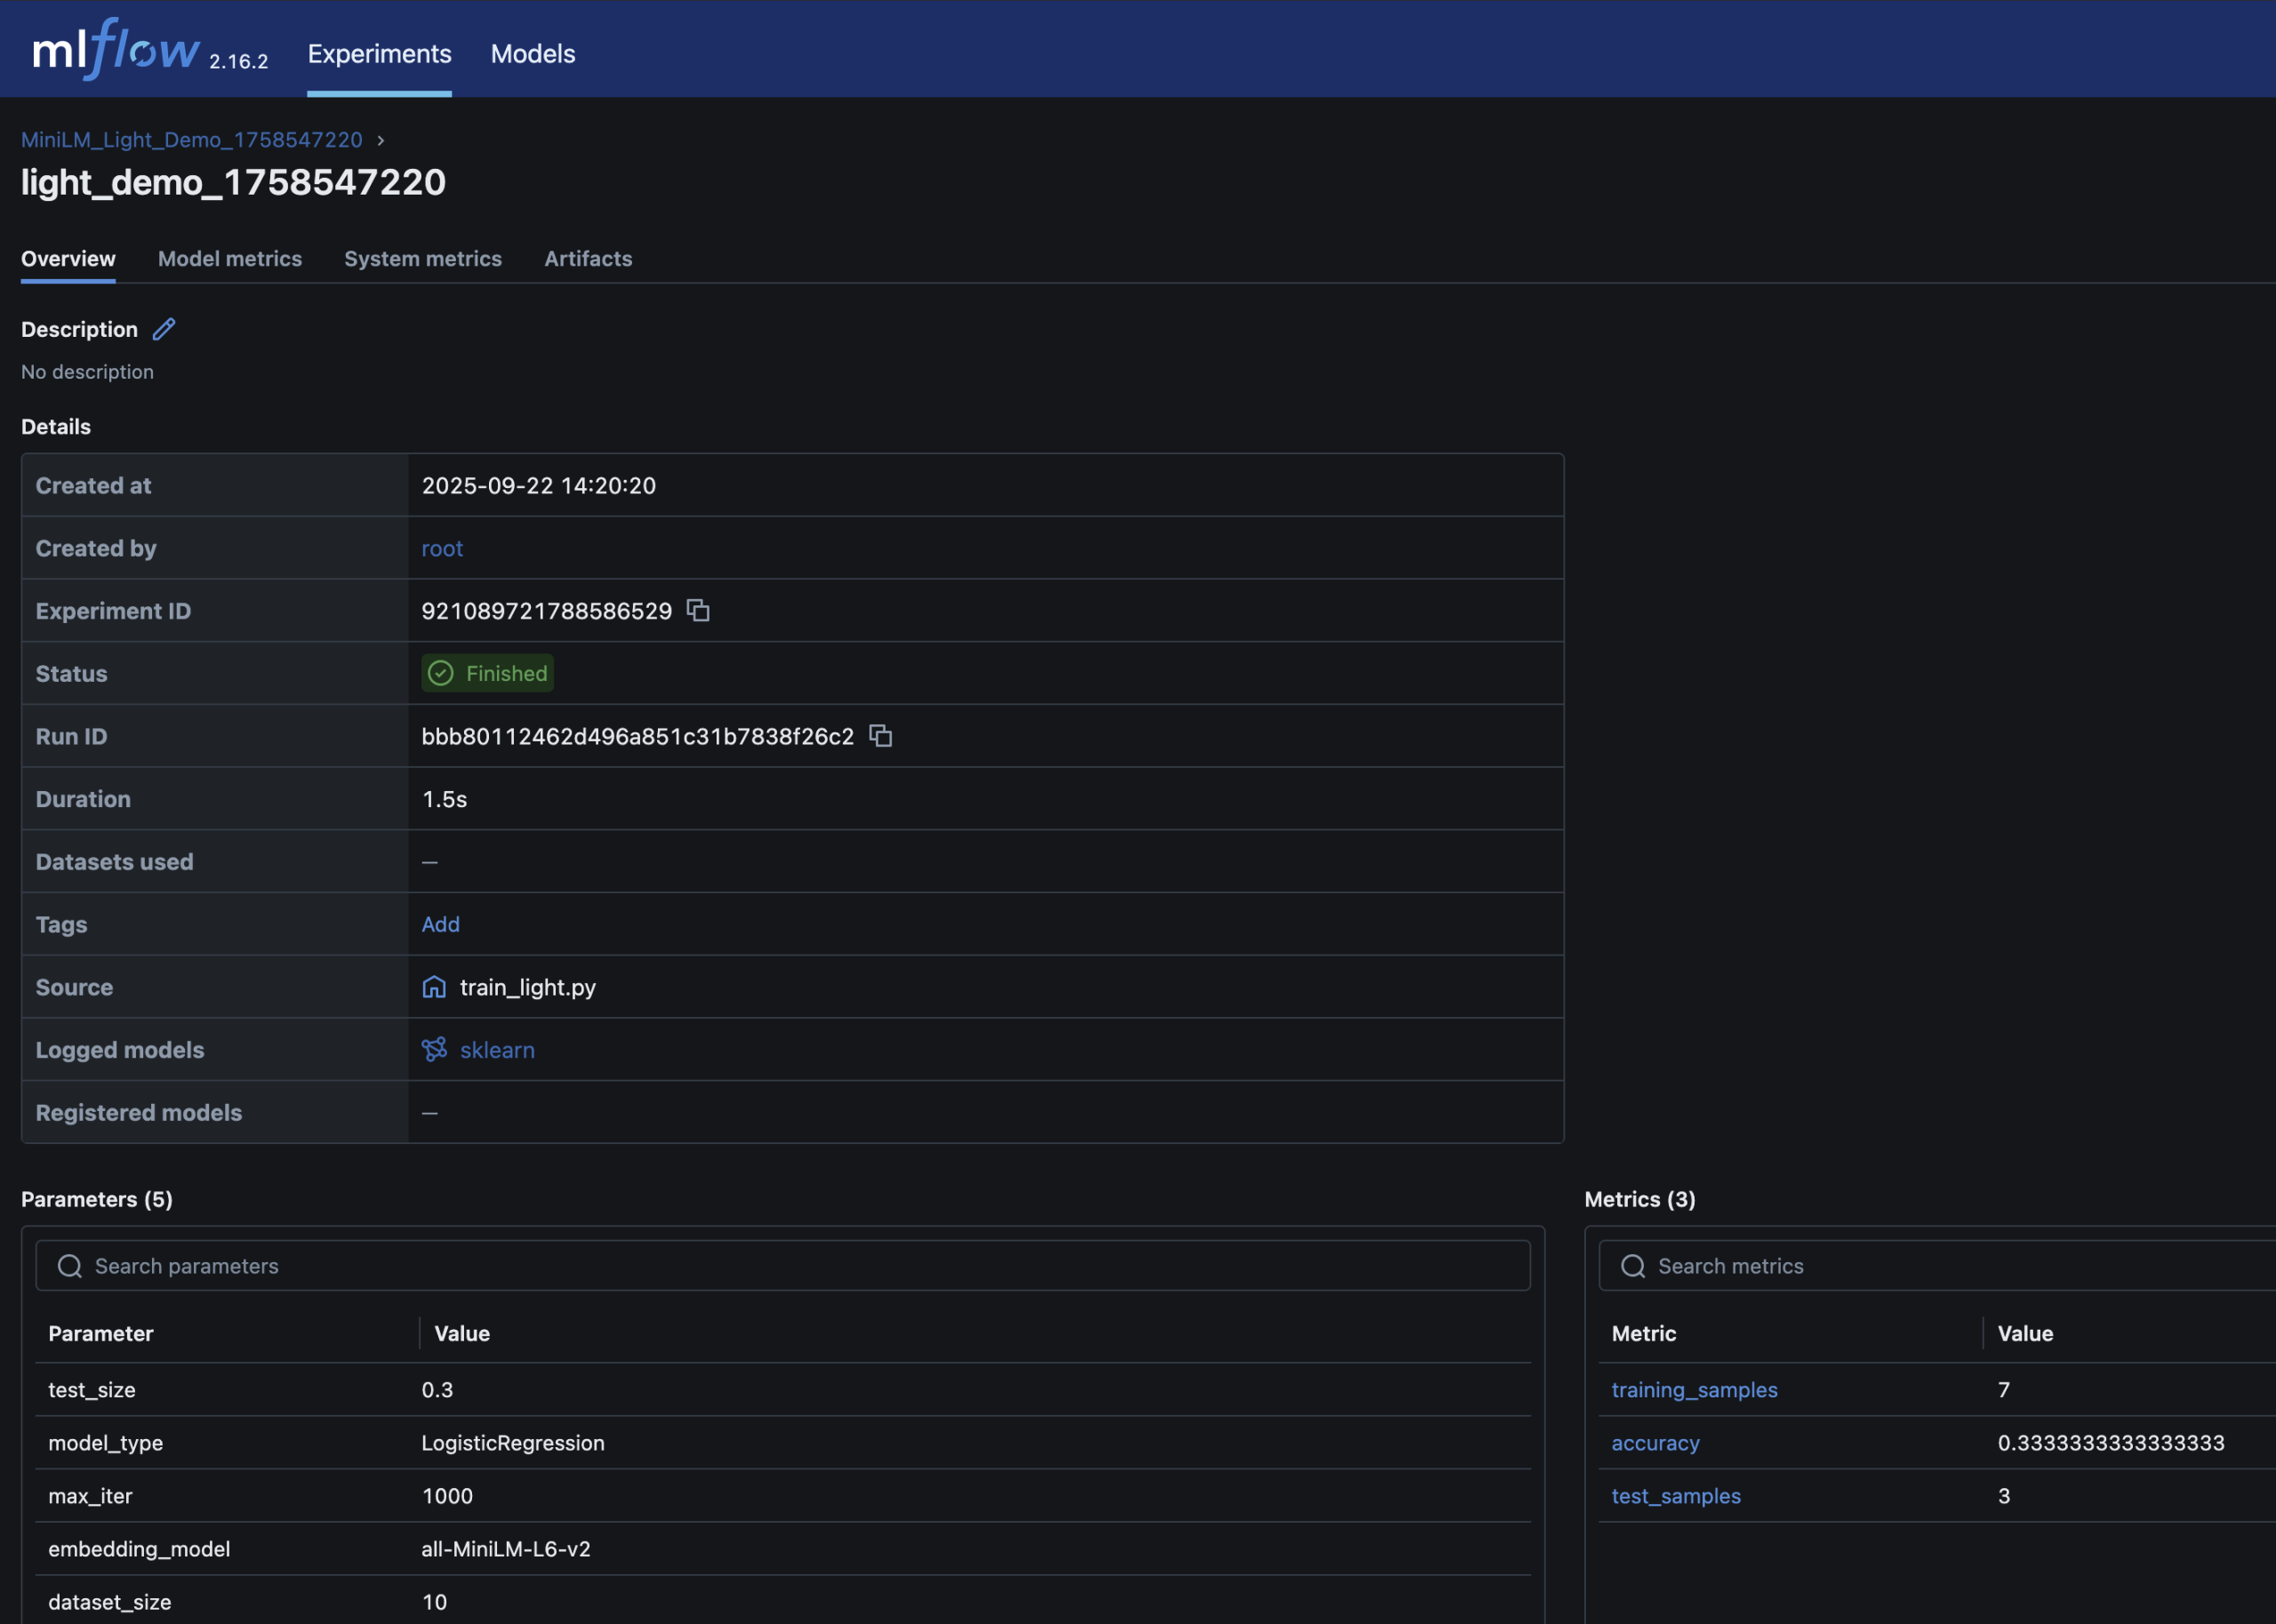
– Parameters, metrics (accuracy), and the trained model are logged in MLflow
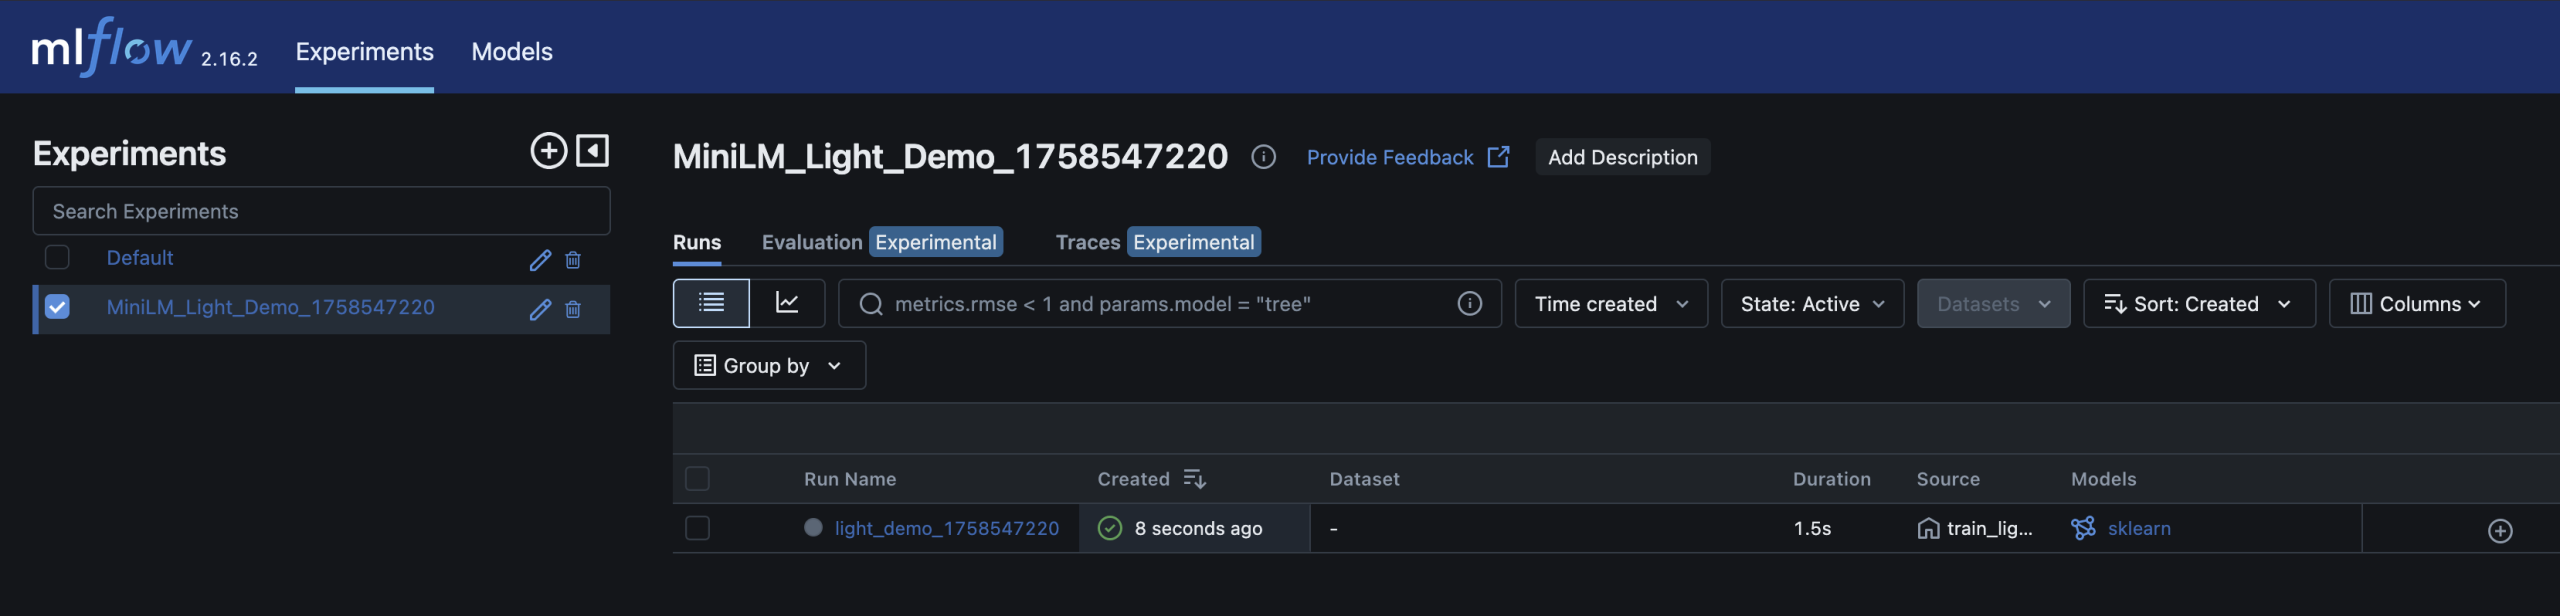
– You can inspect and compare runs in the MLflow UI – just like you’d review builds and artifacts in CI/CD
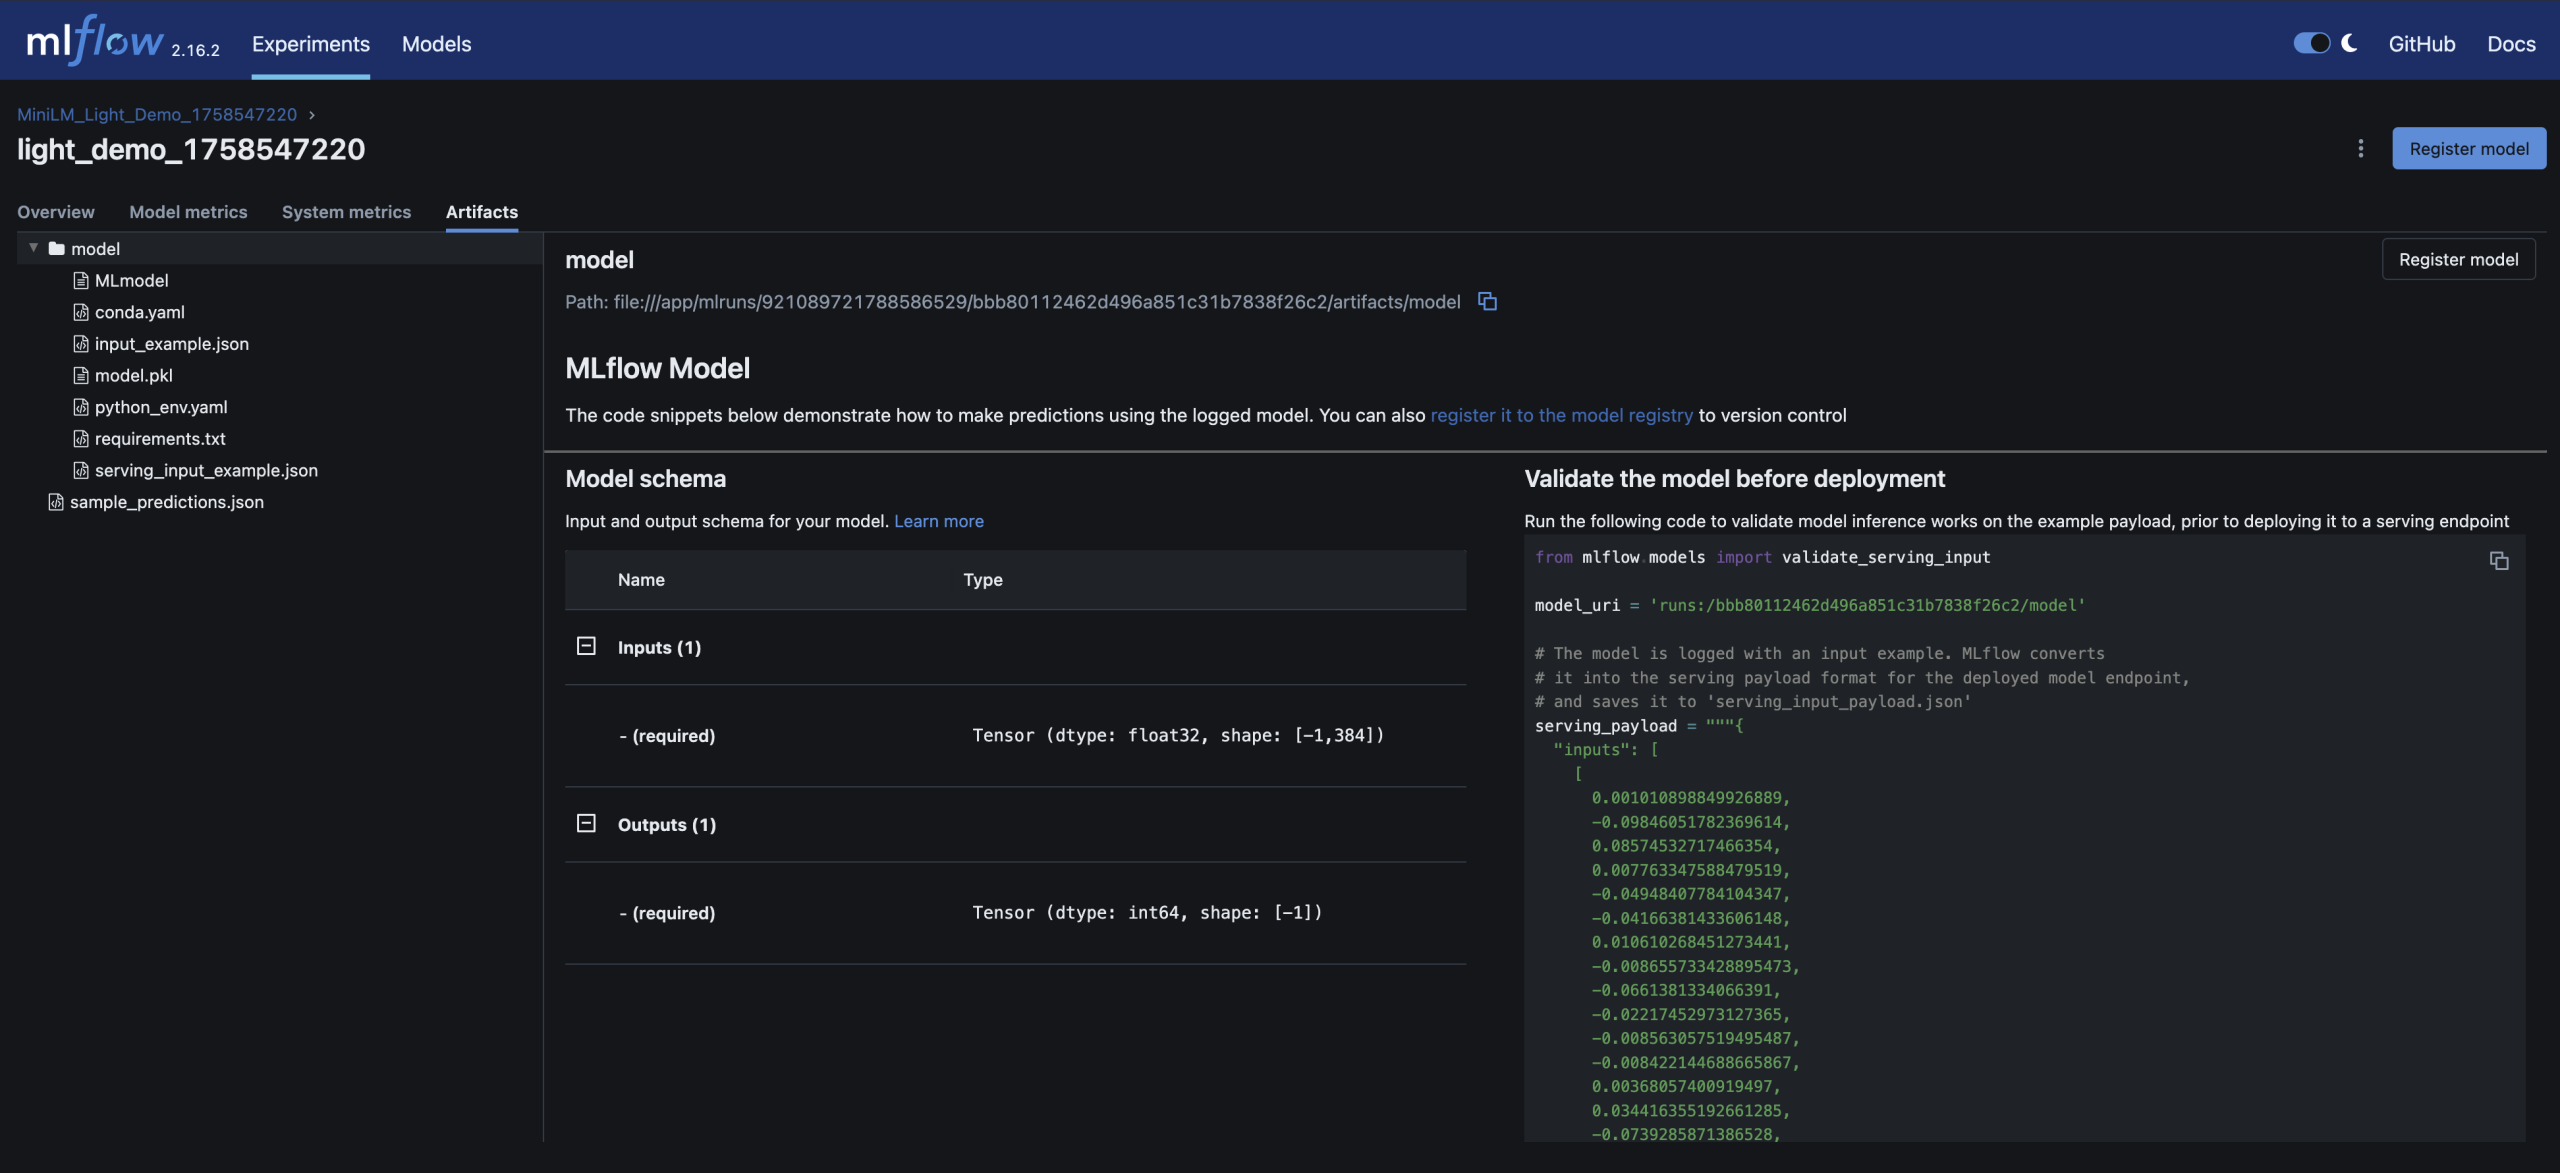
– Run detail; accuracy metrics and model artifact stored alongside parameters
Here are screenshots of the relevant areas from the MLFlow UI:
Why this matters for DevOps engineers
Familiar workflows: MLflow feels like Jenkins/GitHub Actions for models – every run is logged, reproducible, and auditable
Quality gates: just as builds pass/fail CI, models can be gated by accuracy thresholds before promotion
Reproducibility: datasets, parameters and artifacts are versioned and tied to each run
Scalability: the same demo pattern can scale to real workloads – this is a scaled down version of my local process
Other ways to run it
If you prefer, the repo includes alternatives:
Python venv: create a virtualenv, install requirements.txt, run train_light.py
Docker Compose: build and run services with docker-compose up --build
Make targets:make train_light (quick run) or make train (full run)
These are useful if you want to dig a little deeper and see exactly what’s happening
Next steps
Once you’re comfortable with this small demo, natural extensions are:
– Swap in a real dataset (e.g. DVLA MOT data)
– Add data validation gates (e.g. Great Expectations)
– Introduce bias/fairness checks with tools like Fairlearn
– Run the pipeline in Kubernetes (KinD/Argo) for reproducibility
– Hook it into GitHub Actions for end-to-end CI/CD
Closing thoughts
DevOps and MLOps share the same DNA: versioning, automation, observability, reproducibility. This demo repo is a small but practical bridge between the two
Working on CarHunch gave me the chance to apply these ideas in a real platform. This demo distills those lessons into something any DevOps engineer can try locally.
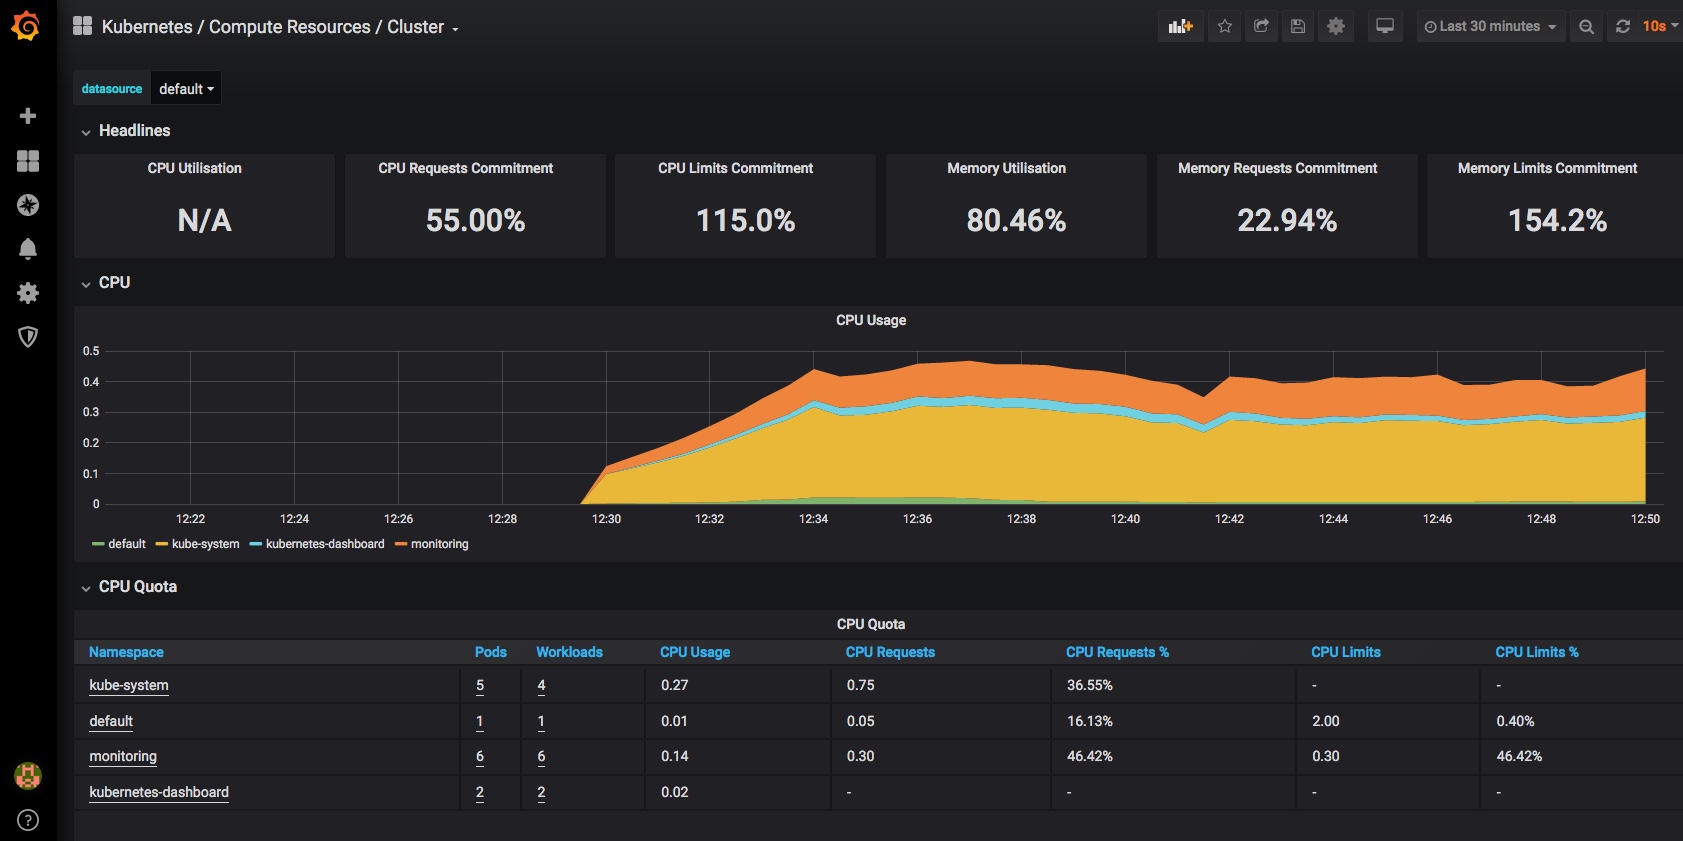
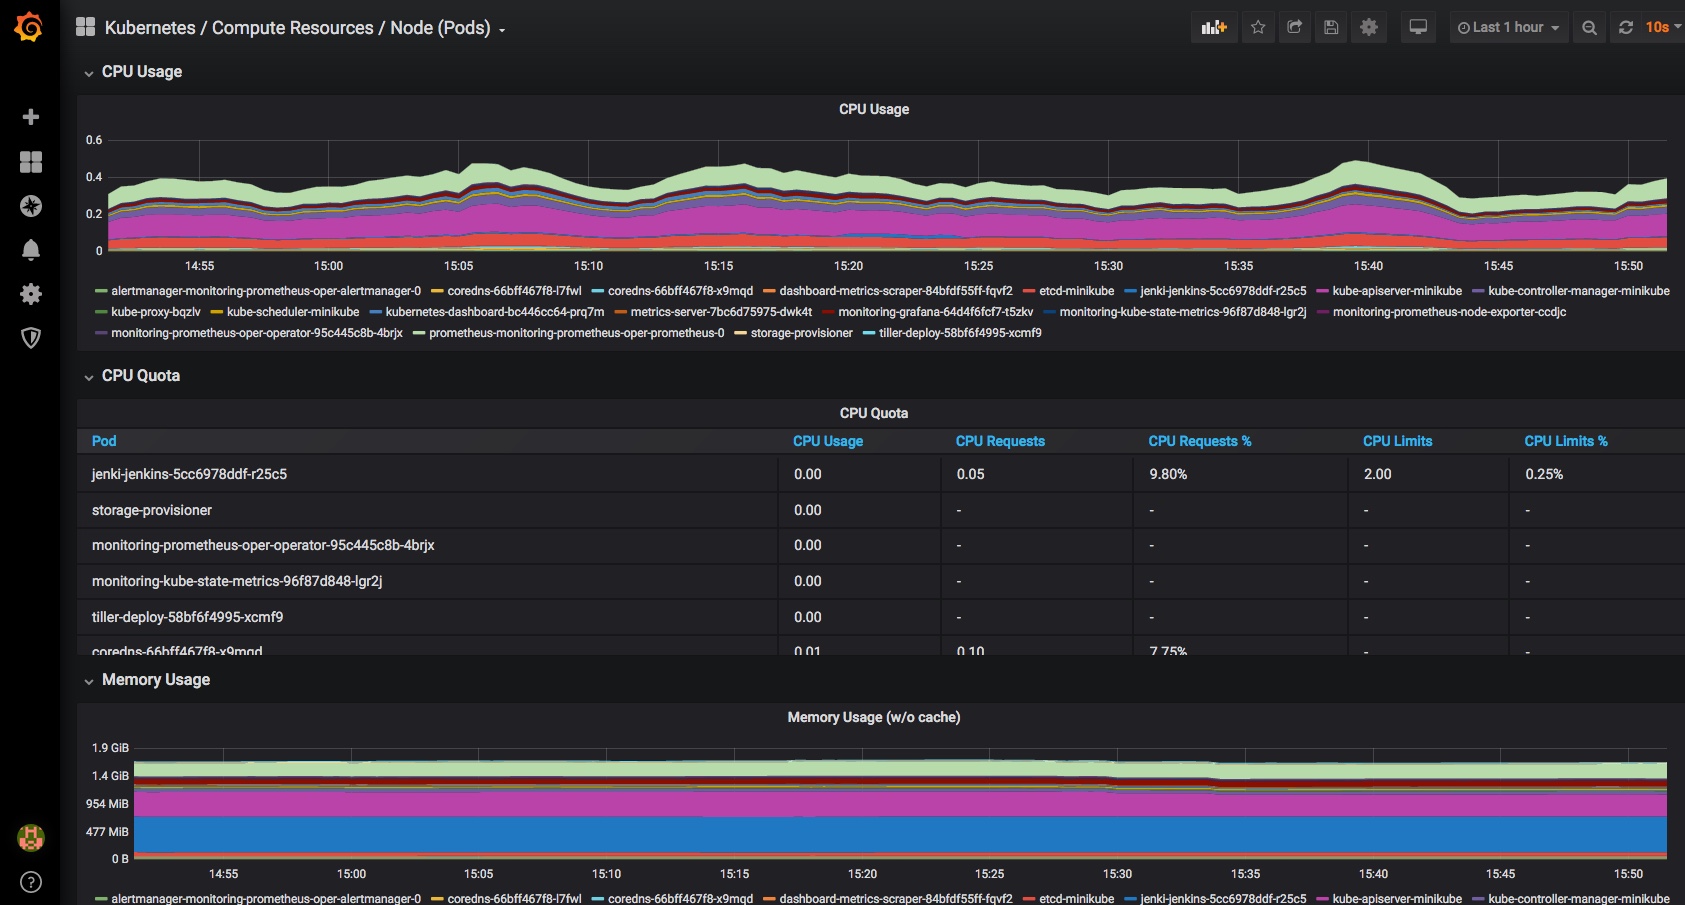
This post takes a look at setting up monitoring and alerting in Kubernetes, using Helm and Kubernetes Operators to deploy and configure Prometheus and Grafana.
This platform is quickly and easily deployed to the cluster using a Helm Chart, which in turn uses a Kubernetes Operator, to setup all of the required resources in an existing Kubernetes Cluster.
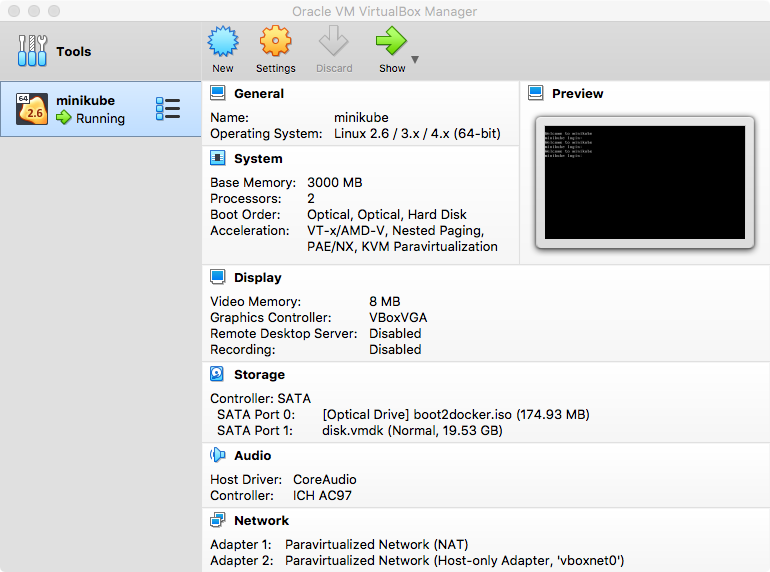
I’m re-using the Minikube Kubernetes cluster with Helm that was built and described in previous posts here and here, but the same steps should work for any working Kubernetes & Helm setup.
An example Grafana Dashboard for Kubernetes monitoring is then imported and we take a quick look at monitoring of Cluster components with other dashboards
It may sound like Helm and Operators do much the same thing, but they are different and complimentary
Helm and Operators are complementary technologies. Helm is geared towards performing day-1 operations of templatization and deployment of Kubernetes YAMLs — in this case Operator deployment. Operator is geared towards handling day-2 operations of managing application workloads on Kubernetes.
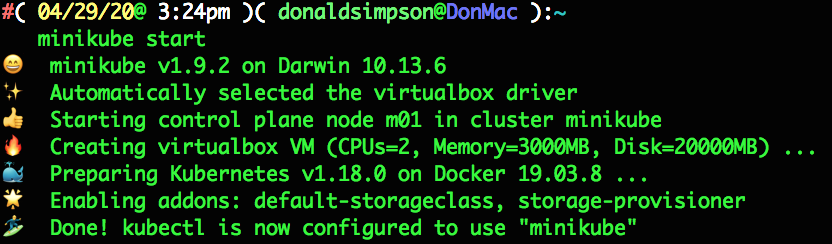
I’m reusing the Minikube cluster from previous posts, so start it back up with:
minikube start
which outputs the following in the console
🎉 minikube 1.10.1 is available! Download it: https://github.com/kubernetes/minikube/releases/tag/v1.10.1 💡 To disable this notice, run: ‘minikube config set WantUpdateNotification false’
🙄 minikube v1.9.2 on Darwin 10.13.6 ✨ Using the virtualbox driver based on existing profile 👍 Starting control plane node m01 in cluster minikube 🔄 Restarting existing virtualbox VM for “minikube” … 🐳 Preparing Kubernetes v1.18.0 on Docker 19.03.8 … 🌟 Enabling addons: dashboard, default-storageclass, helm-tiller, metrics-server, storage-provisioner 🏄 Done! kubectl is now configured to use “minikube”
this all looks ok, and includes the minikube addons I’d selected previously. Now a quick check to make sure my local helm repo is up to date:
helm repo update
I then used this command to find the latest version of the stable prometheus-operator via a helm search: helm search stable/prometheus-operator --versions | head -2
there’s no doubt a neater/builtin way to find out the latest version, but this did the job – I’m going to install 8.13.8:
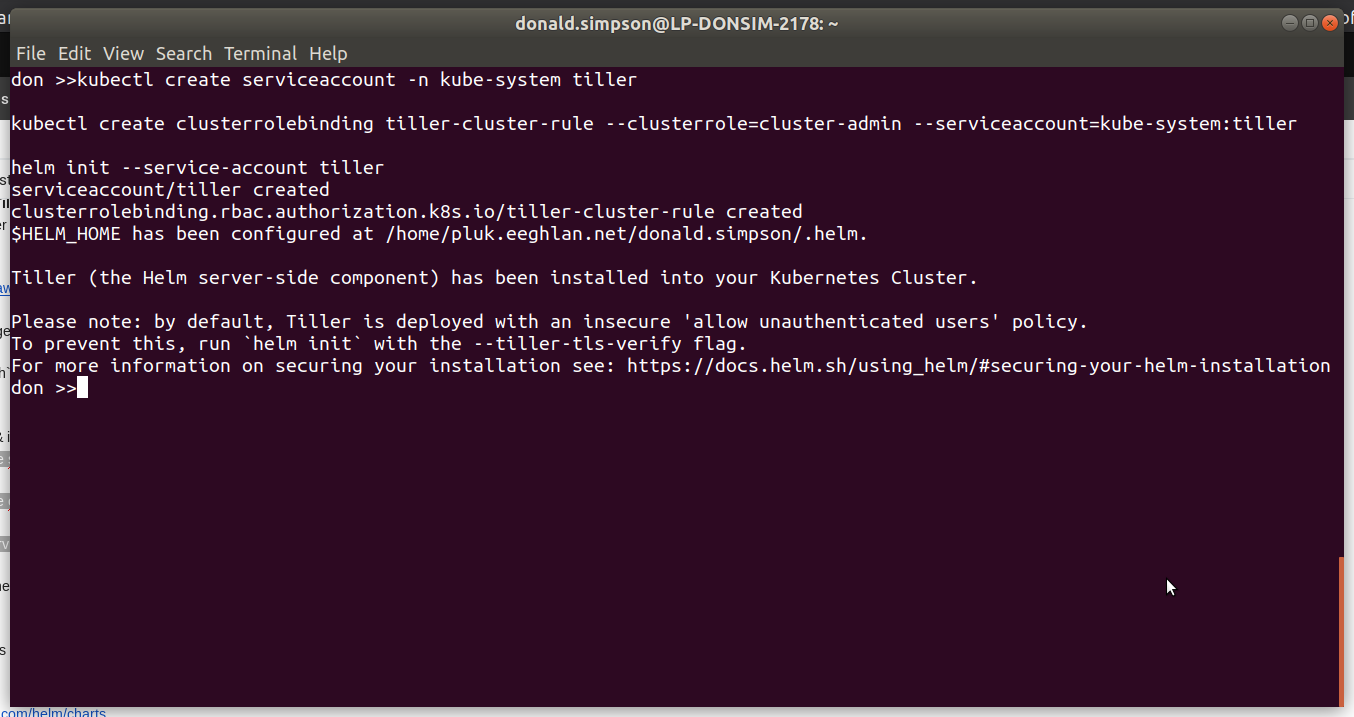
install the prometheus operator using Helm, in to a new dedicated “monitoring” namespace just takes this one command: helm install stable/prometheus-operator --version=8.13.8 --name=monitoring --namespace=monitoring
Ooops
that should normally be it, but for me, this resulted in some issues along these lines:
Error: Get http://localhost:8080/version?timeout=32s: dial tcp 127.0.0.1:8080: connect: connection refused
– looks like Helm can’t communicate with Tiller any more; I confirmed this with a simple helm ls which also failed with the same message. This shouldn’t be a problem when v3 of Helm goes “tillerless”, but to fix this quickly I simply re-enabled Tiller in my cluster via Minikube Addons:
verified things worked again with helm ls, then the helm install... command worked and started to do its thing…
New Operator and Namespace
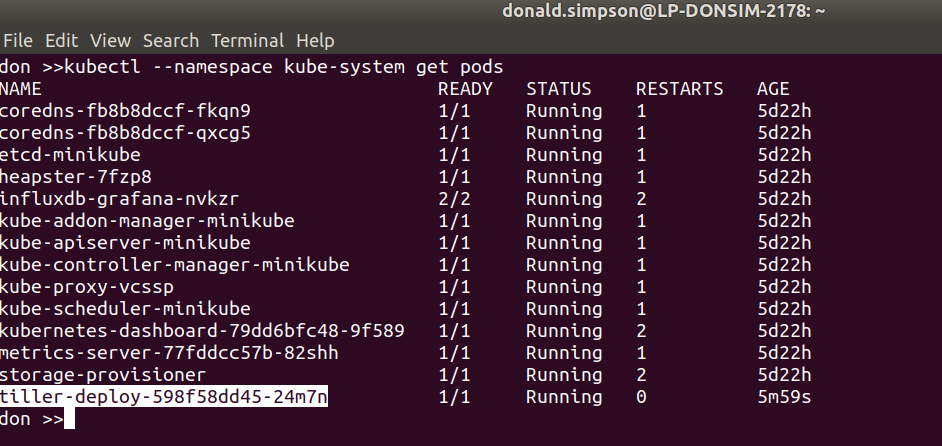
Keeping an eye on progress in my k8s dashboard, I can see the new “monitoring” namespace has been created, and the various Operator components are being downloaded, started up and configured:
you can also keep an eye on progress with: watch -d kubectl get po --namespace=monitoring
this takes a while on my machine, but eventually completes with this console output:
NOTES: The Prometheus Operator has been installed. Check its status by running: kubectl –namespace monitoring get pods -l “release=monitoring”
Visit https://github.com/coreos/prometheus-operator for instructions on how to create & configure Alertmanager and Prometheus instances using the Operator.
kubectl get po --namespace=monitoring shows the pods now running in the cluster, and for this quick example the easiest way to get access to the new Grafana instance is to forward the pods port 3000 to localhost like this:
the default user for this Grafana is “admin” and the password for that user is “prom-operator“, so log in with those credentials…
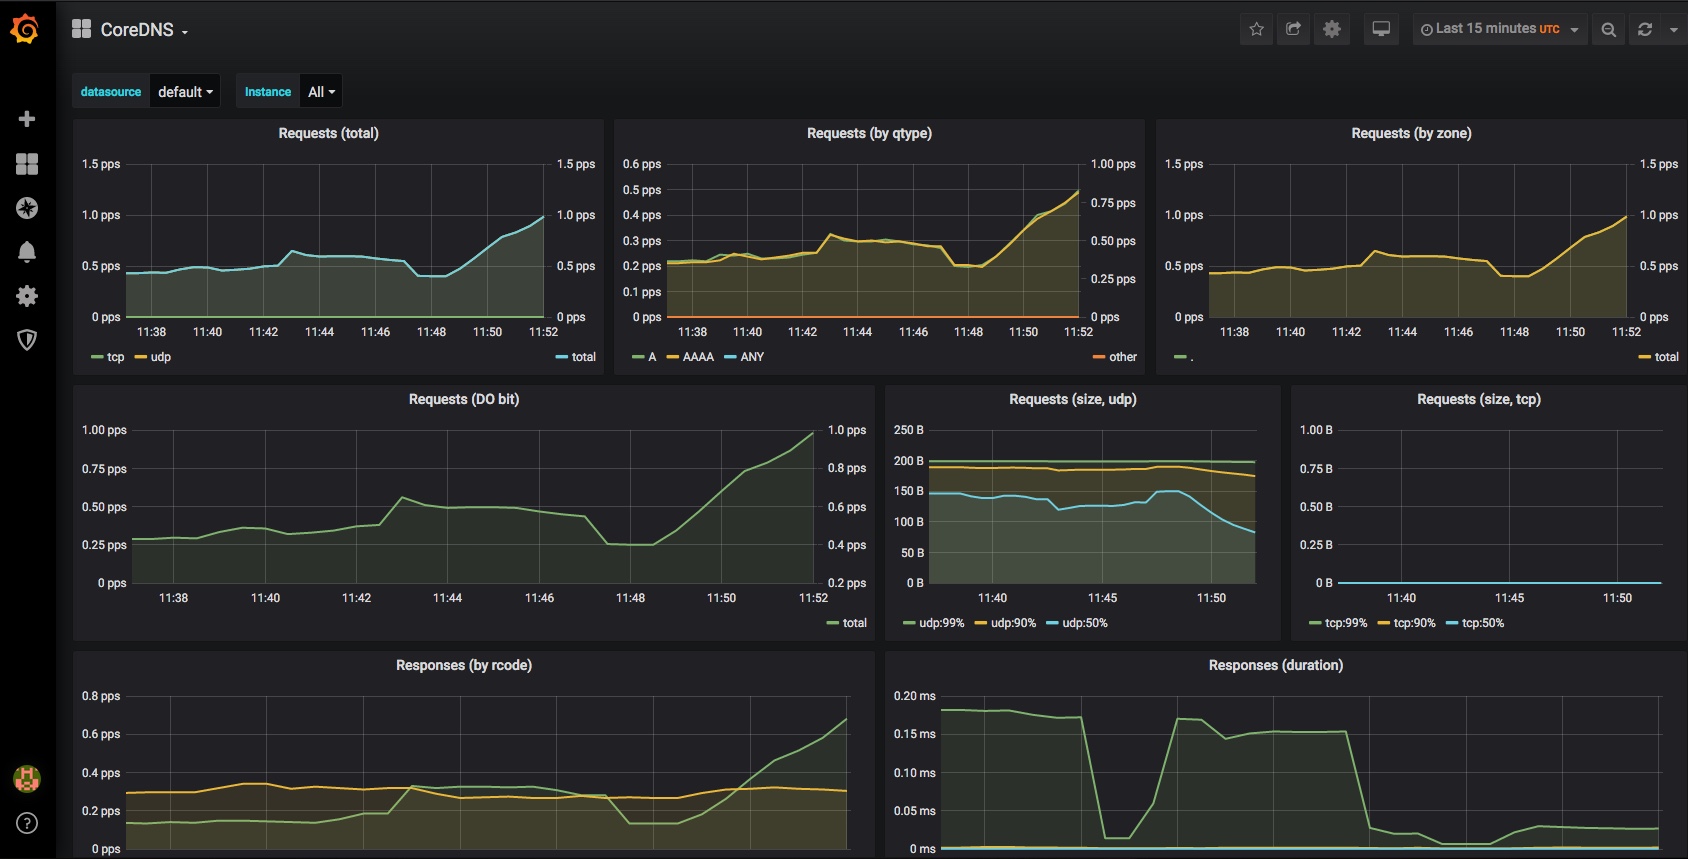
Grafana Dashboards for Kubernetes
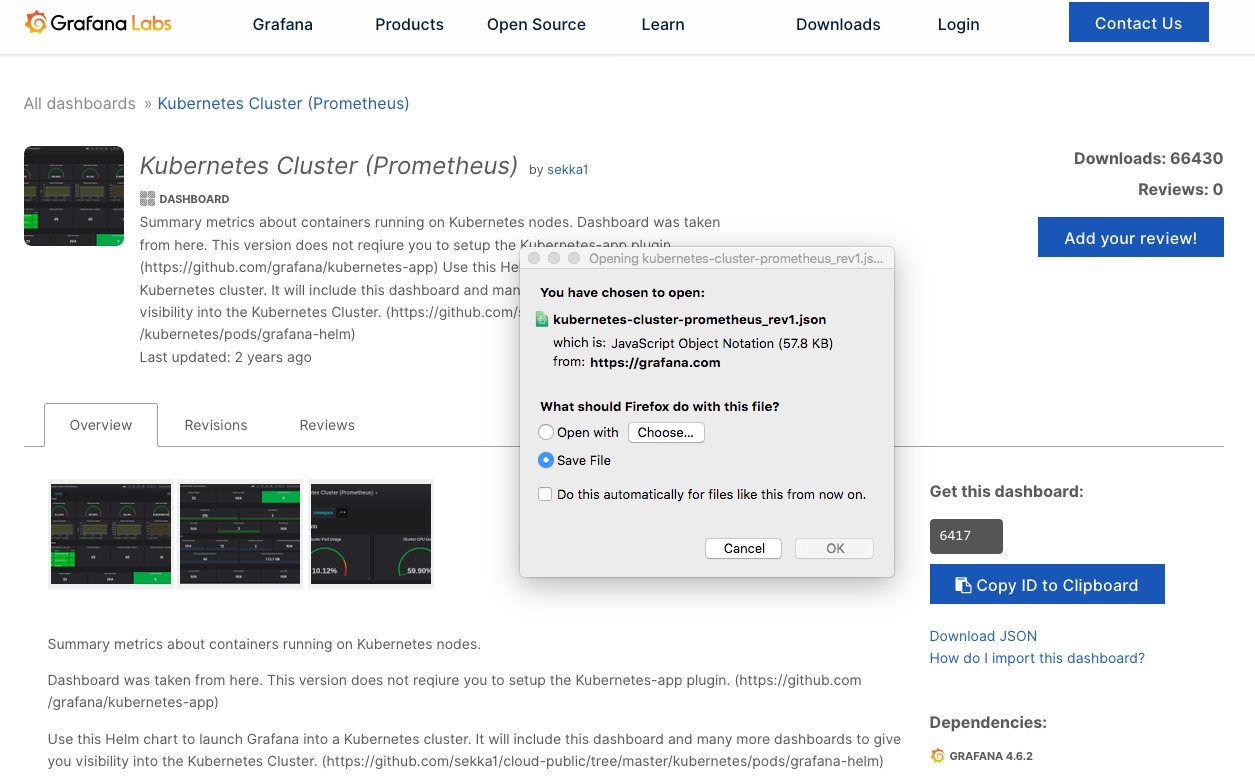
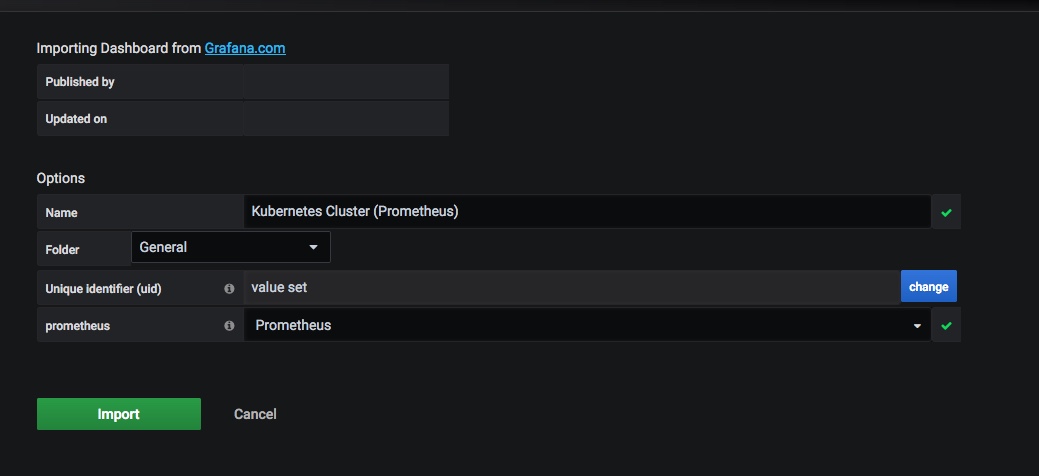
We can now use the ready-made Grafana dashboards, or add/import ones from the extensive online collection, like this one here for example: https://grafana.com/grafana/dashboards/6417 – simply save the JSON file
then go to Grafana and import it with these settings:
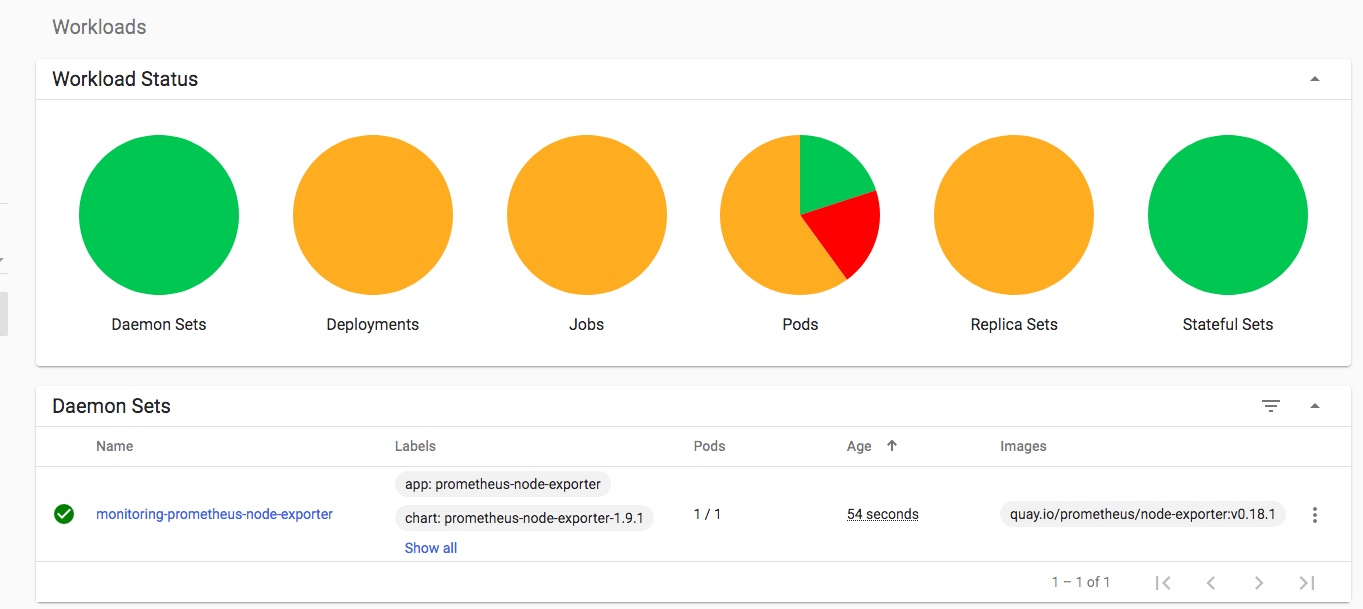
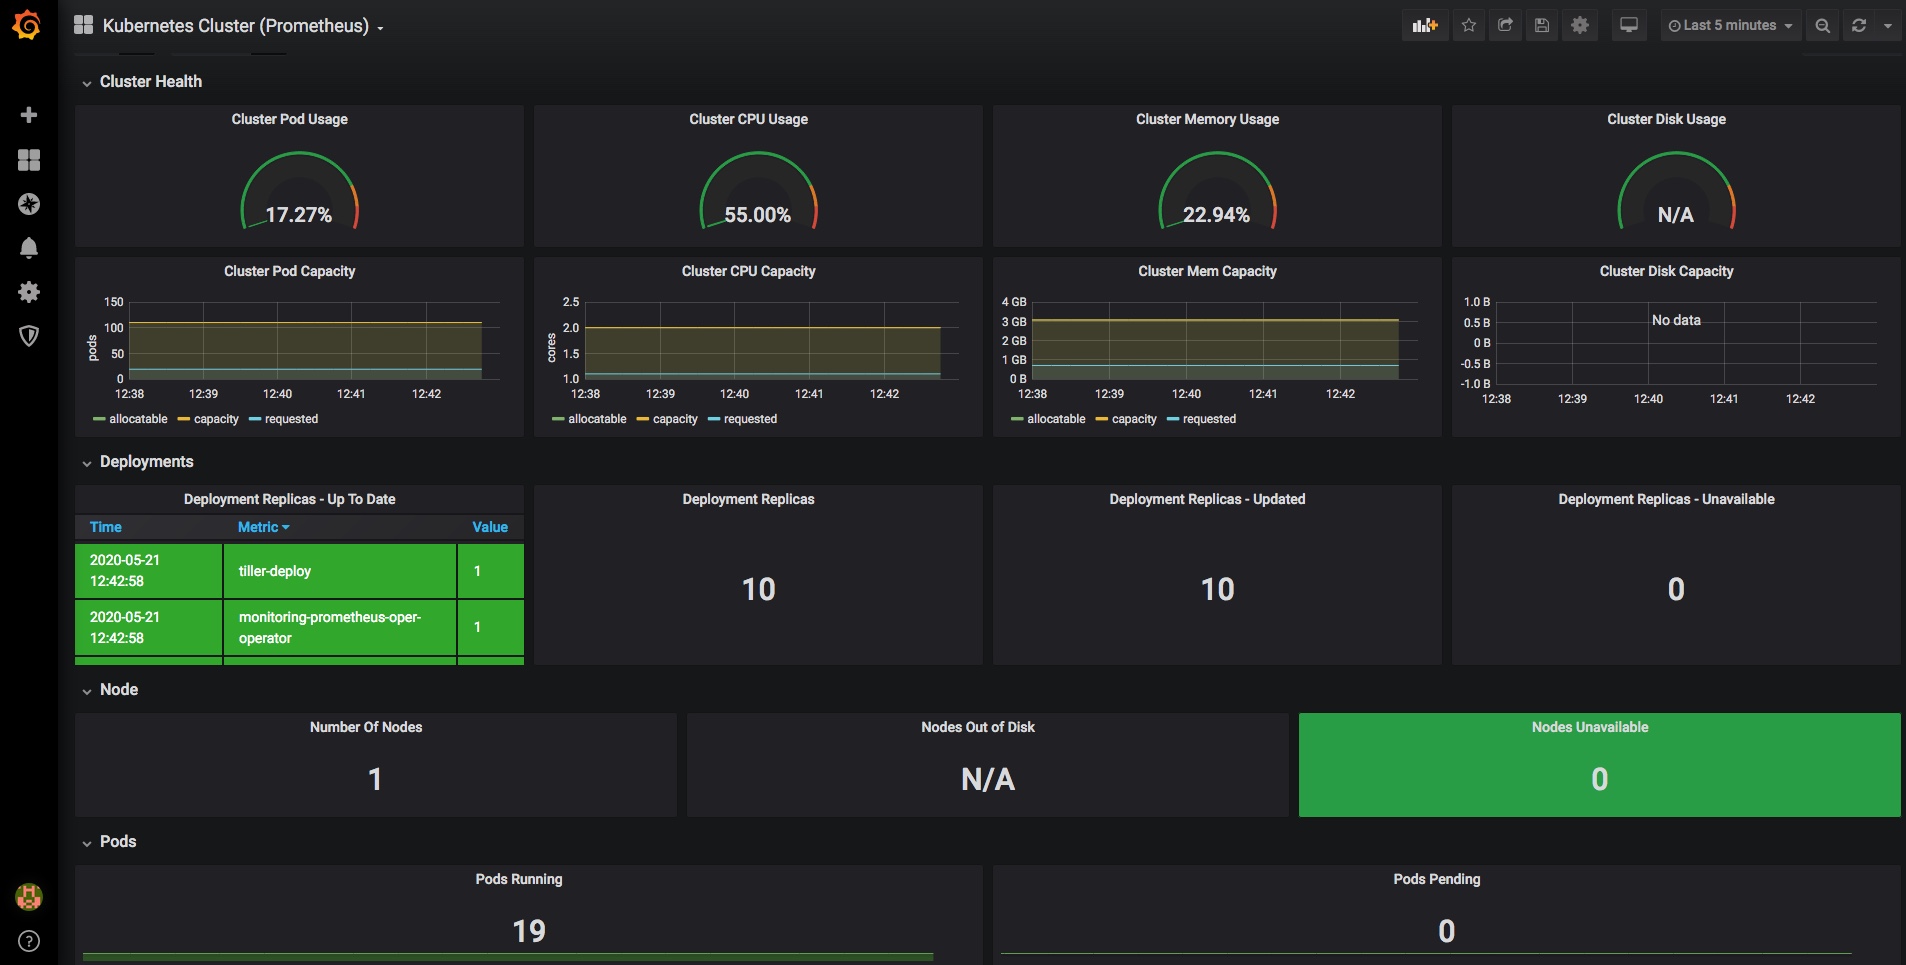
and you should now have a dashboard showing some pretty helpful stats on your kubernetes cluster, it’s health and resource usage:
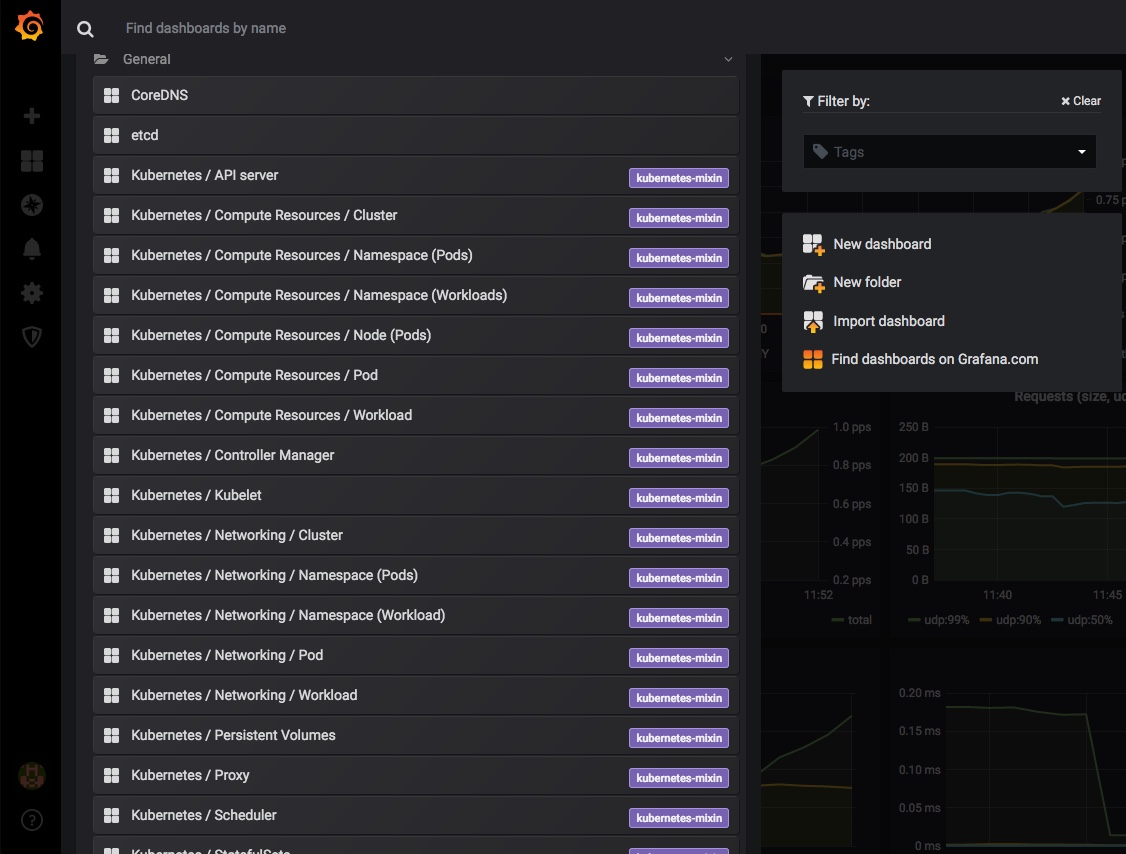
Finally a very quick look at some of the other inbuilt dashboards – you can use and adjust these to monitor all of the components that comprise your cluster and set up alerting when limits or triggers are reached:
All done & next steps
There’s a whole lot more that can be done here, and many other ways to get to this point, but I found this pretty quick and easy.
I’ve only been looking at monitoring of k8s resources here, but you can obviously set up grafana dashboards for many other things, like monitoring your deployed applications. Many applications (and charts and operators) come with prom endpoints built in, and can easily and automatically be added to your monitoring and alerting dashboards along with other datasources.
That post went as far as having a Kubernetes cluster up and running for local development. That was primarily focused on Mac, but once you reach the point of having a running Kubernetes Cluster with kubectl configured to talk to it, the hosting platform/OS makes little difference.
This second section takes a more detailed look at running Jenkins Pipelines inside the Kubernetes Cluster, and automatically provisioning Jenkins JNLP Agents via Kubernetes, then takes an in-depth look at what we can do with all of that, with a complete working example.
This post covers quite a lot:
Adding Helm to the Kubernetes cluster for package management
Deploying Jenkins on Kubernetes with Helm
Connecting to the Jenkins UI
Setting up a first Jenkins Pipeline job
Running our pipeline and taking a look at the results
What Next
Adding Helm to the Kubernetes cluster for package management
Helm is a package manager for Kubernetes, and like Minikube it is ideal for quickly setting up development environments, plus much more if you want to. Take a look through the Helm hub to see just some of the other things it can do.
On Mac you can use brew to install the local helm component:
you should then see a tiller pod start up in your Kubernetes kube-system namespace:
Before you can use Helm we first need to initialise the local Helm client, so simply run:
helm init --client-only
as our earlier minikube addons command has configured the connectivity and cluster already. Before we can use Helm to install Jenkins (or any of the many other things it can do), we need to update the local repo that contains the Helm Charts:
helm repo update
Hang tight while we grab the latest from your chart repositories…
…Skip local chart repository
…Successfully got an update from the "stable" chart repository
Update Complete.
That should be Helm setup complete and ready to use now.
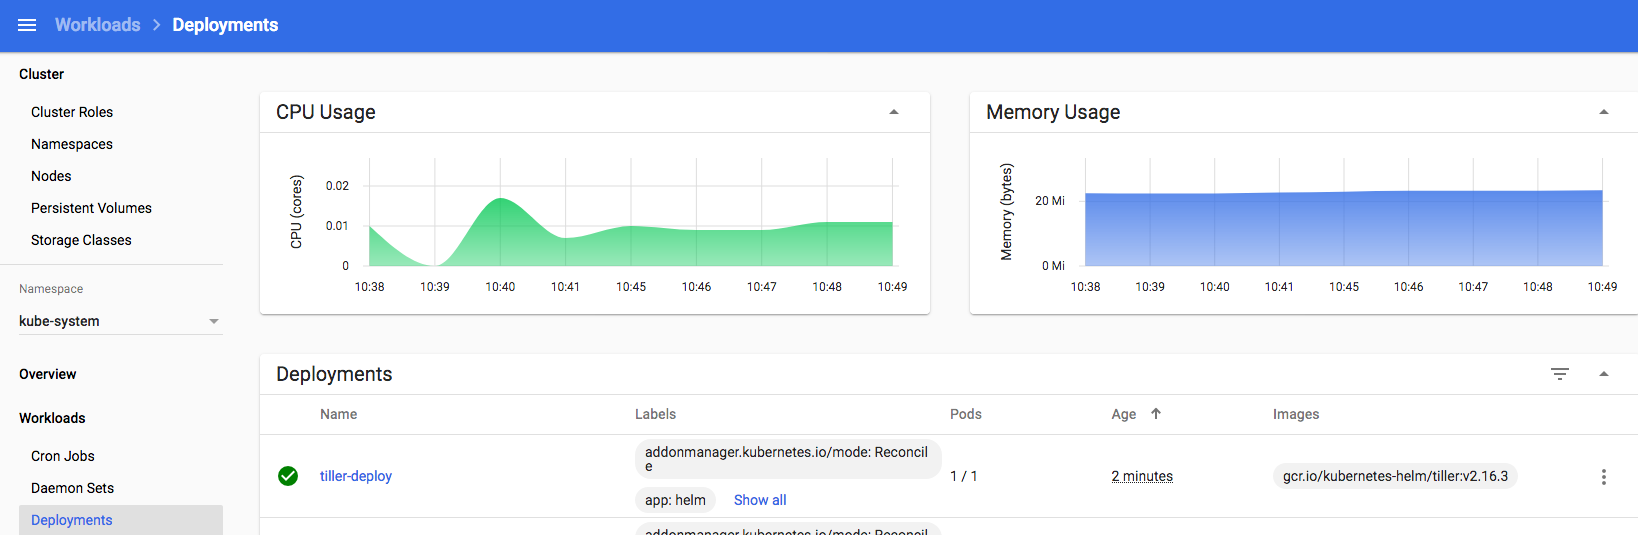
Deploying Jenkins on Kubernetes with Helm
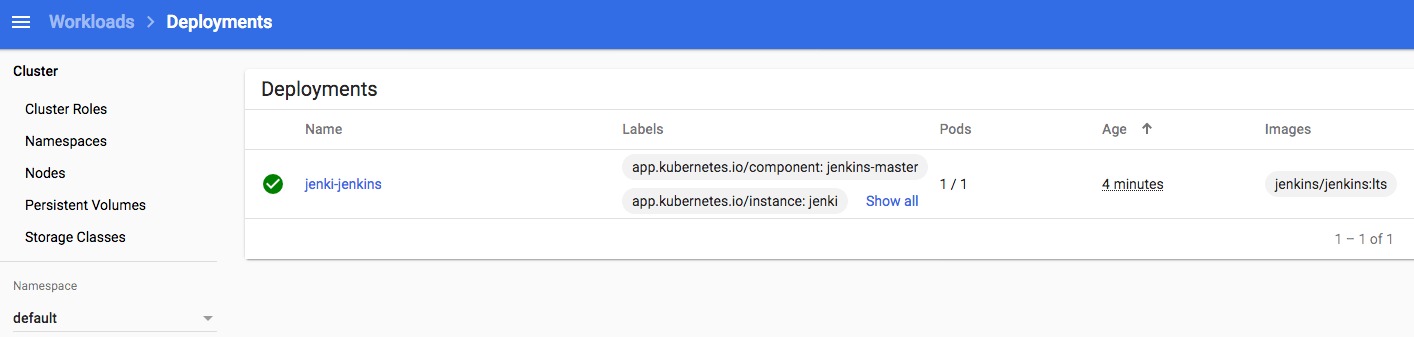
Now that Helm is setup and can speak to our k8s instance, installing 100’s of software packages suddenly becomes very simple – including, Jenkins. We’ll just give the install a friendly name “jenki” and use NodePort to simplify the networking, nothing more is required for this dev setup:
obviously we’re skipping over all the for-real things you may want for a longer lived Jenkins instance, like backups, persistence, resilience, authentication and authorisation etc., but this bare-bones setup is sufficient for now.
Connect to the Jenkins UI
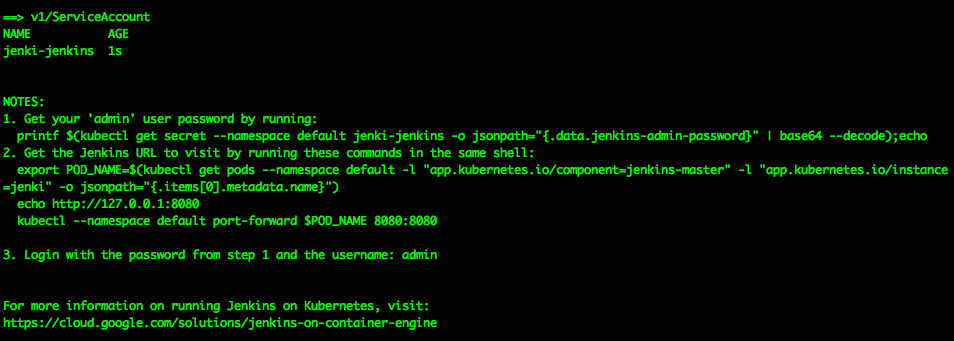
The Helm install should spit out some helpful info like this, explaining how to get the Jenkins Admin password and how to connect to the UI:
Get your ‘admin’ user password by running: printf $(kubectl get secret –namespace default jenki-jenkins -o jsonpath=”{.data.jenkins-admin-password}” | base64 –decode);echo
Get the Jenkins URL to visit by running these commands in the same shell: export POD_NAME=$(kubectl get pods –namespace default -l “app.kubernetes.io/component=jenkins-master” -l “app.kubernetes.io/instance=jenki” -o jsonpath=”{.items[0].metadata.name}”) echo http://127.0.0.1:8080 kubectl –namespace default port-forward $POD_NAME 8080:8080
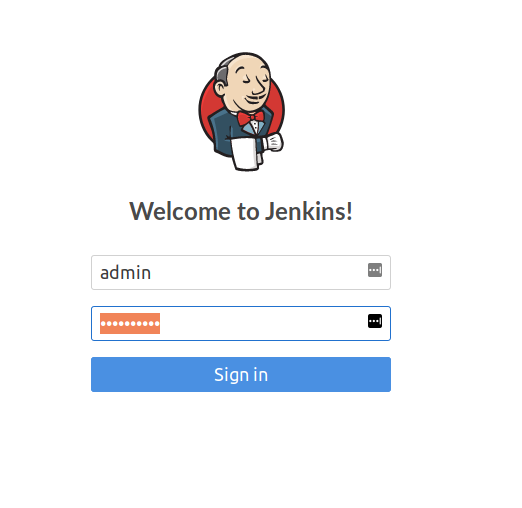
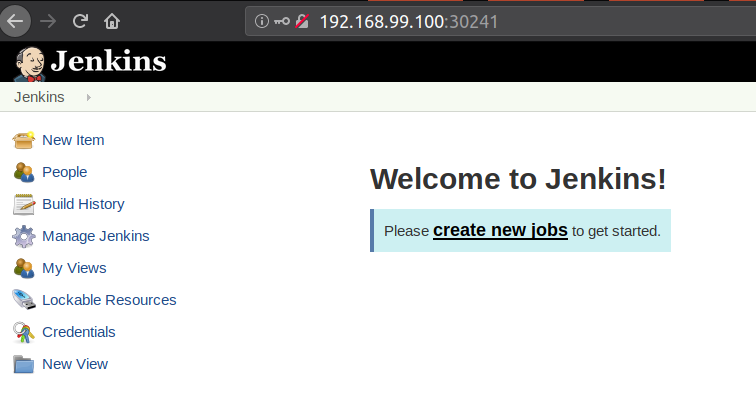
Login with the password from step 1 and the username: admin
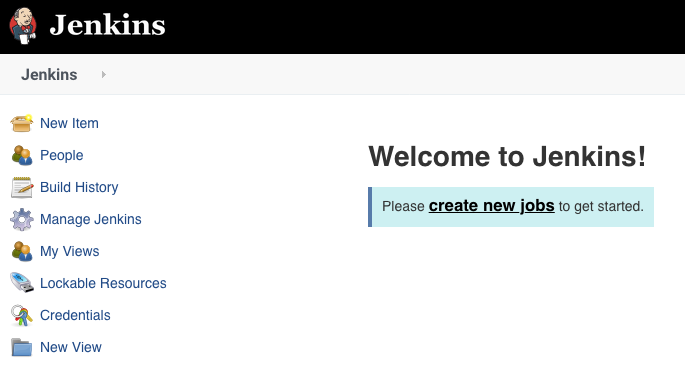
After following the steps to get the admin password and hit the Jenkins URL http://127.0.0.1:8080 in your desktop browser, you should see the familiar “Welcome to Jenkins!” page…
Pause a moment to appreciate that this Jenkins is running in a JVM inside a Docker container on a Kubernetes Pod as a Service in a Namespace in a Kubernetes Instance that’s running inside a Virtual Machine running under a Hypervisor on a host device….
turtles all the way down
there are many things I’ve skipped over here, including looking at storage, auth, security and all the usual considerations but the aim has been to quickly and easily get to this point so we can start developing the pipelines and processes we’re really wanting to focus on.
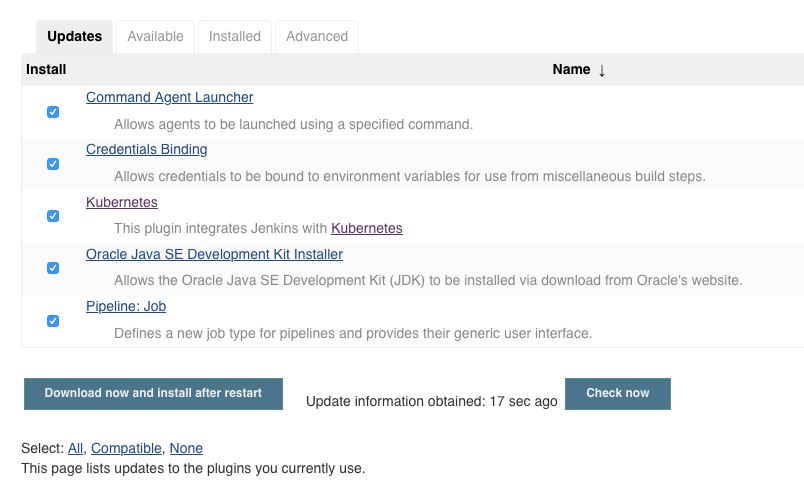
Navigating to Manage Jenkins then Plugins Manager should show some updates already available – this proves we have connectivity to the public Jenkins Update Centre out of the box. The Kubernetes Jenkins plugin is the key thing I’m looking for – select and update if required:
If you go to http://127.0.0.1:8080/configure you should see a link at the foot of the page to the new location for “Clouds”: http://127.0.0.1:8080/configureClouds/ – that should already be configured with sufficient settings for Jenkins to use your Kubernetes cluster, but it’s worthwhile taking a look through the settings and options there. No changes should be required here now though.
Setup a first Jenkins Pipeline job
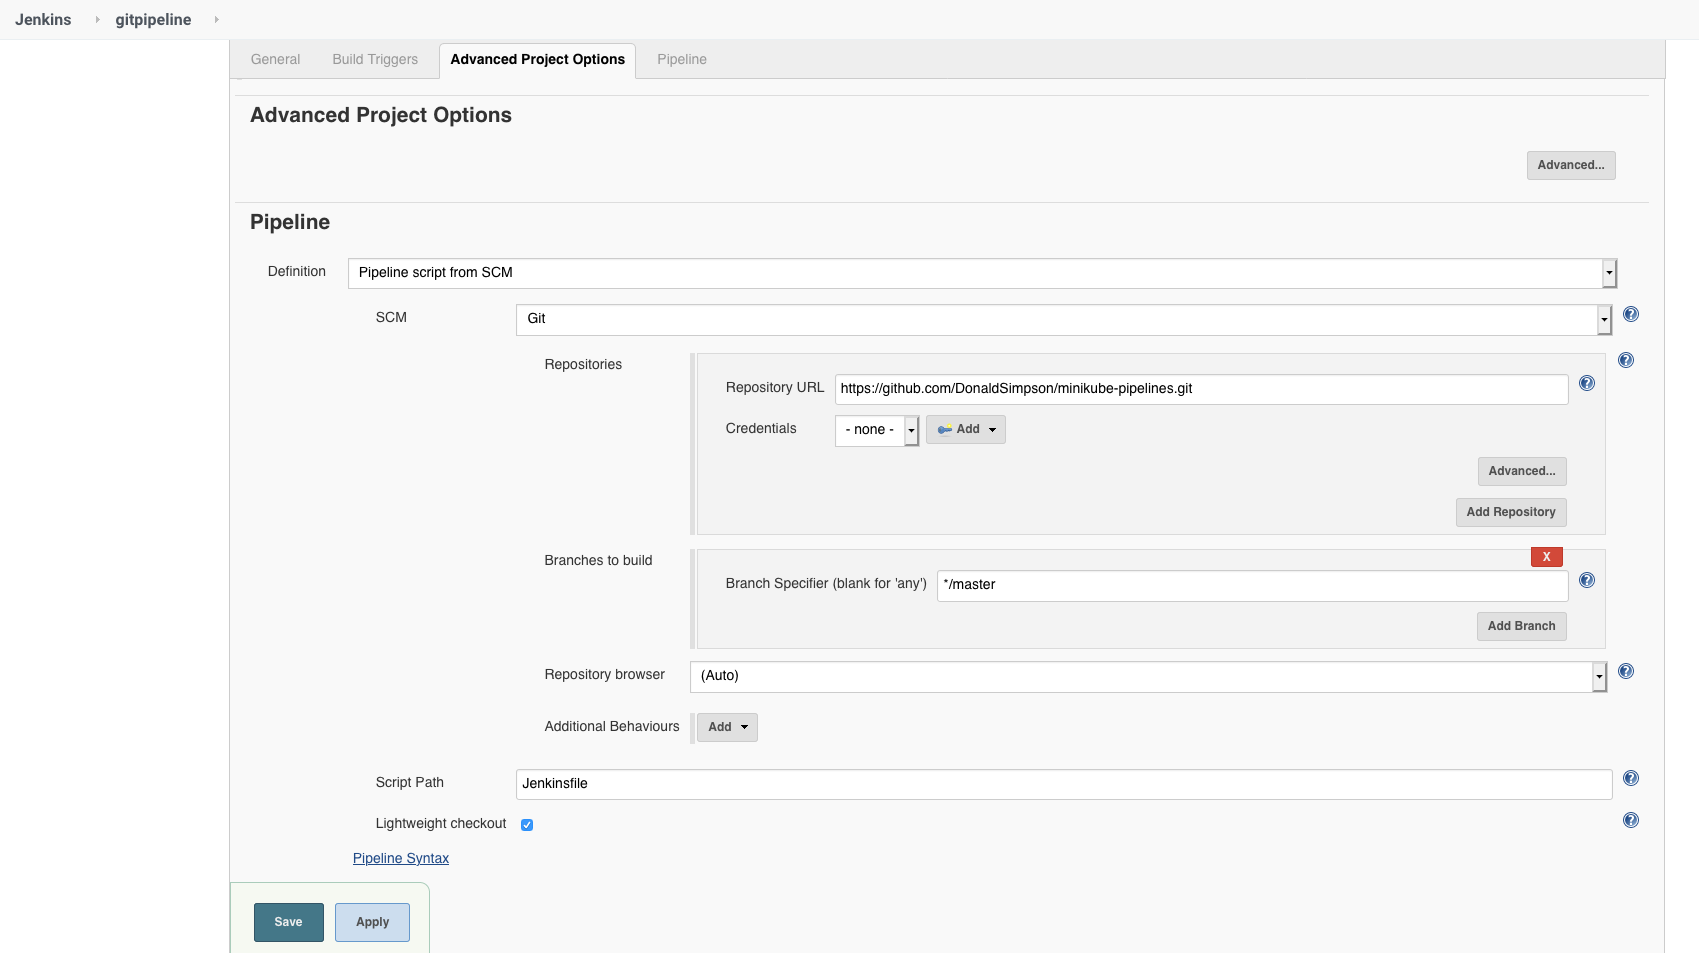
Create a new Jenkins Pipeline job and add the following settings as shown in the picture below…
In the job config page under “Pipeline”, for “Definition” select “Pipeline script from SCM” and enter the URL of this github project which contains my example pipeline code:
This file has been heavily commented to explain every part of the pipeline and shows what each step is doing. Taking a read through it should show you how pipelines work, how Jenkins is creating Docker Containers for the different Stages, and give you some ideas on how you could develop this simple example further.
Run it and take a look at the results
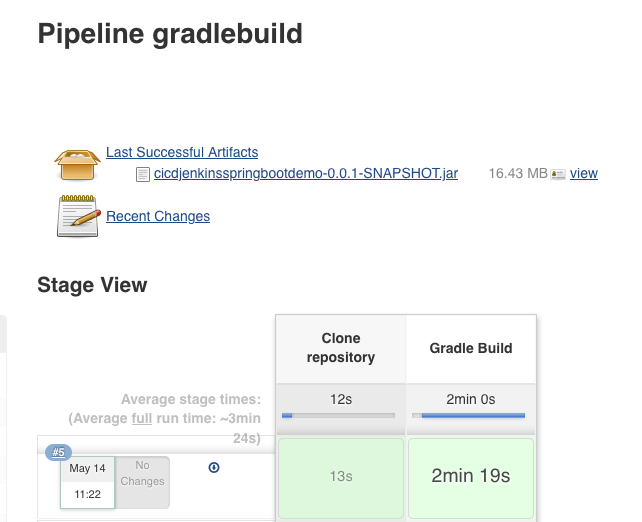
Save and run the job, and you should (eventually) see something like this:
The jobs Console Output will have a ton of info, showing everything from the container images being pulled, the git repo being cloned, the very verbose gradle build output and all the local files.
So in summary, what just happened?
Jenkins connected to Kubernetes via the Kubernetes plugin and its settings
A gradle Docker container was started and connected as a Jenkins JNLP Agent, running as another k8s pod
The gradle build stage was run inside that gradle container, using the source files checked out from git in the previous Stage
The newly built JAR file was archived so we could use it later if wanted
The pipeline ends, and k8s will clean up the containers
This pipeline could easily be expanded to run that new JAR file as an application as demonstrated here: https://github.com/AutomatedIT/springbootjenkinspipelinedemo/blob/master/Jenkinsfile#L5, or, you could build a new Docker image containing this version of the JAR file and start that up and test it and so on. You could also automate this so that whenever the source code is changed a build is triggered that does all of this automatically and records the result… hello CI/CD!
What next?
From the above demo you can hopefully see how easy it is to create an end to end pipeline that will automatically provision Jenkins Agents running on Kubernetes for you.
You can use this functionality to quickly and safely develop pipeline processes like the one we have examined, that run across multiple Agents, using each for a particular function/step in your workflow, leaving the provisioning and housekeeping work to the underlying Kubernetes cluster. With this, you can build or pull docker images, run them, test them, start them up as other Jenkins JNLP Agents and so on, all “as code” and all fully automated.
And after all that… ?
Being able to fire up Docker containers and use them as Jenkins Agents running on a Kubernetes platform is extremely powerful in itself, but you can go a step further and start using this setup to build, deploy and manage Kubernetes resources directly, too – from Jenkins Pipelines running on the same Kubernetes Cluster – or even from one Kubernetes to another.
We’ve seen during setup that we can use kubectl to manage the k8s cluster and its components – we can also do that from within containers and stages in our pipelines, wherever they are.
and contains an example pipeline and supporting files to build, lint, security scan, push to registry, deploy to Kubernetes, run, test and clean up the example “doncoin” application via a Jenkins pipeline running on Kubernetes.
It also includes outlines and suggestions for expanding things even further, in to a more mature and production-ready setup, introducing things like Jenkins shared libraries, linting and testing, automating vulnerability scanning within the pipeline, and so on.
This is a follow on to the previous writeup on Kubernetes with Minikube and shows how to quickly and easily get a Kubernetes cluster up and running using VirtualBox and Minikube.
The setup is very similar for all platforms, but this post is specifically focused on Mac, as I’m planning on using this as the basis for a more complex post on Jenkins & Kubernetes Pipelines (and that post is now posted, here!).
Installing required components
There are three main components required:
VirtualBox is a free and open source hypervisor. It is a light weight app that allows you to run Virtual Machines on most platforms (Mac, Windows, Linux). We will use it here to run the Minikube Virtual Machine.
Kubectl is a command line tool for controlling Kubernetes clusters, we install this on the host (Mac) and use it to control and interact with the Kubernetes cluster we will be running inside the Minikube VM.
Minikube is a tool that runs a single-node Kubernetes cluster in a virtual machine on your personal computer. We’re using this to provision our k8s cluster and will also take advantage of some of the developer friendly addons it offers.
Downloads and Instructions
Here are links to the required files and detailed instructions on setting each of these components up – I went for the ‘brew install‘ options but there are many alternatives in these links. The whole process is very simple and took about 10 minutes.
most popular hypervisors are well supported by Minikube.
Here’s what that looks like on my Mac – this may take a few minutes as it’s downloading a VM (if not already available locally), starting it up and configuring a Kubernetes Cluster inside it:
there’s quite a lot going on and not very much to see; you don’t even need to look at VirtualBox as it’s running ‘headless’, but if you open it up you can see the new running VM and its settings:
these values are all set to sensible defaults, but you may want to tweak things like memory or cpu allocations – running
minikube config -h
should help you see what to do, for example
minikube start --memory 1024
to change the allocated memory.
If you then take a look at the config file in ~/.minikube/config/config.js you will see how your preferences – resource limits, addons etc – are persisted and managed there.
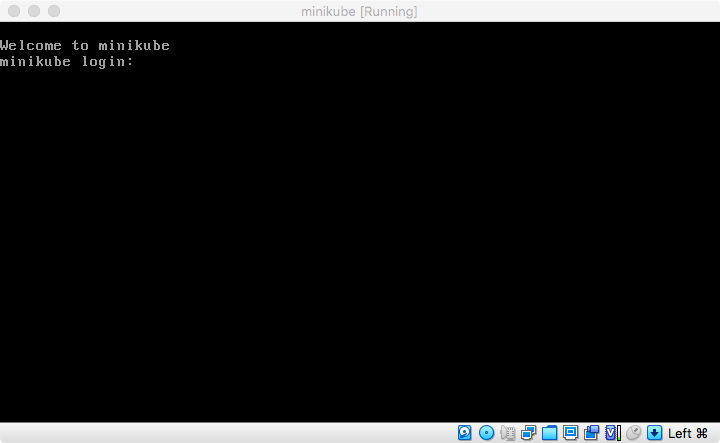
Looking back at VirtualBox, if you click on “Show” or the running VM you can open that up to see the console for the Minikube VM:
to stop the vm simply do a minikube stop, or just type minikube to see a list of args and options to manage the lifecycle, e.g. minikube delete, status, pause, ssh and so on.
Minikube Addons
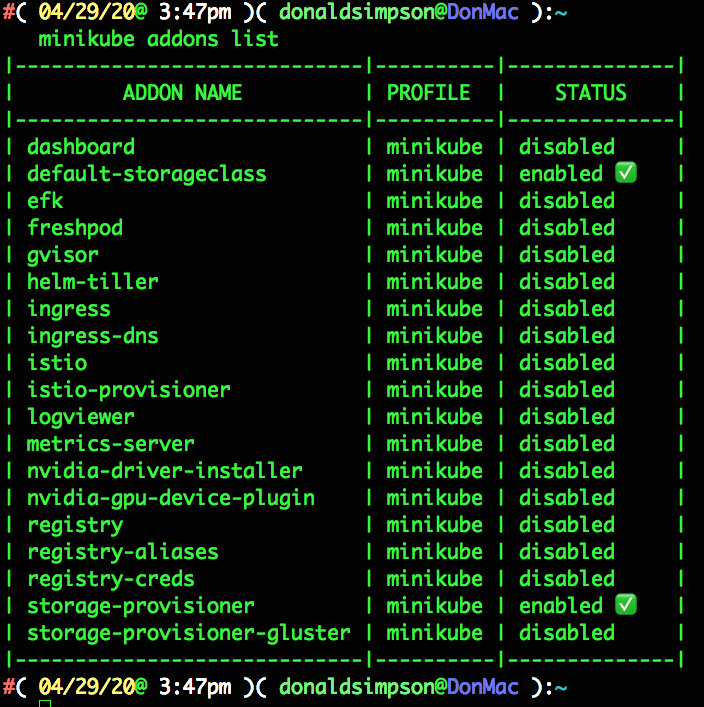
One of the handy features Minikube provides are its selection of easy to use addons. As explained in the official docs here you can see the list and current status of each addon by typing minikube addons list
the storage-provisioner and default-storeageclass addons were automatically enabled on startup, but I usually like to add the metrics server and dashboard too, like so:
I often use helm & tiller, efk, istio and the registry too – this feature save me a lot of time and messing about!
Accessing the Kubernetes Dashboard – all done!
Once that’s completed you can run minikube dashboard to open up the Kubernetes dashboard on your host.
Minikube makes this all very easy; we didn’t have to forward ports, configure firewalls, consider ingress and egress, create RBAC roles, manage accounts/passwords/keys or set up DNS, or any of the many things you would normally want or have to consider to get to this point.
These features make Minikube a great choice for development work, where you don’t want to care about things like this as you would in a “for real” environment.
Your browser should open up the Kubernetes Dashboard, and you can click around and see the status of the many components that comprise your new Kubernetes cluster:
And then…
Next up I’ll be building on this setup by deploying a Jenkins instance inside the Kubernetes Cluster, then configuring that to use Kubernetes to build, manage and deploy applications on the same Kubernetes Cluster.
Helm and Tiller – what they are, when & why you’d maybe use them
Helm and Tiller – prep, install and Helm Charts
Deploying Jenkins via Helm Charts
and WordPress w/MariaDB too
Wrap up
The below are mostly my technical notes from this session, with some added blurb/explanation.
Helm and Tiller – what they are, when & why you’d maybe use them
From the Helm site:
“Helm helps you manage Kubernetes applications — Helm Charts help you define, install, and upgrade even the most complex Kubernetes application. Charts are easy to create, version, share, and publish — so start using Helm and stop the copy-and-paste.”
Helm is basically a package manager for Kubernetes applications. You can choose from a large list of Stable (or not so!) ready made packages and use the Helm Charts to quickly and easily deploy them to your own Kubernetes Cluster.
This makes light work of some very complex deployment tasks, and it’s also possible to extend these ready-made charts to suit your needs, and to write your own Charts from scratch, or pass your own values to override default ones, or… many other interesting options!
For this session we are looking at installing Helm, reviewing some example Helm Charts and deploying a few “vanilla” ones to the cluster we created in the first half of the session. We also touch upon the life-cycle of Helm Charts – it’s similar to dockers – and point out some of the ways this could be extended and customised to suit your needs – more on this at a later date hopefully.
Helm and Tiller – prep, install and Helm Charts
First, installing Helm – it’s as easy as this, run on your laptop/host that’s running the Minikube k8s we setup earlier:
Tiller is the client part of Helm and is deployed inside your k8s cluster. It’s set to be removed with the release of Helm 3, but the basic functionality wont really change. More details here https://helm.sh/blog/helm-3-preview-pt1/
Next we do the Tiller prep & install – add RBAC for tiller, deploy via helm and take a look at the running pods:
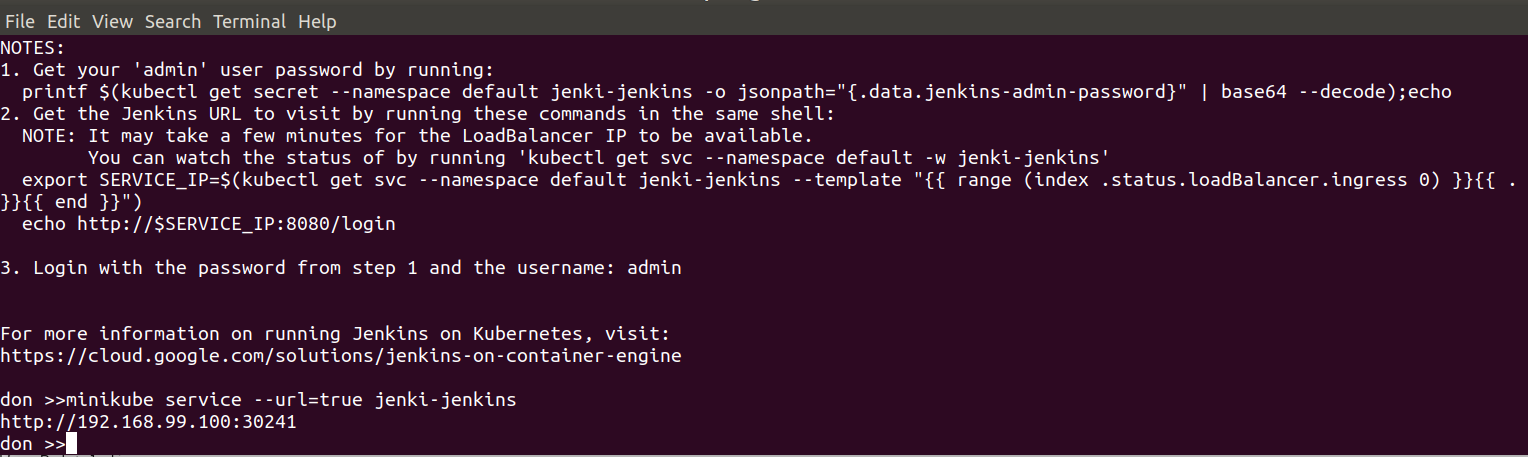
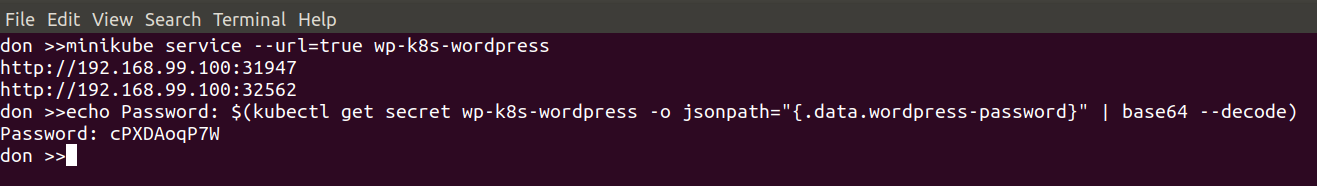
now get the URL for the Jenkins service from Minikube:
minikube service --url=true jenki-jenkins
Hit that URL in your browser, and grab the password in UI from Pods > Jenki and log in to Jenkins with the user “admin”:
That’s a Jenkins instance deployed via Helm and Tiller and a Helm Chart to our Kubernetes Cluster running inside Minikube via a VirtualBox VM… all done in a few minutes. And it’s all customisable, repeatable, highly scaleable and awesome.
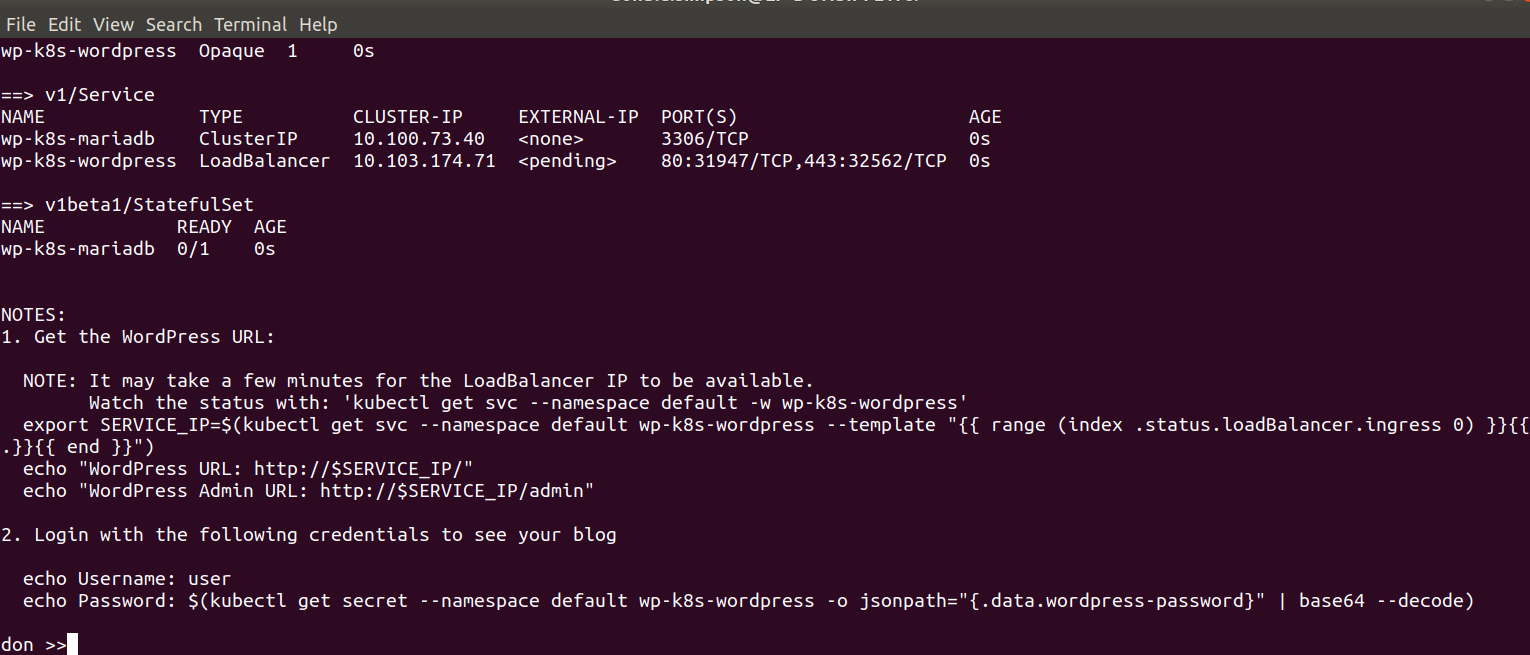
and WordPress w/MariaDB too
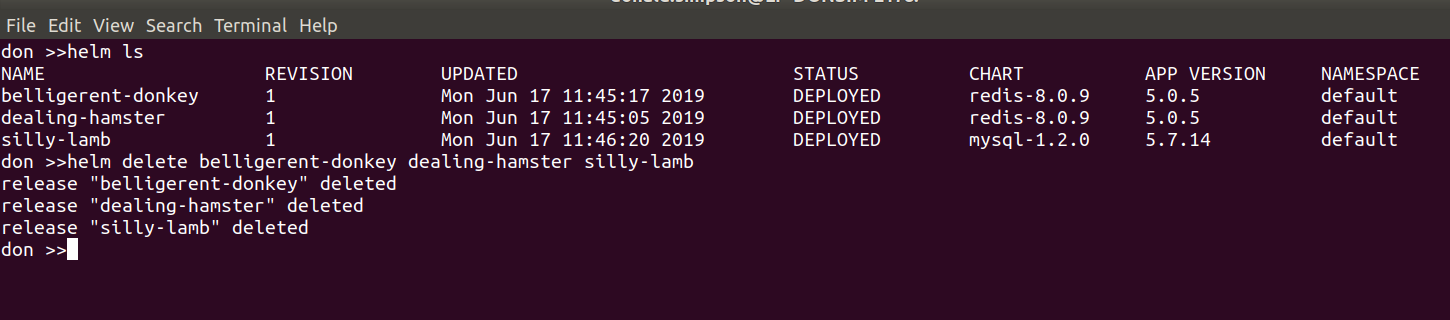
This was the “bonus demo” if my laptop wasn’t on fire – and thanks to some rapid cleaning up it managed fine – showing how quickly we could deploy a functional WordPress with MariaDB backend to our k8s cluster using the Helm Chart.
To prepare for this I did a helm ls to see all the things I had running. then helm delete --purge jenki, gave it a while to recover then had to do
kubectl delete pods <jenkinpod>
before starting the WordPress Chart deployment with
That’s it – we covered a lot in this session, and plan to use this as a platform to explore Helm in more detail later, writing our own Helm Charts and providing our own customisations to them.
Update: this follow-on post runs through setting up Jenkins with Helm then creating Jenkins Pipelines that dynamically provision dockerised Jenkins Agents:
This is the first of two posts on Kubernetes and HelmCharts, focusing on setting up a local development environment for Kubernetes using Minikube, then exploring Helm for package management and quickly and easily deploying several applications to the cluster – NGINX, Jenkins, WordPress with a MariaDB backend, MySQL and Redis.
The content is taken from the practical/demo session I wrote and published in Github here:
One of the key objectives and challenges here was getting a useful local Kubernetes environment up and running as quickly and easily as possible for as wide an audience as we could- there’s so much to the Kubernetes ecosystem that it’s very easy to get side-tracked, and we could have (happily) spent a long time discussing the myriad of alternative possible solutions.
We plan to go “deeper” on all of this in future sessions and have an in-depth Helm session in the works, but for this session we were focused on creating a practical starting point.
</ramble>
Don
What is covered here:
Minikube – what it is (& isn’t) & why you’d use it (or not)
Kubernetes and Minikube components and concepts
setup for Mac and Linux
creating a first Kubernetes cluster in Minikube
minikube addons – what they are and how they can help you
minikube docker env – using DOCKER_HOST with minikube VM
Kubernetes dashboard with Heapster and Metrics Server – made easy by Minikube
kubectl – some examples and alternatives
example app – “hello (Kubernetes) world” minikube style with NGINX, scaling your world
Helm and Tiller – what they are, when & why you’d maybe use them
Helm and Tiller – prep, install and Helm Charts
Deploying Jenkins via Helm Charts
and WordPress w/MariaDB too
wrap up
Minikube – what it is (& isn’t) & why you’d use it (or not)
What it is, why you’d use it etc.
Local development of k8s – runs a single node Kubernetes cluster in a Virtual Machine on your laptop/PC.
All about making things easy for local development, it is not a production solution, or even close to it.
There are many other ways to run k8s, they all have their pros and cons and use cases. The slides from the Meetup covered this in more detail and include links for further info – they are available here:
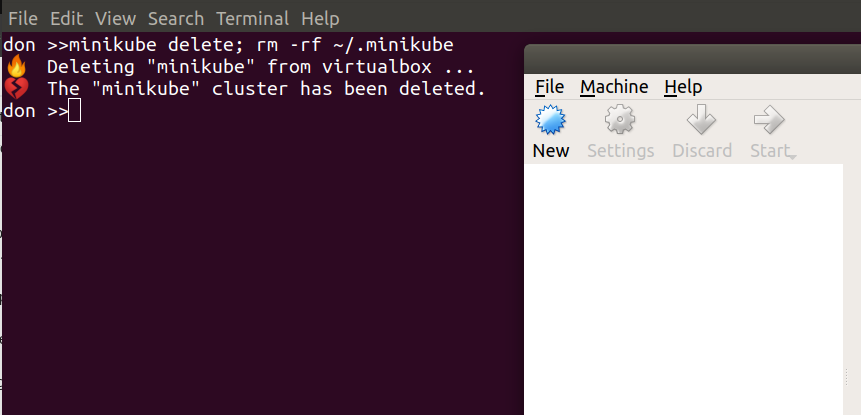
Cleanup/prep – if required, remove any previous cluster & settings
`minikube delete; rm -rf ~/.minikube`
Creating a first Kubernetes cluster in Minikube
Here we create a first Kubernetes cluster with Minikube, then take a look around in & outside of the VM.
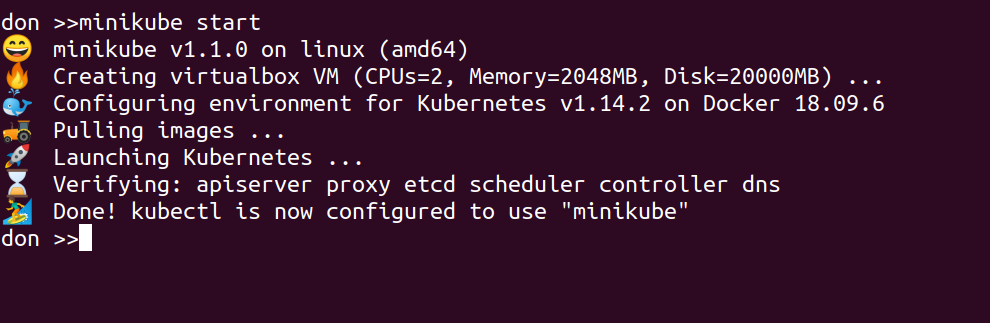
With the above initial setup done, it’s as simple as running this in a shell:
minikube start
Note you could optionally give this Cluster a name, if you are likely to have more than one for different branches of development for example. This is also where you could specify the VM provider if you want to use something other than VirtualBox – there are more details here:
This should produce output like the following, and it may well take a few minutes as the VM is downloaded and started, then a stack of Docker images are started up inside that….
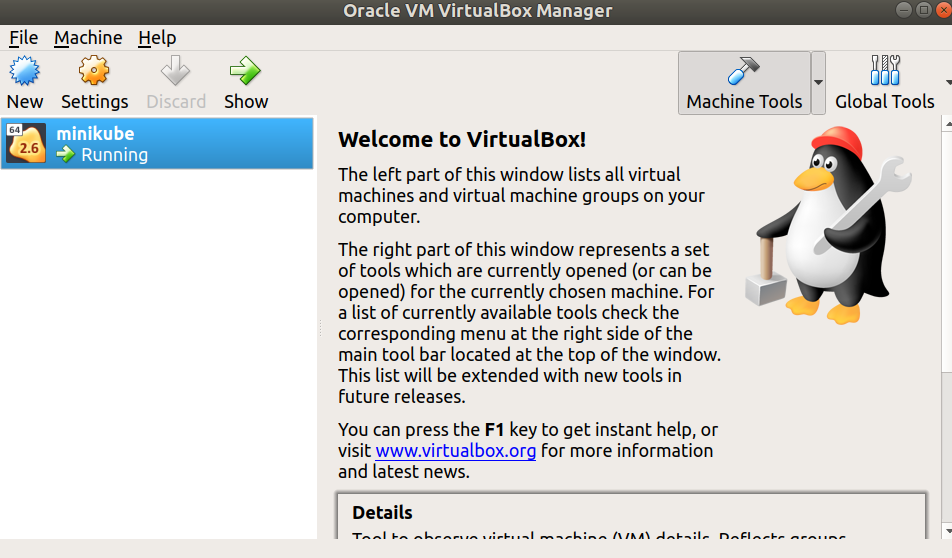
At this point you should be able to see the minikube VM running in the VirtualBox GUI:
Now it’s running, we can connect from our local shell directly to the one inside the running VM by simply issuing:
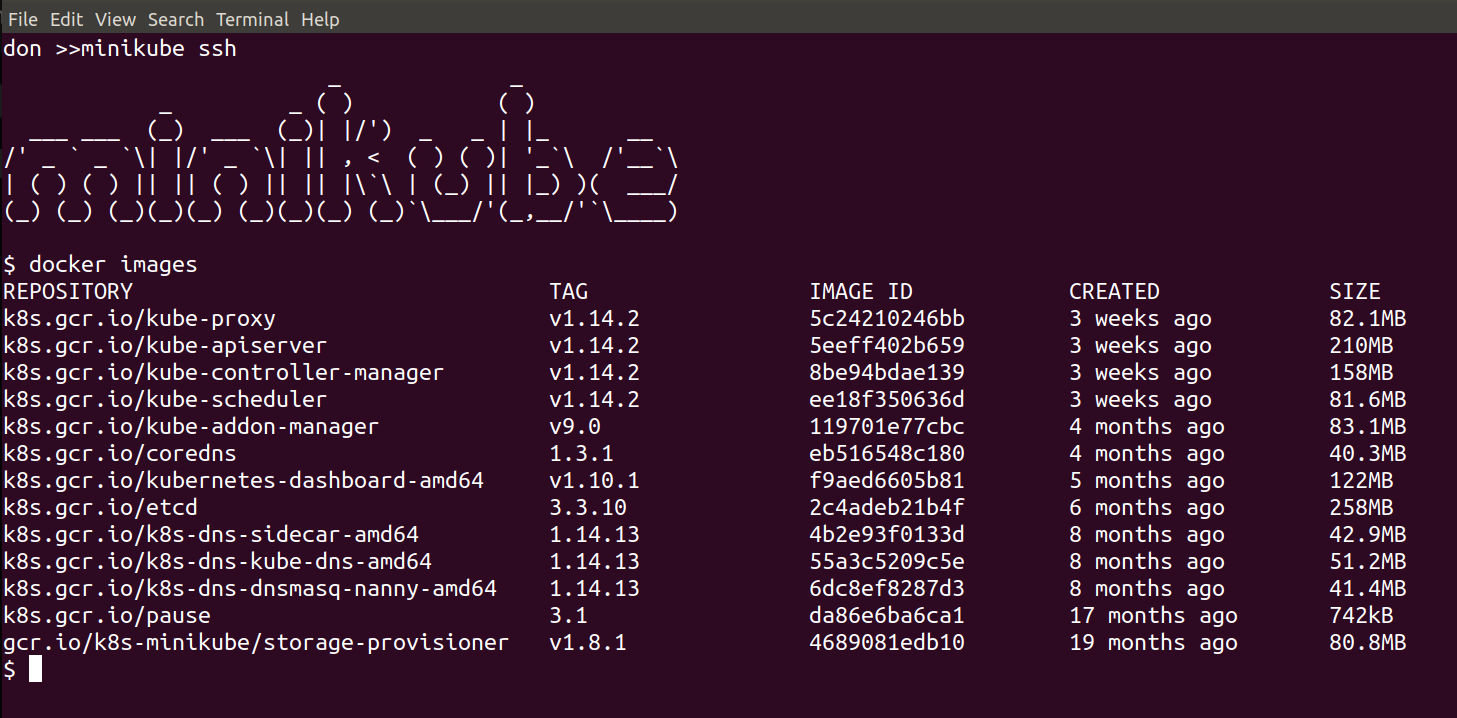
minikube ssh
This will put you inside the VM where the Kubernetes Cluster is being run, and we can see and interact with the running components, for example:
docker images
should show all of the downloaded images:
and you could do this to see the running containers:
docker ps
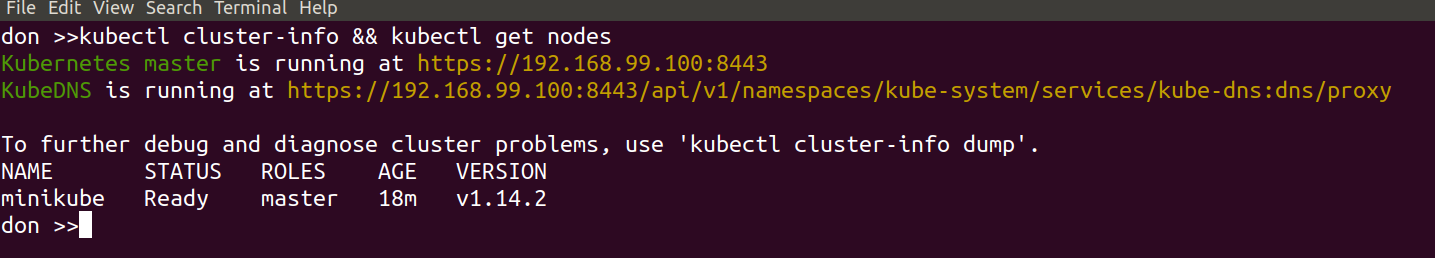
Quitting out of the VM puts us back on the local host, where we can use kubectl to query the status of the Minikube cluster – the initial setup has told kubectl about the Minikube-managed Kubernetes Cluster, meaning there’s no other setup required here:
kubectl cluster-info
kubectl get nodes
kubectl describe nodes
minikube addons – what they are and how they can help you
Show some of the ways minkube makes things easier for local dev
First, take a moment to look around these two local folders:
ls -al ~/.minikube; ls -al ~/.kube
These are where Minikube keeps its settings and the VM Image, and where kubectl settings are persisted – and updated by Minikube.
With Minikube you’ve often got the option to either use kubectl directly, or to use some Minikube built-in features to make your life easier.
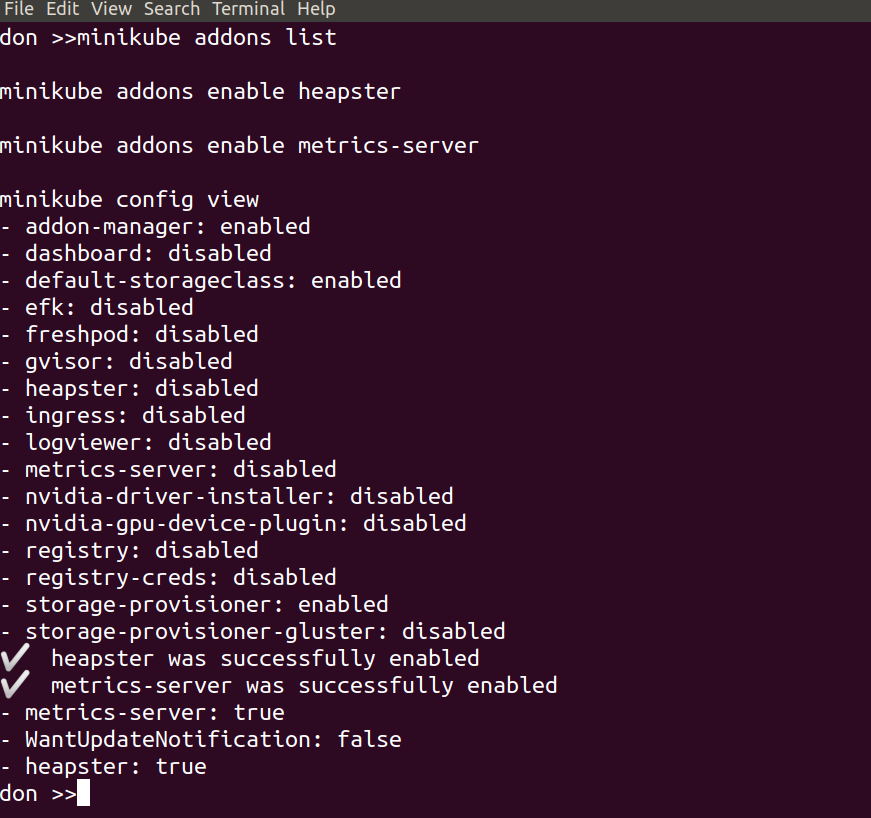
Addons are one of these features, allowing you to very easily add – or remove – functionality from the cluster like this:
minikube addons list
minikube addons enable heapster
minikube addons enable metrics-server
With those three lines we’ve taken a look at the available addons and their current status, and selected to enable both heapster and the metrics server. This was done to give us cpu and mem stats in the Kubernetes Dashboard, which we will set up in a moment. The output should look something like this:
minikube config view
shows the current state of the config – i.e. what changes have been made, so we can keep a track of them easily.
kubectl --namespace kube-system get pods
now we can enable the dashboard:
minikube addons enable dashboard
and check again to see the current state
minikube addons list
we’ll connect to the Dashboard and take a look around in a moment, but first…
minikube docker env – using the DOCKER_HOST in you minikube VM – how & why
Minikube docker-env – setup local docker client to use minikube docker host
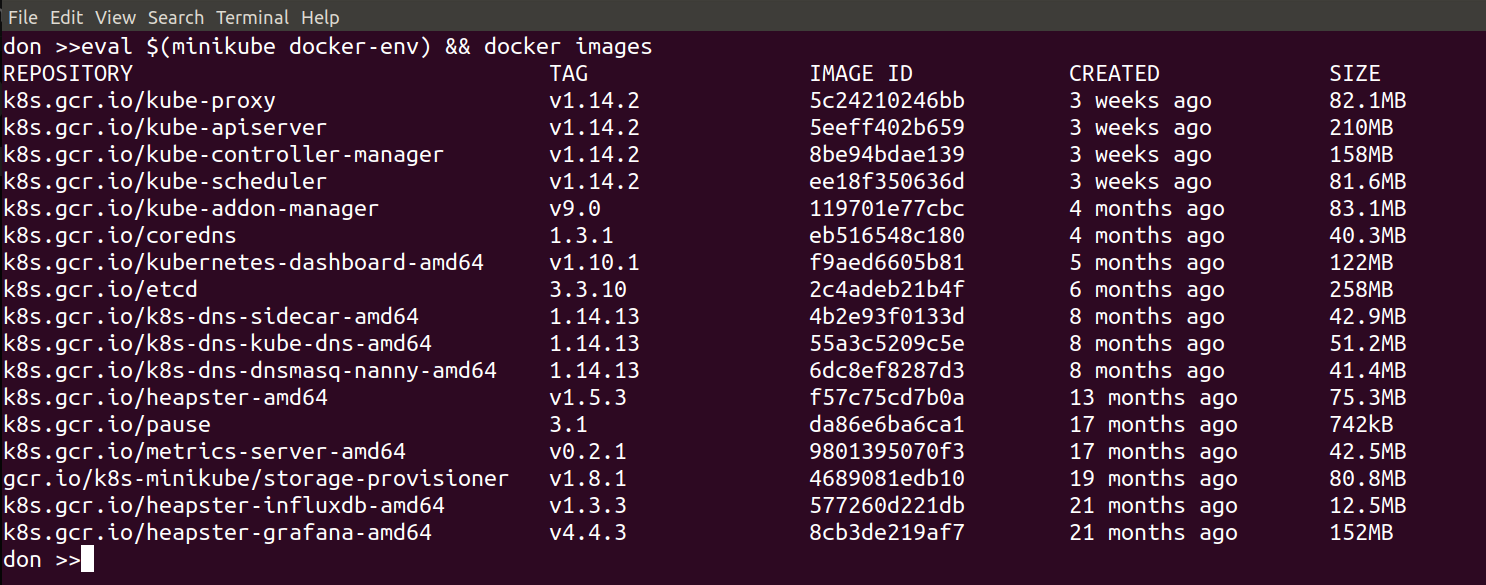
We’re going to look at connecting our local docker client to the docker host inside the Minikube VM. This is made easy by:
minikube docker-env
if you run that command on its own it wiull show you what settings it will export and you can set them by doing:
eval ${minikube docker-env}
From then on, in that shell, your local docker commands will use the docker host inside Minikube.
This is very useful for debugging and local development – when you change and deploy anything to your Kubernetes Cluster, you can easily tail the logs or check for errors or issues. You can also do all of this via the dashboard or kubectl too if you prefer, but it’s another handy and powerful feature from Minikube.
The following image shows the result of running this command:
so we can now use our local docker client to run docker commands like…
docker ps
docker ps | grep -i metrics
docker logs -f <some container id>
etc.
Kubernetes dashboard with Heapster and Metrics Server – made easy by Minikube
Minikube k8s dashboard – here we will start up the k8s dashboard and take look around.
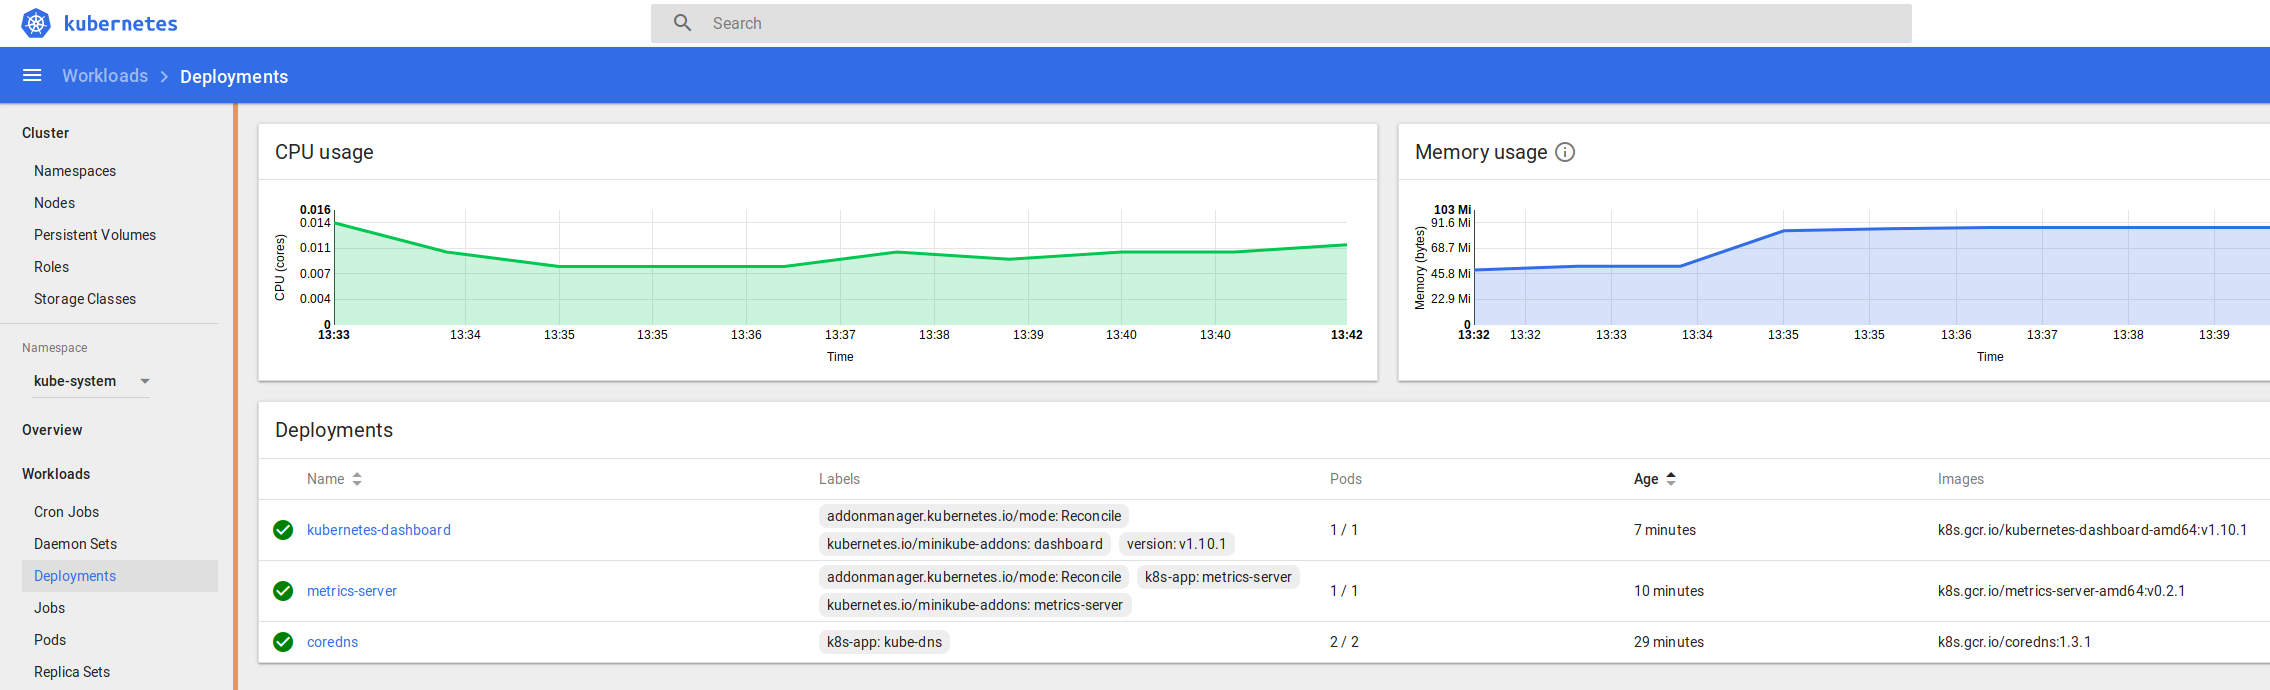
We’ve delayed starting the dashboard up until after we enabled the metrics-server & heapster components we deployed earlier. By doing it in this order, the dashboard will automatically detect and use these components, giving us cpu & mem stats and a nicer looking dash, with no additional config required.
Starting the dashboard simply involved running
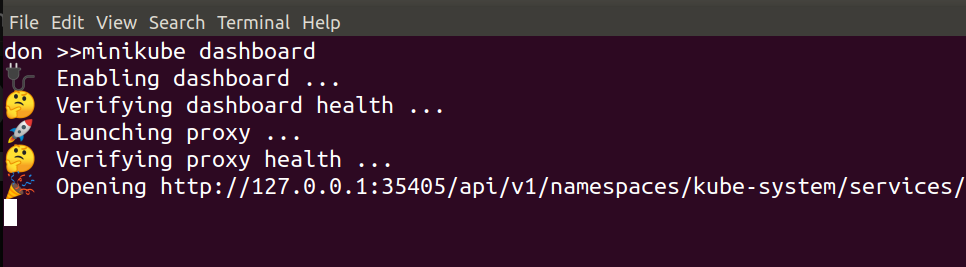
minikube dashboard
and waiting for a minute…
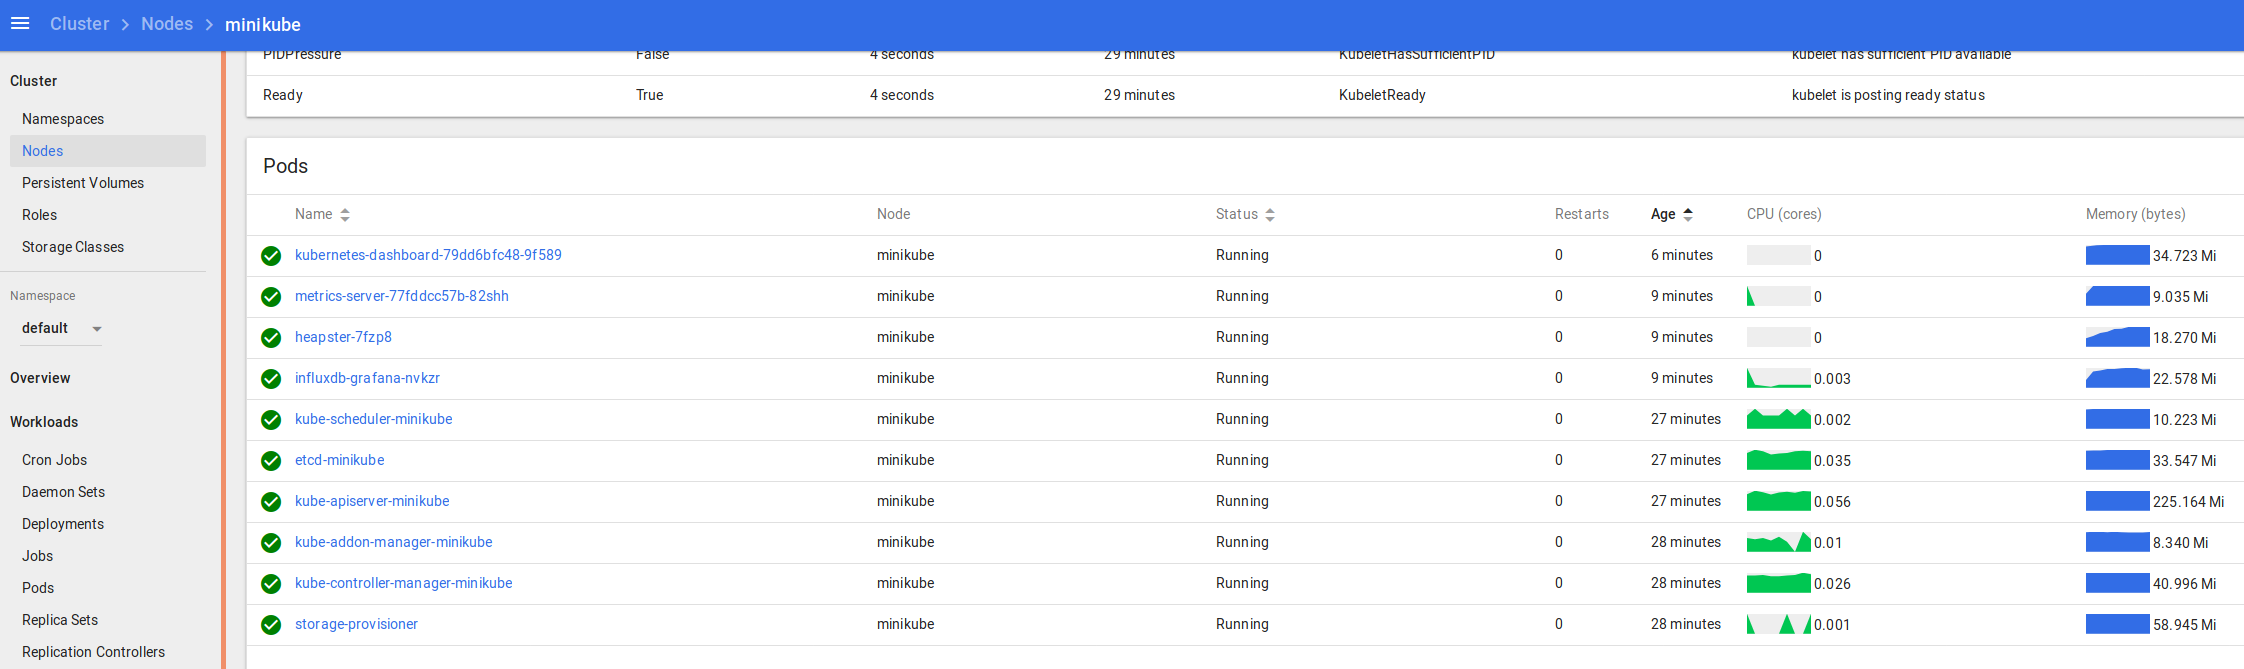
That should fire up your browser automatically, then you can take a look around at things like Default namespace > Nodes
and in the namespace kube-system > Deployments
and kube-system > Pods
You can see the logs and statuses of everything running in your k8s cluster – from the core components we covered at the start, to the dashboard, metrics and heapster we enabled recently, and the application we’re going to deploy and scale up soon.
kubectl – some examples and alternatives
# kubectl command line – look at kubectl and keep an eye on things kubectl get deployment -n kube-system
kubectl get pods -o wide -n kube-system
kubectl get services
kubectl
example app – “hello (Kubernetes) world” minikube style with NGINX, scaling your world
Now we’ll deploy the most basic application we can – a “Hello World” style NGINX docker image.
It’s as simple as this, where nginx is the name of the docker image you want to deploy, hello-nginx is the label you want to give it, and port 80 is where you want it to listen:
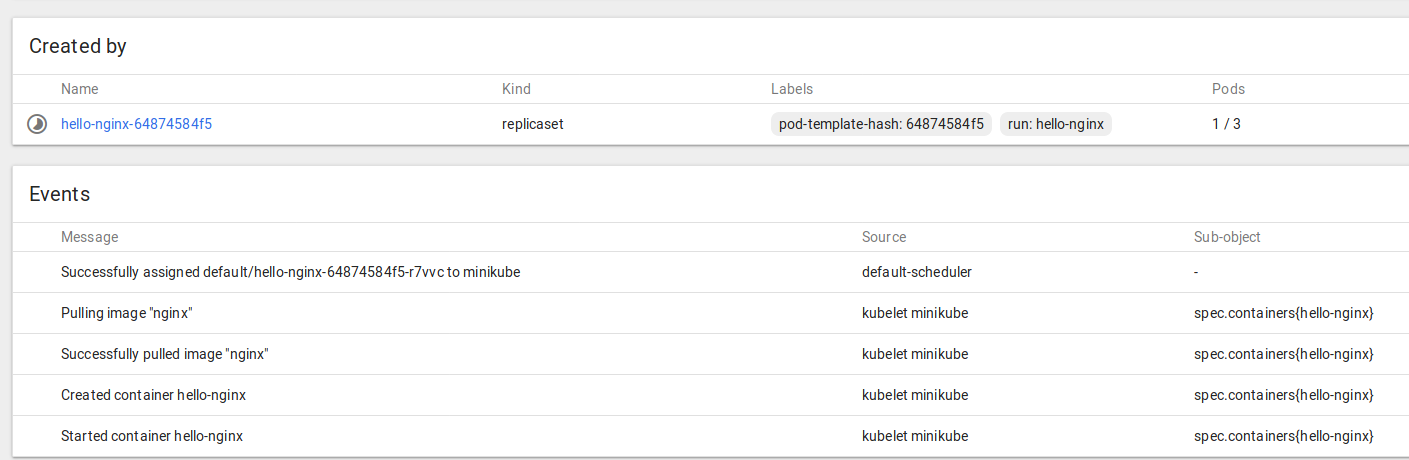
kubectl run hello-nginx --image=nginx --port=80
that shouldn’t take long, and you can watch the progress like this:
This post runs through the steps required to start using Global Pipeline Libraries in your Jenkins Pipelines.
There are many reasons you may want to use this functionality, the main attraction for me is to provide centralised libraries that perform common functions for multiple instances of Jenkins. This removes a lot of complexity from the pipelines and also reduces code repition; for example, you may have 10 Jenkins instances all performing the same general task, each using slightly diferent code. If you want to update how this task is done, you may have to find and update each instance. Alteratively, using this approach, you can update the central version and know that all of your Jenkins Pipelines that consume it will be udpated.
There are many posts about these all over the ‘net, but they mostly seemed overly complex, too specific and none too helpful to me – I just wanted to know how to get the most basic example possible working quickly on my dev Jenkins instance, so I could see how they work in practice and take it from there.
That’s what this post covers – getting a simple “Hello World” type example library published and made available in Jenkins, then calling it very easily from within a Pipeline job with the expected results. More detail and advanced usage to come later… these are a very powerful addition to Jenkins pipelines and once you see how they work, you may also see benefits to migrating some of your common tasks over to them.
This is done in three simple and logical steps:
Create a Library and Publish it
Tell Jenkins about your nice new library
Calling the Global Library from my Jenkins Pipeline
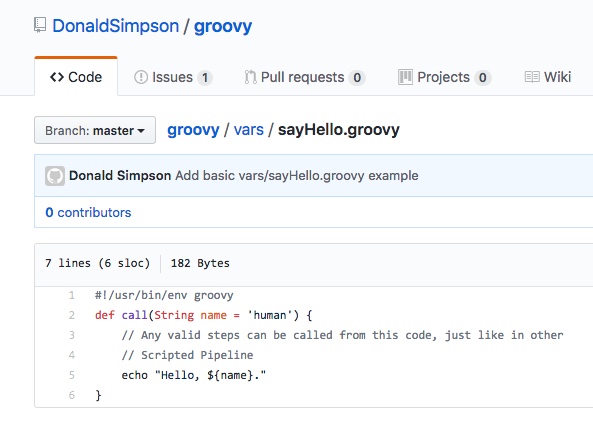
That’s all that’s needed for this most-basic example – here is the code in plain text, as taken from the guide here:
#!/usr/bin/env groovy
def call(String name = 'human') {
    // Any valid steps can be called from this code, just like in other
    // Scripted Pipeline
    echo "Hello, ${name}."
}
It is important to note that the file is in a “vars” directory, this is the naming convention Jenkins expects to find your groovy libraries within, and is best followed.
A. Note
Next step is to:
Tell Jenkins about your nice new library
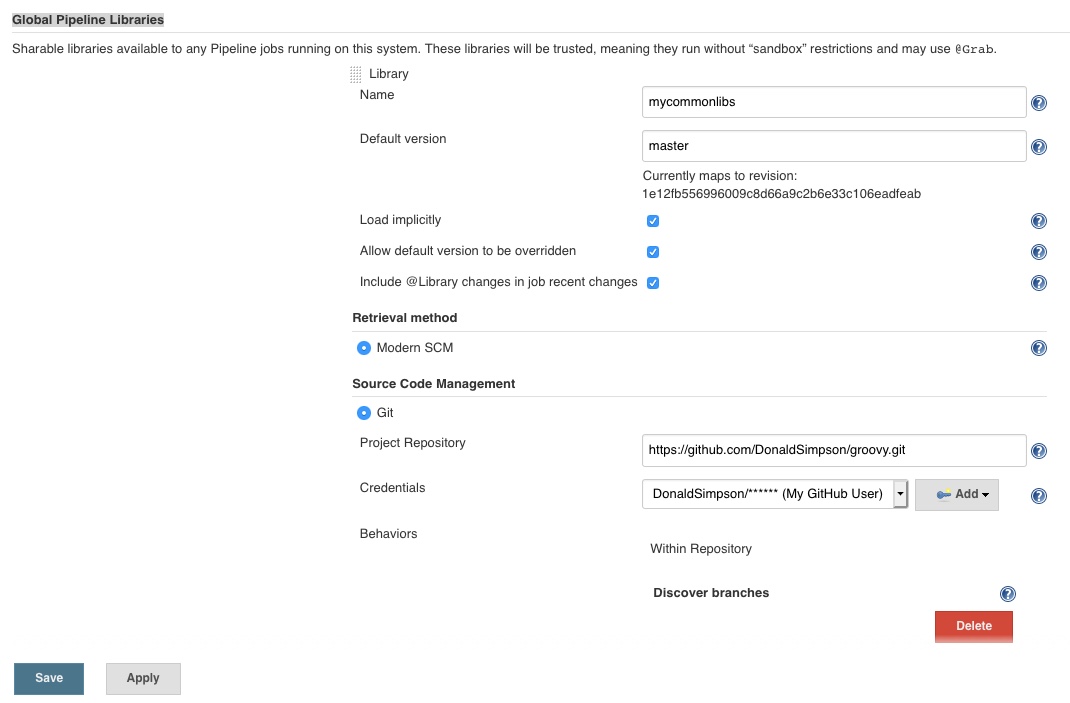
This is done by going to Manage Jenkins then Configure System, then scrolling down to Global Pipeline Libraries and defining a new instance of one, just like this:
The settings used here are:
Name: mycommonlibs // any “friendly” name you’d like to reference these libraries by
Default version: master // or use a branch or version number if you prefer
I then checked the three tick boxes, especially the Load implicitly which removes the need to load Libraries explicitly in your Jenkinsfile (you can do this, and it may be very useful depending on your needs, but I want simple and easy for now).
The final section tells Jenkins where this Library is:
That is all that is needed to set up a Library and tell Jenkins all about it.
Note that anyone with write access to the location of your defined Libraries will effectively have full access to your Jenkins instance – if they can update the code that’s being run…
W. Arning
And finally, it’s time for a test drive…
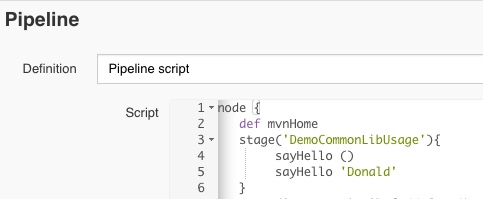
Calling the Global Library from my Jenkins Pipeline:
    sayHello ()
    sayHello 'Donald'
To end up with a mega-basic Pipeline that looks like this:
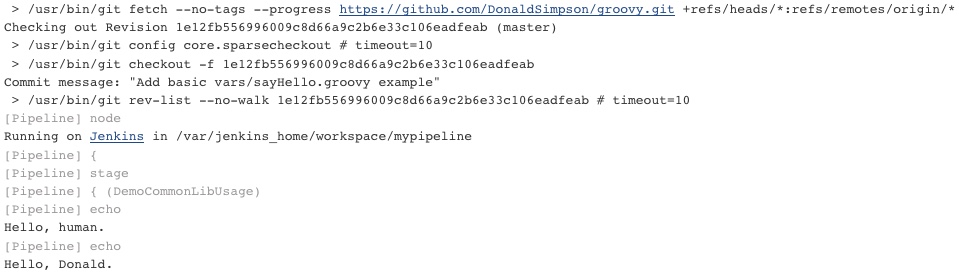
When this Jenkins Pipeline job is run, it generates the following output:
Summary
Which as you can see means that Jenkins has pulled in the Shared Library from GitHub, resolved and called the sayHello() method from the remote common library, called it again with a passed parameter (‘Donald‘) and produced the expected results. Yay. How neat and how easy was that?
There’s a whole lot more you can do with Global Pipeline Libraries in Jenkins. From this point you can easily add complexity and functionality to build up a library of powerful and useful utilities that will greatly improve the quality and manageability of your Pipelines. I generally start by finding common tasks and patterns and externalise those to shared libraries.
I plan to expand on some of these points in a later post, but hopefully this shows how to quickly and easily start using them.
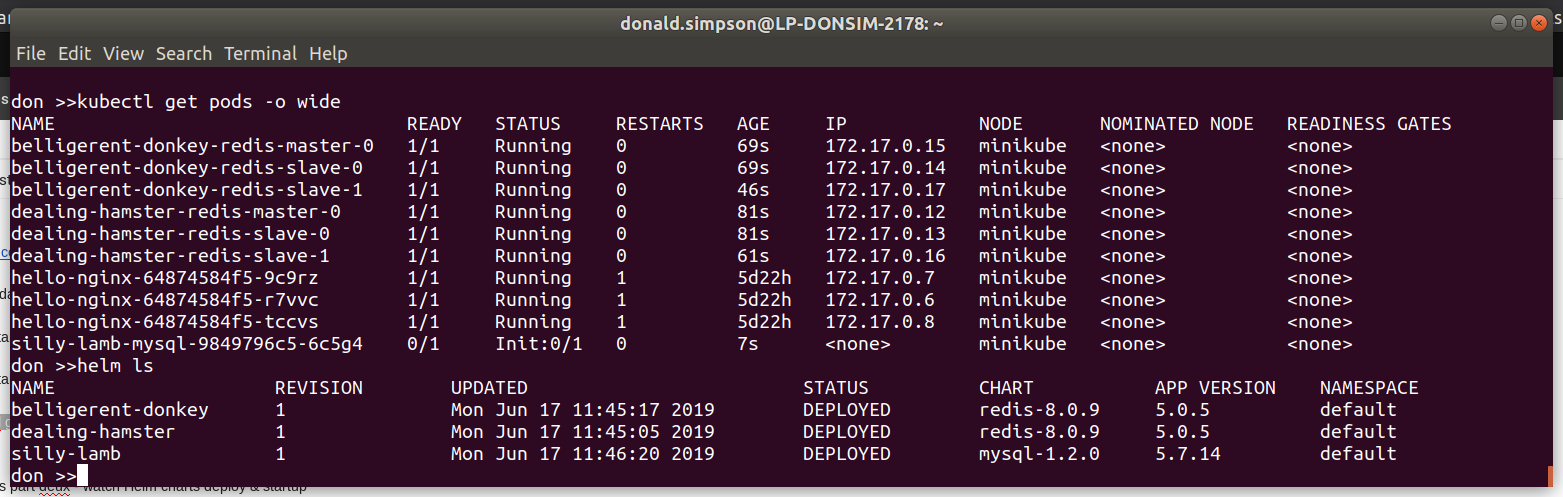
There was an obvious flaw in the example MySQL Chart I deployed via Helm and Tiller, in that the required Persistent Volume Claims could not be satisfied so the pod was stuck in a “Pending” state for ever.
Adding Persistent Storage
In this post I will sort that out, by adding Persistent Storage to the Cluster and redeploying and testing the same Chart deployed via “helm deploy stable/mysql“. This time, it should be able to claim all of the resources it needs with no tweaking or hints supplied…
First a few notes on some of the commands and tools I used for troubleshooting what was wrong with the mysql deploy.
watch -d 'sudo kubectl get pods --all-namespaces -o wide'

watch -d kubectl describe pod wise-mule-mysql

kubectl attach wise-mule-mysql-d69788f48-zq5gz -i
The above commands showed a pod that generally wasn’t happy or connectable, but little detail.
Running “kubectl get events -w” is much more informative:
LAST SEEN   TYPE      REASON              KIND                    MESSAGE
17m         Warning   FailedScheduling    Pod                     pod has unbound immediate PersistentVolumeClaims
17m         Normal    SuccessfulCreate    ReplicaSet              Created pod: quaffing-turkey-mysql-65969c88fd-znwl9
2m38s        Normal    FailedBinding       PersistentVolumeClaim   no persistent  volumes available for this claim and no storage class is set
17m         Normal    ScalingReplicaSet   Deployment              Scaled up replica set quaffing-turkey-mysql-65969c88fd to 1
and doing “kubectl describe pod <pod name>” is also very useful:
<snip a whole load of events and details>
  Type     Reason            Age                    From               Message
  ----     ------            ----                   ----               -------
  Warning  FailedScheduling  5m26s (x2 over 5m26s)  default-scheduler  pod has unbound immediate PersistentVolumeClaims
Making it pretty clear what’s going on and exactly what is noticeably absent from the Cluster.
My initial plan had been to use GlusterFS and Heketi, but having dabbled with this before and knowing it wasn’t really something I wanted to do for this use case, it was a bit of Yak Shaving I’d really like to avoid if possible.
So, I had a look around and found “Rook“. This sounded much simpler and more suited to my needs. It’s also open source, Apache licensed, and works on multi-node clusters. I’d previously considered using hostPath storage but it’s a bit too basic even for here, and would restrict me to a single node cluster due to the (lack of) replication, missing a lot of the point of a Cluster, so I thought I’d give Rook a shot.
I tried to follow this but had some issues, which I will try and clarify when I run through this again – I’d made a bit of a mess trying a bit of Gluster and some hostPath and messing about with the default storage class etc, so it was quite possibly “just me”, and not Rook to blame here 🙂 This is some of my shell history:
I definitely ran through this more than once, and I think it also took a while for things to start up and work – the subsequent runs went much better than the initial ones anyway. I also applied a few patches to the rook user and storage class (below) – these and many other alternatives were recommended by others facing similar sounding issues, but I think for me the fundamental is solved further below, re the rbd binary missing from $PATH, and installing ceph:
kubectl get secret rook-rook-user -oyaml | sed "/resourceVer/d;/uid/d;/self/d;/creat/d;/namespace/d" | kubectl -n kube-system apply -f -
kubectl get secret rook-rook-user -oyaml | sed "/resourceVer/d;/uid/d;/self/d;/creat/d;/namespace/d" | kubectl -n default -f -
kubectl get secret rook-rook-user -oyaml | sed "/resourceVer/d;/uid/d;/self/d;/creat/d;/namespace/d" | kubectl -n default apply -f -
That all done, I still had issues with my pods, specifically this error:
MountVolume.WaitForAttach failed for volume “pvc-4895a379-104b-11e9-9d98-000c29702bc8” : fail to check rbd image status with: (executable file not found in $PATH), rbd output: ()
which took me a little while to figure out. I think reading this page on RBD gave me the hint that there was something (well yeah, the rbd binary specifically) missing on the hosts, but there’s a lot of talk of folk solving this by creating custom images with the rbd binary added to the $PATH in them, replacing core k8s containers with them, which didn’t sound too appealing to me. I had assumed that the images would include the binaries, but hadn’t checked this is any way.
This issue may well be part or possibly all of the reason why I ran the above commands repeatedly and applied all of those patches.
The simple yet not too obvious solution to this – in my case anyway – was to ensure that the ceph common package was available both on the master:
apt-get update && apt-get install ceph-common -y
and critically that it was also available on each of the worker nodes too.
Once that was done, I think I deleted and reapplied everything rook-related again, then things started working as they should, finally.
A quick check:
ansible@umaster:~$ kubectl get sc
 NAME                   PROVISIONER     AGE
 rook-block (default)   rook.io/block   22h
And things are looking much better now.
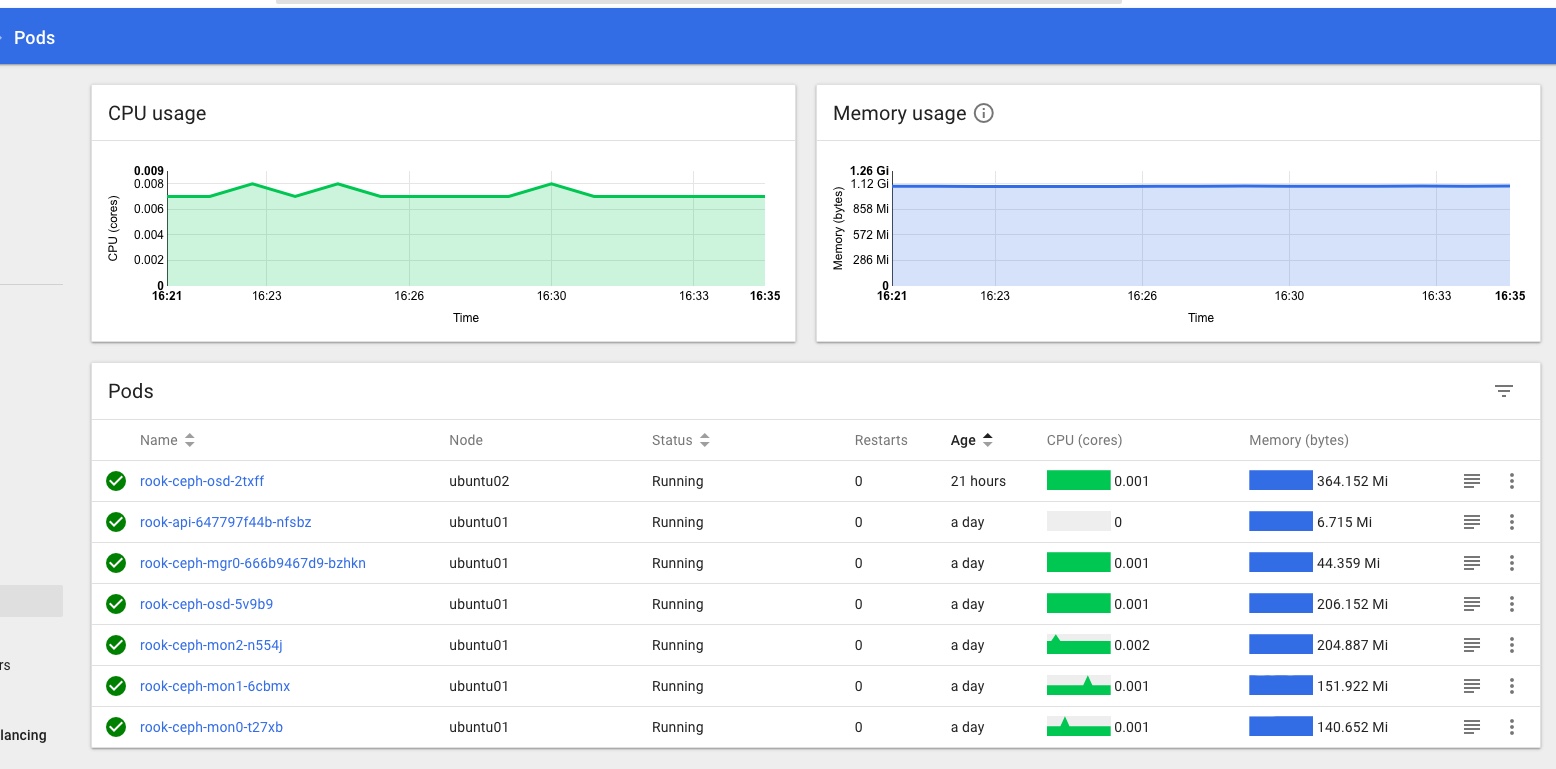
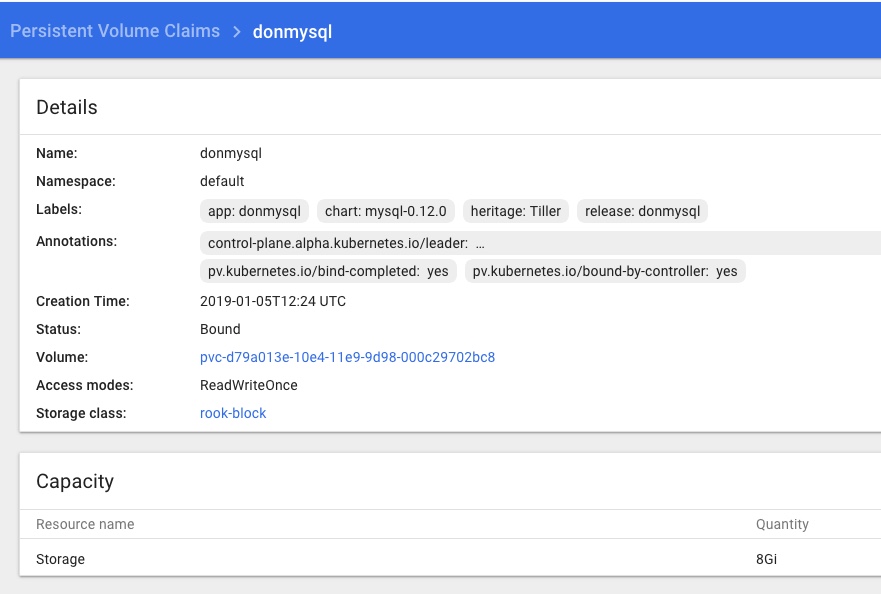
Checking the Dashboard I can see a Rook namespace with a number of Rook pods all looking green, and Persistent Volume Claims in the default namespace too:
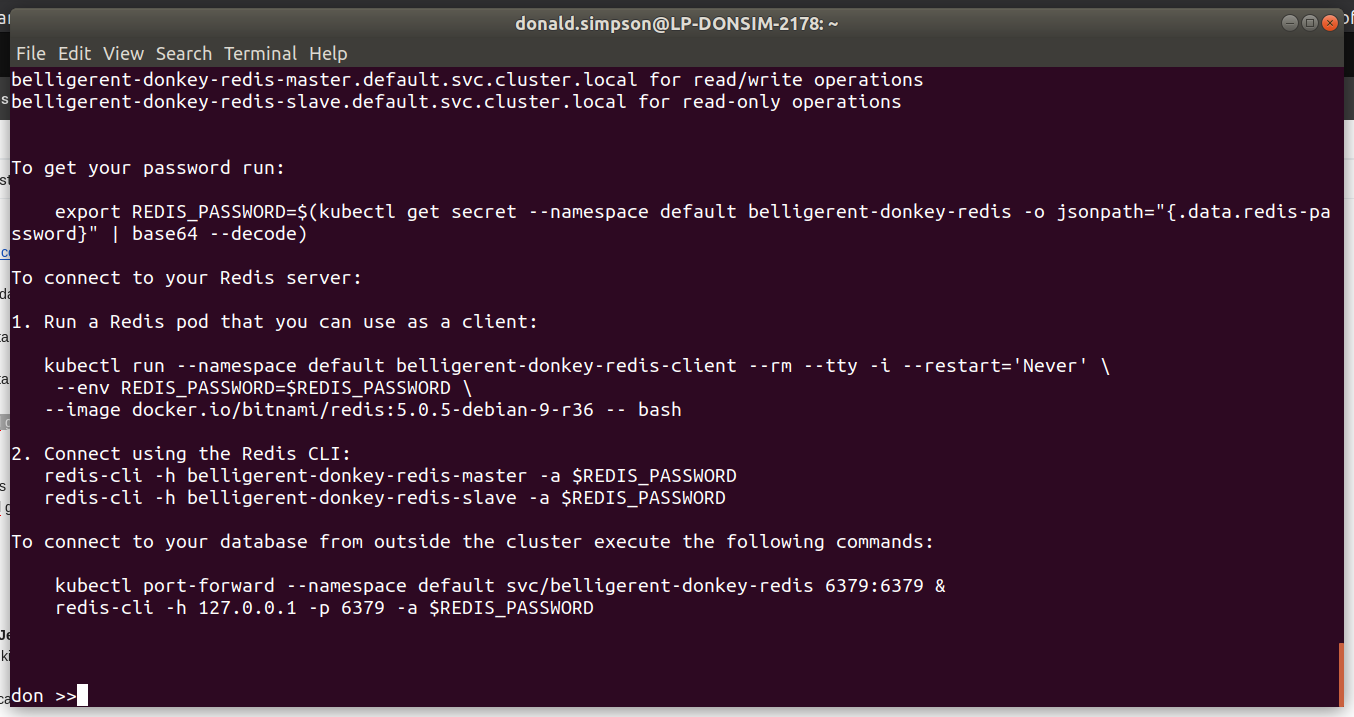
Test with an example – “helm install stable/mysql”, take 2…
To verify this I re ran the same Helm Chart for mysql, with no changes or overrides, to ensure that rook provisioning was working, that it was properly detected and used as the default storage class in the Cluster with no args/hints needed.
The output from running “helm install stable/mysql” includes this info:
MySQL can be accessed via port 3306 on the following DNS name from within your cluster: donmysql.default.svc.cluster.local
3. Connect using the mysql cli, then provide your password: $ mysql -h donmysql -p
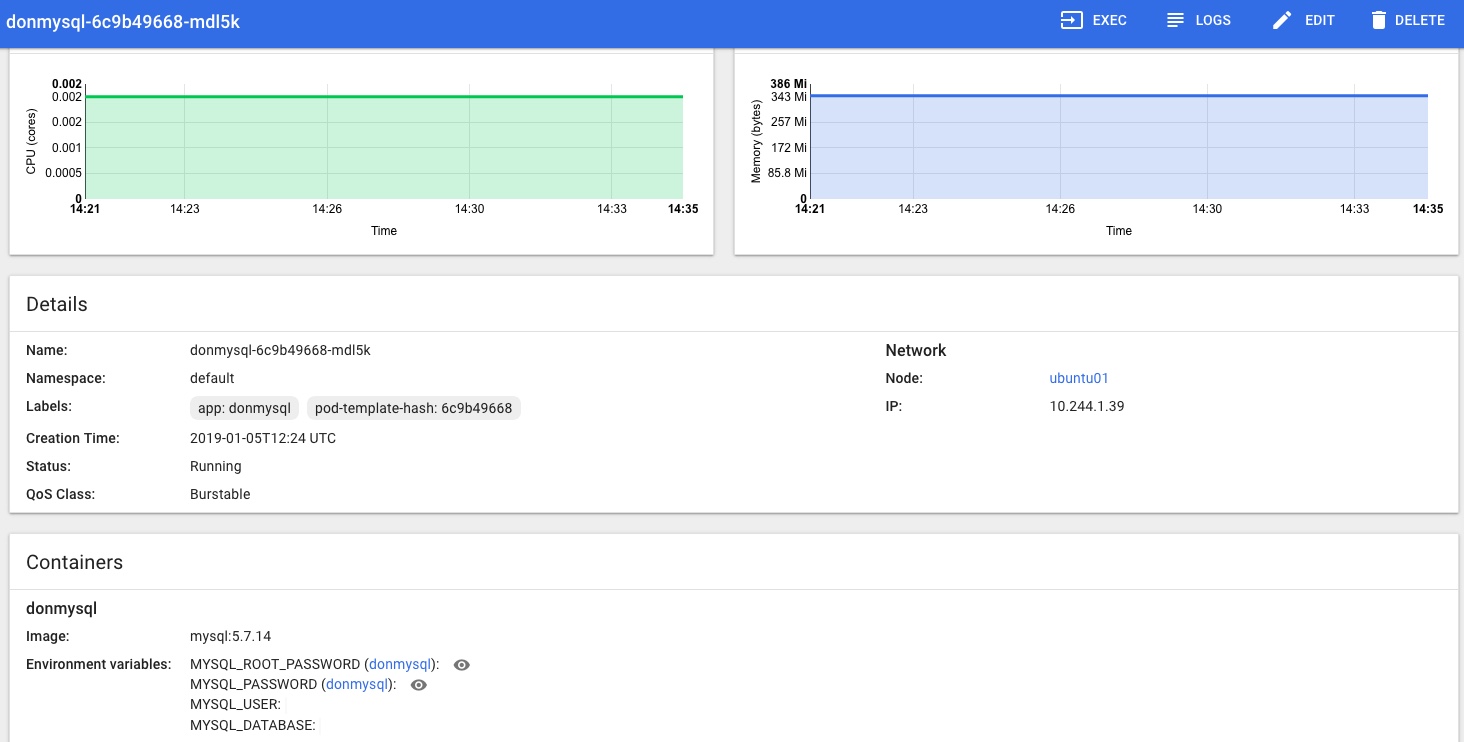
So I tried the above, opting to create an ubuntu client pod, installing mysql utils to that then connecting to the above MySQL instance with the root password like so:
ansible@umaster:~$  MYSQL_ROOT_PASSWORD=$(kubectl get secret --namespace default donmysql  -o jsonpath="{.data.mysql-root-password}" | base64 --decode; echo)
ansible@umaster:~$ echo $MYSQL_ROOT_PASSWORD
<THE ROOT PASSWORD WAS HERE>
ansible@umaster:~$ kubectl run -i --tty ubuntu --image=ubuntu:16.04 --restart=Never -- bash -il
If you don't see a command prompt, try pressing enter.
root@ubuntu:/#
root@ubuntu:/# apt-get update && apt-get install mysql-client -y
Get:1 http://archive.ubuntu.com/ubuntu xenial InRelease [247 kB]
Get:2 http://security.ubuntu.com/ubuntu xenial-security InRelease [107 kB]
<snip a load of boring apt stuff>
Setting up mysql-common (5.7.24-0ubuntu0.16.04.1) ...
update-alternatives: using /etc/mysql/my.cnf.fallback to provide /etc/mysql/my.cnf (my.cnf) in auto mode
Setting up mysql-client-5.7 (5.7.24-0ubuntu0.16.04.1) ...
Setting up mysql-client (5.7.24-0ubuntu0.16.04.1) ...
Processing triggers for libc-bin (2.23-0ubuntu10) ...
root@ubuntu:/# mysql -h donmysql -p
Enter password:
Welcome to the MySQL monitor.  Commands end with ; or \g.
Your MySQL connection id is 67
Server version: 5.7.14 MySQL Community Server (GPL)
<snip some more boring stuff>
mysql> show databases;
+--------------------+
| Database           |
+--------------------+
| information_schema |
| mysql              |
| performance_schema |
| sys                |
+--------------------+
4 rows in set (0.00 sec)
mysql> exit
Bye
root@ubuntu:/
In the Kubernetes Dashboard (loads more on that little adventure coming soon!) I can also see that the MySQL Pod is Running and looks happy, no more Pending or Init issues for me now:
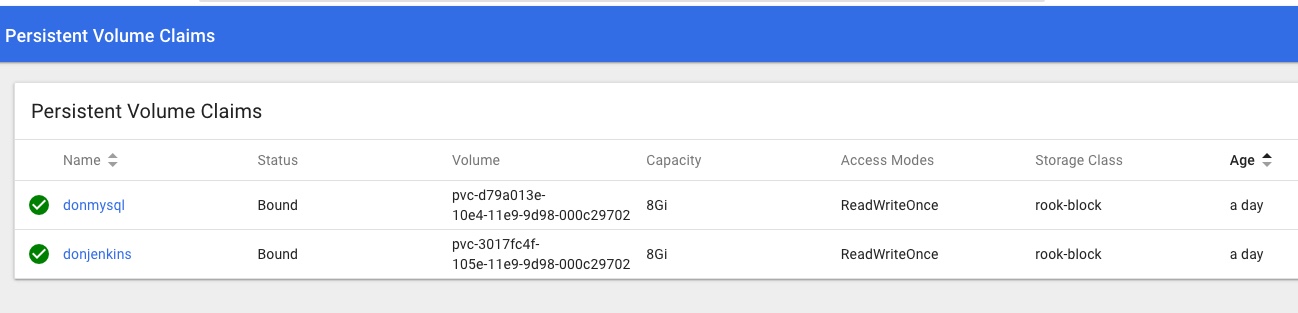
and that the Rook Persistent Volume Claims are present and looking healthy too:
Conclusion & next steps
That’s storage sorted, kind of – I’m not totally happy everything I did was needed, correct and repeatable yet, or that I know enough about this.
Rook.io looks very good and I’m happy it’s the best solution for my current needs, but I can see that I should have spent more time reading the documentation and thinking about prerequisites, yadda yadda. To be honest when it comes to storage I’m a bit of a Luddite – i just want it to be there and work as I’d expect it to, and I was keen to move on to the next steps….
I plan to scrub the k8s cluster shortly and run through this again from scratch to make sure I’ve got it clear enough to add to my provisioning pipeline process.
Next, a probably not-too-brief post on how I got Heapster stats working with an InfluxDB backend monitoring stats for both the Master and Nodes, installing a usable Kubernetes Dashboard, and getting that working with suitable access/permissions, aaaaand getting the k8s Dashbaord showing the CPU and Memory stats from Heapster as seen in the Dashboard pic of the pod statuses above…. phew!
My aim here is to create a Kubernetes environment on my home lab that allows me to play with k8s and related technologies, then quickly and easily rebuild the cluster and start over.
The focus here in on trying out new technologies and solutions and in automating processes, so in this particular context I am not at all bothered with security, High Availability, redundancy or any of the usual considerations.
Helm and Tiller
The quick start guide is very good: https://docs.helm.sh/using_helm/ and I used this as I went through the process of installing Helm, initializing Tiller and deploying it to my Kubernetes cluster, then deploying a first example Chart to the Cluster. The following are my notes from doing this, as I plan to repeat then automate the entire process and am bound to forget something later 🙂
Helm is the best way to find, share, and use software built for Kubernetes.
I have been following this project for a while and it looks to live up to the hype – there’s a rapidly growing and pretty mature collection of Helm Charts available here: https://github.com/helm/charts/tree/master/stable which as you can see covers an impressive amount of things you may want to use in your own Kubernetes cluster.
Get the Helm and Tiller binaries
This is as easy as described – for my architecture it meant simply
and extract and copy the 2 binaries (helm & tiller) to somewhere in your path
I usually do a quick sanity test or 2 – e.g. running “which helm” as a non-root user and maybe check “helm –help” and “helm version” all say something sensible too.
Install Tiller
Helm is the Client side app that directs Tiller, which is the Server side part. Just like steering a ship… and stretching the Kubernetes nautical metaphors to the max.
Tiller can be installed to your k8s Cluster simply by running “helm init“, which should produce output like the following:
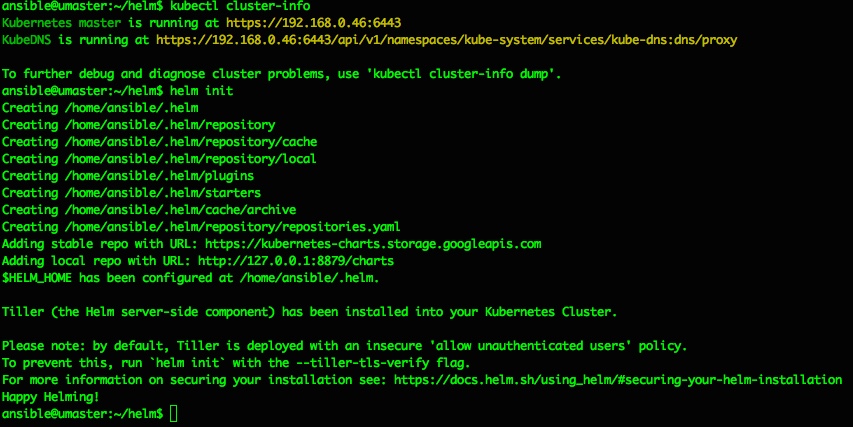
ansible@umaster:~/helm$ helm init
Creating /home/ansible/.helm
Creating /home/ansible/.helm/repository
Creating /home/ansible/.helm/repository/cache
Creating /home/ansible/.helm/repository/local
Creating /home/ansible/.helm/plugins
Creating /home/ansible/.helm/starters
Creating /home/ansible/.helm/cache/archive
Creating /home/ansible/.helm/repository/repositories.yaml
Adding stable repo with URL: https://kubernetes-charts.storage.googleapis.com
Adding local repo with URL: http://127.0.0.1:8879/charts
$HELM_HOME has been configured at /home/ansible/.helm.
Tiller (the Helm server-side component) has been installed into your Kubernetes Cluster
Please note: by default, Tiller is deployed with an insecure 'allow unauthenticated users' policy.
To prevent this, run `helm init` with the --tiller-tls-verify flag.
For more information on securing your installation see: https://docs.helm.sh/using_helm/#securing-your-helm-installation
Happy Helming
That should do it, and a quick check of running pods confirms we now have a tiller pod running inside the kubernetes cluster in the kube-system namespace:
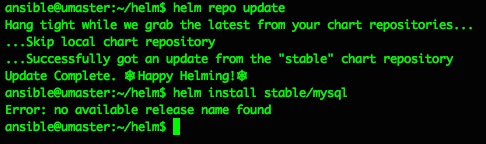
So far so nice and easy, and as per the docs the next steps are to do a repo update and a test chart install…
ansible@umaster:~/helm$ helm repo update
 Hang tight while we grab the latest from your chart repositories…
 …Skip local chart repository
 …Successfully got an update from the "stable" chart repository
 Update Complete. ⎈ Happy Helming!⎈
 ansible@umaster:~/helm$ helm install stable/mysql
 Error: no available release name found
 ansible@umaster:~/helm$
Doh. A quick google makes that “Error: no available release name found” look like a k8s/helm version conflict, but the fix is pretty easy and detailed here: https://github.com/helm/helm/issues/3055
So I did as suggested, creating a service account cluster role binding and patch to deploy them to the kube-system namespace:
helm lsansible@umaster:~/helm$ helm ls
NAME             REVISION UPDATED                  STATUS   CHART        APP VERSION NAMESPACEdunking-squirrel 1        Thu Jan  3 15:38:37 2019 DEPLOYED mysql-0.12.0 5.7.14      defaultansible@umaster:~/helm$
and all is groovy
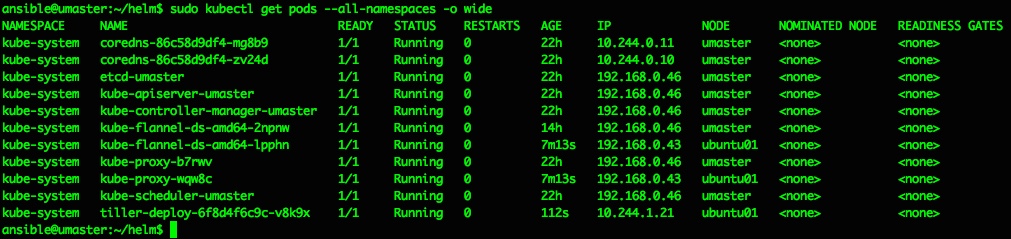
list pods with ansible@umaster:~/helm$ sudo kubectl get pods --all-namespaces -o wide
The MySQL pod is failing to start as it has persistent volume claims defined, and I’ve not set up default storage for that yet – that’s covered in the next step/post 🙂
If you want to use or delete that MySQL deployment all the details are in the rest of the getting started guide – for the above it would mean doing a ‘helm ls‘ then a ‘ helm delete <release-name> ‘ where <release-name> is ‘dunking-squirrel’ or whatever you have.
A little more on Helm
Just running out of the box Helm Charts is great, but obviously there’s a lot more you can do with Helm, from customising the existing Stable Charts to suit your needs, to writing and deploying your own Charts from scratch. I plan to expand on this in more detail later on, but will add and update some notes and examples here as I do:
For me and for now, I’m just happy that Helm, Tiller and Charts are working, and I can move on to automating these setup steps and some testing to my overall pipelines. And sorting out the persistent volumes too. After that’s all done I plan to start playing around with some of the stable (and perhaps not so stable) Helm charts.
As they said, this could well be “the best way to find, share, and use software built for Kubernetes” – it’s very slick!
This is Step 1 in my recent Kubernetes setup where I very quickly describe the process followed to build and configure the basic requirements for a simple Kubernetes cluster.
A quick summary should cover 99% of this, but I wanted to make sure I’d recorded my process/journey to get there – to cut a long story short, I ended up using this Ansible project:
on the 5 Ubuntu linux hosts I created by hand (the horror) on my VMWare ESX home lab server. I started off writing my own ansible playbook which did the job, then went looking for improvements and found the above fitted my needs perfectly.
Host prerequisites are in my rough notes below – simple things like ssh keys, passwwordless sudo from the ansible user, installing required tools like python, setting suitable ip addresses and adding the users you want to use. Also allocating suitable amounts of mem, cpu and disk – all of which are down to your preference, availability and expectations.
TASK [Add a new user named provision] ****************************************************************************************************************************************************************************************************************************************** fatal:
[ubuntu02]
: FAILED! => {"msg": "to use the 'ssh' connection type
with passwords, you must install the sshpass program"}
for each node/slave/hostsudo apt-get install -y sshpass
results in:root@umaster:~# kubeadm init [init] using Kubernetes version: v1.11.1 [preflight] running pre-flight checks I0730 15:17:50.330589 23504 kernel_validator.go:81] Validating kernel version I0730 15:17:50.330701 23504 kernel_validator.go:96] Validating kernel config
[WARNING SystemVerification]: docker version is greater than the most
recently validated version. Docker version: 17.12.1-ce. Max validated
version: 17.03 [preflight] Some fatal errors occurred: [ERROR Swap]: running with swap on is not supported. Please disable swap [preflight] If you know what you are doing, you can make a check non-fatal with `–ignore-preflight-errors=…` root@umaster:~# doswapoff -a then try again kubeadm init… wait for images to be pulled etc – takes a while
Your Kubernetes master has initialized successfully!
To start using your cluster, you need to run the following as a regular user: