Jenkins and Docker – Part 1 of 3

This post is the first in a series of 3 introducing the combined power of Jenkins, Docker, and the Jenkins DSL.

They should hopefully provide enough information to get to grips with both Docker and Jenkins – what they both do and how to use them – by showing some practical examples of them working together.

The first step, if you haven’t already, is to download and install Docker on your platform – the Docker website covers this in good detail for most platforms…

Docker for Mac

Docker for Windows

Docker for Linux

Once that’s done, you can try it out with the customary “Hello World” example…

I’m running Docker on an Ubuntu VM, but the commands and the results are the same regardless of platform – that’s one of the main Docker concepts.

You can then check which processes (docker containers) are running using the “docker ps” command – in my example you can see that there’s one Jenkins image running. If you run “docker ps -a” you will see all containers (including stopped ones, of which I have a few on this host):

and you can check your Docker version with:

root@ubuntud:~# docker --version
Docker version 1.13.0, build 49bf474

Now that the basic setup is done, we can move on to something a little more interesting – downloading and running a “Dockerised” Jenkins container.

I’m going to use my own Dockerised Jenkins Image, and there will be more detail on that in the next post – you’re welcome to try it out too, just run this command in your terminal:

docker run -d -p 8080:8080 donaldsimpson/dockerjenkins

if you don’t happen to have my docker image cached locally (like I do) then docker will automatically download it for you from Docker Hub then run it:

That command did a quite few important things, here’s a quick explanation of them all:

docker run -d

tells docker that we want to run the container in the background so that we can carry on and do other things while it runs. The alternative is -it, for an interactive/foreground session.

docker run -d -p 8080:8080

The -p 8080:8080 tells docker to map port 8080 on the local host to port 8080 in the running container. This means that when we visit localhost:8080 the request will be passed through to the container.

docker run -d -p 8080:8080 donaldsimpson/dockerjenkins

and finally, we have the namespace and name of the Docker image we want to run – my “donaldsimpson/dockerjenkins” one – more on this later!

You can now visit port 8080 on your Docker host and see that Jenkins is up and running….


That’s Jenkins up and running and being happily served from the Docker container that was just pulled from Docker Hub – how easy was that?!

And the best thing is, it’s entirely and reliably repeatable, it’s guaranteed to work the same on all platforms that can run Docker, and you can quickly and easily update, delete, replace, change or share it with others! Ok, that’s more than one thing, but the point is that there’s a lot to like here 🙂

That’s it for this post – in the next one we will look in to the various elements that came together to make this work – the code and configuration files in my Git repo, the automated build process on Docker Hub that builds and updates the Docker Image, and how the two are related.

Tunneling out of Carrier Grade Nat (CGNAT) with SSH and AWS

Update: there’s a new & improved solution here too.
Intro

After switching to a 4G broadband provider, who shall (pretty much) remain nameless, I discovered they were using Carrier-Grade  NAT (aka CGNAT) on me.

There are more details on that here and here but in short, the ISP is ‘saving’ IPv4 addresses by sharing them out amongst several users and NAT’ing their connections – in much the same way as you do at home, when you port forward multiple devices using one external IP address: my home network is just one ‘device’ in a pool of their users, who are all sharing the same external IP address.

The impact of this for me is that I can no longer NAT my internal network services, as I have been given a shared pubic-facing IPv4 address. This approach may be practical for a bunch of mobile phone users wanting to check Twitter and Facebook, but it sucks big time for gamers or anyone else wanting to connect things from their home network to the internet. So, rather than having “Everything Everywhere” through my very expensive new 4G connection – with 12 months contract – it turns out I get “not much to anywhere“.

The Aim

Point being; I would like to be able to check my internal servers and websites when I’m away – especially my ZoneMinder CCTV setup – but my home broadband no longer has its own internet address. So an alternative solution had to be found…

The “TL; DR” summary

I basically use 2 servers, the one at home (unhelpfully now stuck behind my ISPs CGNAT) and one in the Amazon Cloud (my public facing AWS web server with DNS), and create a reverse SSH Tunnel between them. Plus a couple of essential tweaks you wont find out about if you don’t read any further 🙂

The Steps
Step 1 – create the reverse SSH tunnel:

This is initiated on the internal/home server, and connects outwards to the AWS host on the internet, like so.

ssh -N -R 8888:localhost:80 -i /home/don/DonKey.pem awsuser@ec2-xx-xx-xx-xx.compute-x.amazonaws.com

Here is an explanation of each part of this command:

-N (from the SSH man page) “Do not execute a remote command.  This is useful for just forwarding ports.”

-R (from the SSH man page)  “Specifies that connections to the given TCP port or Unix socket  on the remote (server) host are to be forwarded to the given host and port, or Unix socket, on the local side.”

8888:localhost:80 – means, create the reverse tunnel from localhost port 80 (my ZoneMinder web app) to port 8888 on the destination host. This doesn’t look right to me, but it’s what’s needed for a reverse tunnel

the -i and everything after it is just me connecting to my AWS host as my user with an identity file. YMMV, whatever you nornally do should be fine.

When you run this command you should not see any issues or warnings. You need to leave it running using whatever method you like – personally I like screen for this kind of thing, and will also be setting up Jenkins jobs later (below).

Step 2 – check on the AWS host

With that SSH command still running on your local server you should now be able to connect to the web app from your remote AWS Web Server, by reading from port 8888 with curl or wget.

This is a worthwhile check to perform at this point, before moving on to the next 2 steps – for example:

don@MyAWSHost:~$ wget -q -O- localhost:8888/zm | grep -i ZoneMinder
      <h1>ZoneMinder Login</h1>
don@MyAWSHost:~$

This shows that port 8888 on my AWS server is currently connected to the ZoneMinder application that’s running on port 80 of my home web server. A good sign.

Step 3 – configure AWS Security & Ports

Progress is being made, but in order to be able to hit that port with a browser and have things work as I’d like, I still need to configure AWS to allow incomming connections to the newly chosen port 8888.

This is done through the Amazon EC2 Management Console using the left hand menu item “Network & Security” then “Security Groups”:

awsmenuThis should load your current Security Groups, which you can click on to Edit. You may have a few to check.

Now select Add and configure a new Inbound rule something like so:

awsinboundruleIt’s the “Custom TCP Rule” second from the bottom, with port 8888 and “Anywhere” and “0.0.0.0/0” as the source in my picture. Don’t go for the HTTP option – unless you’re sure that’s what you want 🙂

Step 4 – configure SSH on AWS host

At this point I thought I was done… but it didn’t work and I couldn’t immediately see why, as the wget check was all good.

Some head scratching and checking of firewalls later, I realised it was most likely to be permissions on the port I was tunneling – it’s not very likely to be exposed and world readable by default, is it? Doh.

After a quick google I found a site that explained the changes I needed to make to my sshd_config file, so:

vim /etc/ssh/sshd_config

and add a new line that says:

GatewayPorts yes

to that file, checking that there’s no existing reference to GatewayPorts – edit this file carefully and at your own risk.

As I understand it – which may best be described as ‘loosely’ – the reason this worked when I tested with wget earlier is because I was connecting to the loopback interface; this change to sshd binds the port to all interfaces. See the detailed answer on this post for further detail, including ways to limit this to specific users.

Once that’s done, restart sshd with

service ssh restart

and you should now be able to connect by pointing a web browser at port 8888 (or whatever you set) of your AWS web server and see your app responding from the other end:

zmlogin
Step 5 – automate it with Jenkins

The final step for me is to wrap this (the ssh tunnel creation part) up in a Jenkins job running on my home server.

This is useful for a number of reasons, such as avoiding and resetting defunct/stale connections and enabling scheduling – i.e. I can have the port forwarded when I want it, and have it shutdown during the hours I don’t.

CCTV with Tenvis cameras and ZoneMinder

This post details the processes I went through to create my own DIY home CCTV system.

Topics covered include:
1. Hardware – some cheap but impressive Tenvis TH692 720p IP cameras, and some Power over Ethernet (PoE) injectors and extractors to go with them
2. Camera setup – how to set them up, connect to them, and a quick summary of basic functions
3. Clients – info on a few different ways to attach to and use the cameras – VLC, Kodi/XBMC, RTSP and the built-in app and web interfaces
4. Jenkins – using Jenkins jobs to capture and record from Tenvis cameras
5. ZoneMinder – installation, OVA and manual install, settings used
6. Summary, links and general info

1. Hardware
On recommendation from a friend, the cameras I went for are these:
Tenvis TH692’s
“720P HD Outdoor Network Wireless CCTV IP Camera with 15M Night Vision”

these cameras are currently available on Amazon for only £27 each!

The cameras can happily run over WiFi but as they will still need a power connection, I have opted to run them over Ethernet and to send the power over the CAT6 cable too – this way there’s still only 1 cable required, and I get a faster network connection too.

To do this I have used these:
AKORD® POE Passive Power Over Ethernet Adapter Injector Extractor Kit

These clever little beasties work with the power adapter that comes with the Tenvis TH692’s, and come complete with both a PoE Injector and Extractor, for only £3.99 – another mega-bargain! I haven’t tested them for outdoor use in bad weather yet, but suspect they may require some protection from the elements, which is fair enough.

2. Camera Setup
Connecting the cameras to your home network and getting them up and running is pretty easy. You need to connect them wired initially and use DHCP to assign an address. With that done, you can then use the supplied software to find, connect to and configure the cameras. After that’s complete, you can connect them to your WiFi, change the name/label for the camera, set up users and passwords, set up Email and FTP alerts and settings and so on.

3. Clients
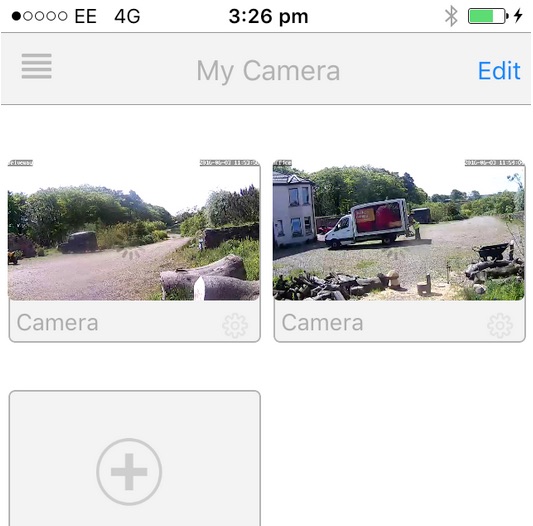
I found the supplied software sufficient for the initial setup, and the phone app (search for “NEW Tenvis” in the App store) works very well, allowing you to monitor your camera(s) from anywhere in the world assuming you’ve got an internet connection at both ends. Here’s a picture from my iPhone:

iphone_tenvis


The web interface relies on browser plugins and didn’t work on my Mac under Chrome, Firefox or Safari – it wanted an out dated QuickTime plugin which I couldn’t get working, though I confess I didn’t try too hard. It worked ok on my Windows VM, but I don’t want to use that interface or that OS. Luckily there are plenty of alternative options though, as these cameras use RTSP…

The Real Time Streaming Protocol (RTSP) is a network control protocol designed for use in entertainment and communications systems to control streaming media servers. The protocol is used for establishing and controlling media sessions between end points.

[ Source: Real Time Streaming Protocol – Wikipedia, the free encyclopedia ]

This opens up several options for connecting to the cameras, and means that you don’t need to rely on the supplied software and interfaces. For me, this is what makes these cameras so good.

Here are the solutions I use, though there are many more available…

VLCVideoLAN – as you’ll probably know, this great free and open source cross-platform multimedia player plays pretty much anything, and on pretty much every platform.  Not surprisingly, I found I could point this player at the cameras RTSP feed, enabling me to view the video content from all devices that VLC runs on.

I use this approach on my Mac laptop mostly, and it’s as easy as creating a small config file for each camera feed then clicking on it to open the live feed. The files can be saved with “.m3u” extensions, as long as you’ve set that file type to be handled by VLC.

For example, here are the contents of the “cctv_driveway.m3u” file I currently have on my OSX Desktop, and that I click to connect to that feed:

#EXTM3U
#EXTINF:0, Driveway CCTV
rtsp://USERNAME:YOURPASSWORD@192.168.0.151:554/1

that’s it – just 3 lines.

Line 1, “#EXTM3U” is the file header which must be the first line of the file – like a Bash “shebang”.

Line 2, “#EXTINF:0, Driveway CCTV” contains the track information (just a zero here) and the title of the feed. This is displayed as “Driveway CCTV” in the VLC Window title, which is a handy feature.

Line 3, ” rtsp://USERNAME:YOURPASSWORD@192.168.0.151:554/1″ is simply the RTSP URL for the camera feed you want to stream from.

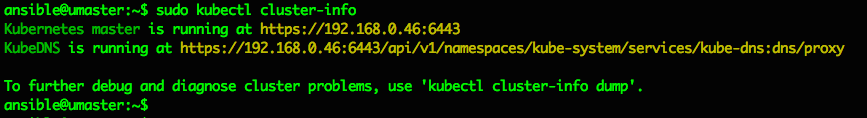
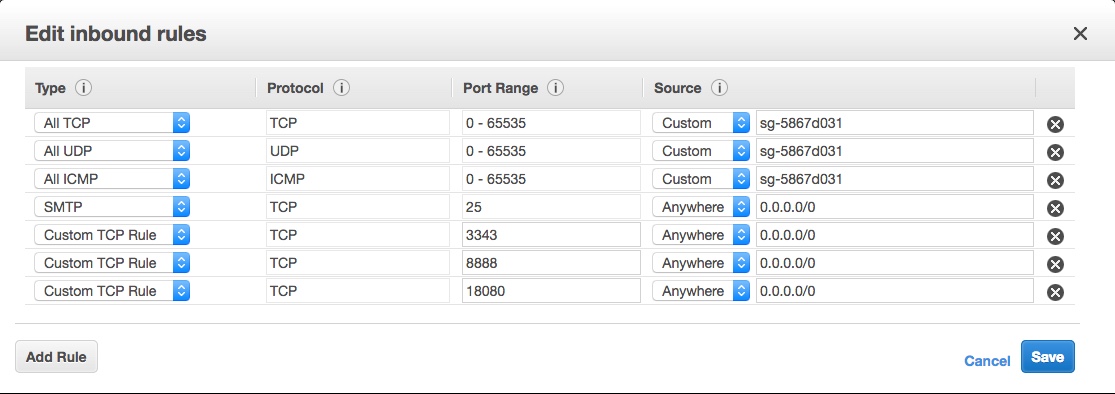
The RTSP URL contains the protocol (rtsp://), then user and password details, then the address of the camera (192.168.0.151 in this case), which is followed by the port the feed is served on: 554. This port can be seen in the camera config during the initial setup, but if you are unsure you can run a simple nmap scan against your camera like this:

nmap

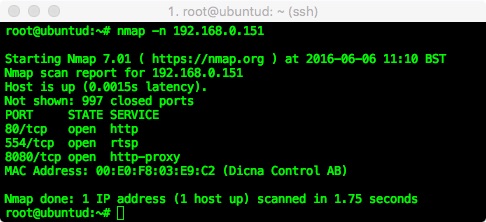
Here we can see port 80 and 8080 are open for the web interfaces (viewing and configuration respectively), and 554 which is the standard RTSP port.

This useful web page can also generate the correct RTSP URL for many popular cameras:
Tenvis IP camera URL

The final part of the URL is the endpoint to connect to on the remote camera/host – you can see in the config above that I am connecting to “/1” at the very end of the third line in my M3U file; this is the location for the full 720 HD feed for these particualr cameras. There are also lower resolution feeds available which can also be useful to know about, especially when monitoring multiple cameras or connecting remotely (e.g. with lower bandwidth).

For these Tenvis cameras, changing to the “/12” endpoint will fetch the lower quality feed, and there are other options inbetween that you can use to suit your requirements. These end points can also be modified further through the Tenvis settings app (which is running on port 8080).

Kodi (formerly XBMC) – from a quick google it looks like there are several ways in which Kodi can be set up to consume and view RTSP feeds. The simple option I’ve gone for is, again, to create a tiny config file containing the settings for each camera, and to place these files on my NAS storage. This means that watching a camera live on my TV is as simple as selecting the corresponding file in Kodi, and it will launch the stream just like you had clicked on a movie.

The files I use have the “.strm” extension and simply contain the full URL for the RTSP stream:

rtsp://user:password@192.168.0.156:554/1

Using this simple approach, I can click on files like “cctv_driveway.strm” in Kodi to launch the various streams. Because I only ever use this on my TV or Projector, I go for the full 720 HD feed in these files via the “/1” end points.

4. Jenkins

Disclaimer: I have a tendency to use Jenkins to automate everything. 
Sometimes this extends to things that don't really need it, just to see if/how it can be done. 
This section and idea is driven from that personal tendency/obsession.
The ZoneMinder solution (described below) is by far the more sensible option for most cases :-)

After setting up some cameras and connecting to them, I then wanted to record and archive the footage. The provided software enables you to set up FTP archiving and email alerts, but I wanted to do something more flexible, that would allow me to easily change & tune the retention, housekeeping and archiving. The approach I used is slightly unusual, but it’s very simple, effective and flexible, allowing me to easily tweak things to suit my requirements.

To use Jenkins for recording and managing my CCTV Camera feeds, I went through the following high-level steps:

1. Create a new ‘Freestyle’ Jenkins job, set to run on my Ubuntu host

2. Add an ‘Execute shell’ step. To this I added the following shell commands:

export MY_DATE=`date +"%Y%m%d%H%M%S"`
rm -f *.ts
/usr/bin/vlc -vvv rtsp://USER:PASSWORD@192.168.0.151:554/12 --sout=file/ts:/home/don/cctv/recording-${MY_DATE}.ts -I dummy --stop-time=1800 vlc://quit
mv /home/don/cctv/recording-${MY_DATE}.ts .

This is cleaning up any previous/old files then capturing 30 minutes of output from the camera via VLC, writing the data stream to a file. After 30 minites VLC quits, and I move the newly captured file to the current working directory with a timestamp in the filename.

3. Archive files
After the shell command above is complete, I have configured the Jenkins job to archive the captured file along with this job run. This makes it nice and easy to browse through previous (date & timestamped) jobs and simply click to view the corresponding video capture from that time.

4. Create a Jenkins job loop
At the end of every 30 minute run, I set the “Build other projects” option for this build to trigger another run of this same job, creating an infinite loop of 30 minute runs. There’s a tiny pause between the job ending and the next build starting, but it’s only a second or two at most, which I can live with.

Once I was happy that the data was being captured and archived ok, I was then able to configure and tune the retention through Jenkins – there are loads of Jenkins built-in options that enable you to do things like ‘keep the last x builds’, or ‘keep builds for n days’, or whatever you would like. You can also mark certain builds as ‘keep forever’ if you wanted to preserve anything interesting.

This process works well for me, and the CPU and memory usage created from having 3 of these jobs running constantly is, to my surprise, next to nothing; thanks to the impressive efficiency of VLC.

The disk usage is the main issue here; with this approach I’m constantly recording, and you can fill up a LOT of disk by writing several HD video streams to disk! One plan I was considering is to reencode video footage at a lesser bitrate (to reduce the file size) as they get older (using another Jenkins job), but I think that may be over-kill: for me, 2 weeks retention with the ability to archive/keep anything I want to quite easily is more than enough really.
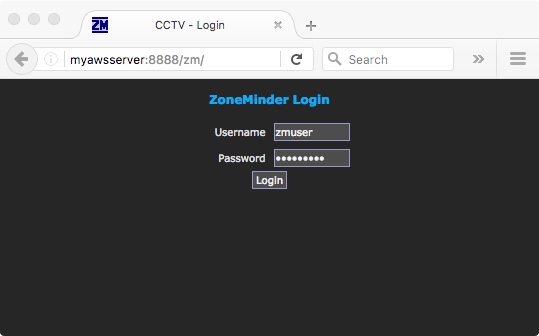
5. ZoneMinder
Nearly every search I did when looking for software to manage my new CCTV cameras led me to the same place – https://zoneminder.com/

Like VLC, Kodi and Jenkins, ZoneMinder is a fantastic bit of software; it’s free, there’s loads of documentation, and it’s extremely configurable. For managing CCTV video recordings I’ve not yet seen anything that compares to it, even if you are willing to spend serious money.

Initially I tried installing everything in a ready-made VM Template – an OVA file – I think it was this one:
http://blog.waldrondigital.com/2012/09/23/zoneminder-virtual-machine-appliance-for-vmware-esxi-workstation-fusion/

This is a great solution and can be a real timesaver to get you up and running, especially if you don’t have a VM with Ubuntu and a LAMP stack to hand. It took something like 2 minutes to deploy this to my ESX server, and it was working a few minutes after that. The software was out of date with the VM I downloaded and deployed, but there are clear and easy instructions on that page explaining how to update to the latest versions.

I decided I didn’t want the overhead of running another VM just for this one function, and as I already have a few running I looked in to installing ZoneMinder from scratch on an existing Ubuntu VM, which is actually pretty easy as detailed here:

http://zoneminder.readthedocs.io/en/stable/installationguide/ubuntu.html

This went quite smoothly, I had to do a couple of MySQL tweaks but it took about 20 minutes from start to finish, and I ended up with ZoneMinder running on an existing Ubuntu host which will mean less update and maintenance grief for me (as oppposed to running a separate and dedicated VM just for ZoneMinder).

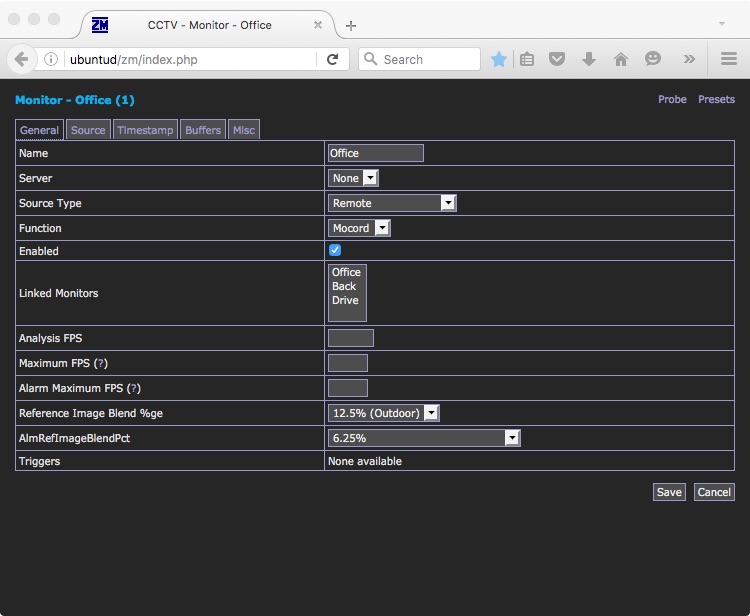
It took a little experimenting to get the Tenvis TH692 cameras working in ZoneMinder, but nothing complex – here’s what I used for the “General” settings with the Tenvis TH692 cameras:

ZoneMinderGeneral

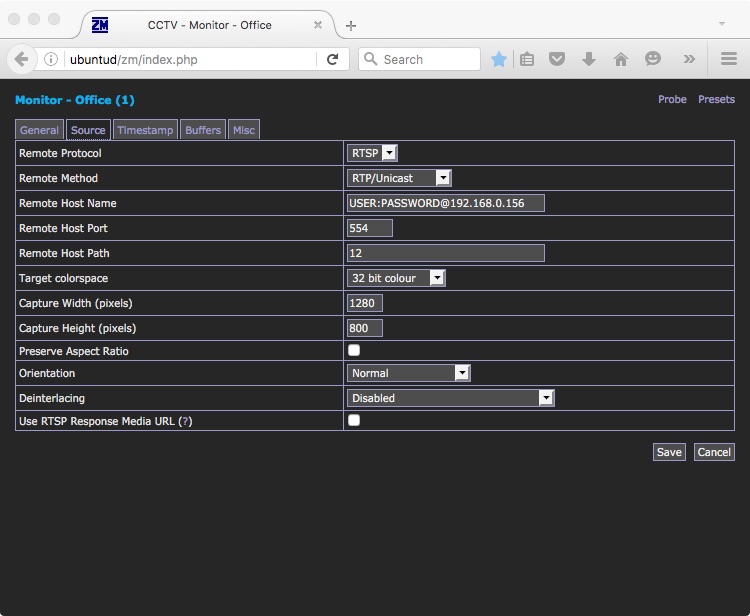
and here are the “Source” settings for the RTSP Stream, using the same basic details we’ve used to set up VLC, Kodi etc previously:

ZoneMinderSource

Once that’s done, you can tweak the settings to your liking. You can have ZoneMinder record events as they happen and archive them, and/or use it to act as a nicer web interface to your cameras. You get the option to cycle through your different cameras automatically, or you can watch several feeds on one page – the options and possibilities are great.

One of the main points of using ZoneMinder for me is that it serves the camera feeds to the browser without the need for plugins like QuickTime, and it works well on all operating systems I’ve tried – and all devices.

Note that it’s advisable to set up a ZoneMinder Filter to archive your old footage – preferably before your disks get full!

This link explains how to do this in a variety of ways:

http://zoneminder.readthedocs.io/en/latest/faq.html

After some inital experimenting I have gone for both a “Purge after x days” filter and a “Purge when disk over 50% full” – both types of Filter are detailed in that FAQ.

Summary

I can now connect to all of my cameras from all of my devices – my Nexus tablet, mobile phone, Mac and Linux computers, television, projector – quickly and easily, and from anywhere. I can also monitor, record, replay and generate alerts whenever they are required, and tune each camera to suit my needs. I think these cameras are a total bargain, the HD picture quality is excellent, and the night time IR is good too. If you are happy to set up your own connectivity and monitoring solutions like ZoneMinder (or Jenkins) you can quite easily create a sophisicated system for very little cost, and it’s good fun too!


Extending Jenkins book

My new book, Extending Jenkins by Donald Simpson, has been published!

Extending Jenkins

There is a free sample chapter available here:
Chapter 8 – Testing and Debugging Jenkins Plugins

You can buy the full book in either electronic or paperback format direct from the publishers or through Amazon here in the UK or Amazon in the US

About This Book

  • Find out how to interact with Jenkins from within Eclipse, NetBeans, and IntelliJ IDEA
  • Develop custom solutions that act upon Jenkins information in real time
  • A step-by-step, practical guide to help you learn about extension points in existing plugins and how to build your own plugin

Who This Book Is For

This book is aimed primarily at developers and administrators who are interested in taking their interaction and usage of Jenkins to the next level.

The book assumes you have a working knowledge of Jenkins and programming in general, and an interest in learning about the different approaches to customizing and extending Jenkins so it fits your requirements and your environment perfectly.

Table of Contents

1: Preparatory Steps
2: Automating the Jenkins UI
3: Jenkins and the IDE
4: The API and the CLI
5: Extension Points
6: Developing Your Own Jenkins Plugin
7: Extending Jenkins Plugins
8: Testing and Debugging Jenkins Plugins
9: Putting Things Together

What You Will Learn

  • Retrieve and act upon Jenkins information in real time
  • Find out how to interact with Jenkins through a variety of IDEs
  • Develop your own Form and Input validation and customization
  • Explore how Extension points work, and develop your own Jenkins plugin
  • See how to use the Jenkins API and command-line interface
  • Get to know how to remotely update your Jenkins configuration
  • Design and develop your own Information Radiator
  • Discover how Jenkins customization can help improve quality and reduce costs

In Detail

Jenkins CI is the leading open source continuous integration server. It is written in Java and has a wealth of plugins to support the building and testing of virtually any project. Jenkins supports multiple Software Configuration Management tools such as Git, Subversion, and Mercurial.

This book explores and explains the many extension points and customizations that Jenkins offers its users, and teaches you how to develop your own Jenkins extensions and plugins.

First, you will learn how to adapt Jenkins and leverage its abilities to empower DevOps, Continuous Integration, Continuous Deployment, and Agile projects. Next, you will find out how to reduce the cost of modern software development, increase the quality of deliveries, and thereby reduce the time to market. We will also teach you how to create your own custom plugins using Extension points.

Finally, we will show you how to combine everything you learned over the course of the book into one real-world scenario.

Beginning Docker video course

Blog updates have been scarce recently as I have been busy working on a couple of publications… the first of which has just been released…

https://www.linuxjournal.com/node/1338951

This is a hands-on video course packed with practical examples to get you started with Docker.

Here is the course overview video:

And here is a free sample video from Section 2, “Docker Basics” where we take a look at running containers and the 3 different types of “containerized” commands:

and this final sample video is taken from Section 5 – “Running a Web Application with Docker“.

In this clip we build our own web application using Python, pip and Redis, which we will then “dockerize” and ship to “production”:

About This Video

  • Master Docker commands by creating and publishing a sample web application
  • Build and manage your own custom Docker Containers to set up data sources, filesystems, and networking
  • Build your own personal Heroku PaaS with Dokku

Who This Video Is For

If you’re a developer who wants to learn about Docker, a powerful tool to manage your applications effectively on various platforms, this course is perfect for you! It assumes basic knowledge of Linux but supplies everything you need to know to get your own Docker environment up and running.

What You Will Learn

  • Build new Docker containers and find and manage existing ones
  • Use the Docker Index, and create your own private one by using containers
  • Discover ways to automate Docker, and harness the power of containers!
  • Build your own Docker powered mini-Heroku Paas with Dokku
  • Set up Docker on your environment based on your application’s custom requirements
  • Master Docker patterns and enhancements using the Ambassador and Minimal containers

In Detail

One of the major challenges while creating an application is adapting your application to run smoothly on all of the plethora of operating systems available. Docker is an extremely efficient technology that allows you to wrap all your code along with its supporting files into a single bundle; it also guarantees that your application will behave in the same way on any host powered by Docker. You can also easily reuse existing Docker containers or create and publish your own. Unlike Virtual Machines, Docker containers are lightweight and more efficient.

Beginning Docker starts with the fundamentals of Docker—explaining how it works, how to set it up, and how to get started on leveraging the benefits of this technology. The course goes on to cover more advanced features and shows you how to create and share your own Docker images.

You will learn how to install Docker on your own machine, then how to manage it effectively, and then progress to creating and publishing your very own application. You will then learn a bit more about Docker Containers; built-in features and commands such as volumes, mounts, ports, and linking and constraining containers; before diving into running a web application.

Docker has functionality such as the Docker web API to handle complex automation processes which will be explained in detail. You will also learn how to use the Docker Hub to fetch and share containers, before running through the creation of your own Docker powered mini-Heroku

Beginning Docker covers everything required to get you up and running with Docker, with detailed real-world examples and helpful tips to make sure you get the most from it.

Style and Approach

An easy-to-follow and structured video tutorial with practical examples of Docker to help you get to grips with each and every aspect.

The course will take you on a journey from the basics to the advanced application of Docker containers, and includes several real-world scenarios to learn from.

Cheers,

Don

Jenkins and Docker – Part One

This post lists the steps taken to get started with Docker – the basic install and getting a Docker container up and running on Ubuntu.

There’s nothing new or unusual in this section, but it forms the background of the next post(s) where I plan to go in to detail on different approaches to using Docker with Jenkins (and vice versa).

If you’re unfamiliar with Docker here is a good introduction:

and you can try Docker out easily on the docker site: https://www.docker.com/tryit/


In my case the Ubuntu is a pretty ordinary “ubuntu 14.04.1 LTS (GNU/Linux 3.13.0-35-generic x86_64)” running as a guest VM on my Development VM Ware ESXi Server.

Installing docker on Ubuntu is trivial – here are the commands I found via a quick google, there were no issues…

apt-get -y install docker.io

(FYI it’s called docker.io as there’s a previous/existing package with the name docker)

fix path issues:

ln -sf /usr/bin/docker.io /usr/local/bin/docker
sed -i '$acomplete -F _docker docker' /etc/bash_completion.d/docker.io

have docker start up at boot:

update-rc.d docker.io defaults

and that’s that done – all very simple, quick and straightforward, now it’s time to pull down an Ubuntu image…

docker pull ubuntu

once that’s done, you are ready to run a command (bash in the case of this quick test I found suggested elsewhere) in a docker container like so:

docker run -i -t ubuntu /bin/bash

(-i attaches stdin & stdout and -t allocates a terminal)

That’s it for this post – the next will look at dynamic Jenkins Slave provisioning using Docker Containers, Jenkins plugins for Docker and ways to use Docker for a variety of Jenkins build, deployment and test tasks for Continuous Integration, Continuous Build and DevOps purposes.

Cheers,

Don


Extracting data from Jenkins

In Part I,  Information Radiators, I covered what they are, what the main benefits are, and the approach I usually use to set them up. This post goes in to more technical detail on how I extract this data from Jenkins.

My usual setup/architecture for Jenkins Information Radiators goes something along these lines:

  • TV screens running Mozilla Firefox or Google Chrome in Kiosk Mode, and Tab Mix Plus set up to rotate tabs (if required)
  • JSP Pages served via Tomcat on Linux server (which also runs the data extracting script described below)
  • MySQL database on Linux server – contains tables with data pulled from Jenkins and other sources, and the config data too (which URL’s to monitor)

And you’ll need some Jenkins instances/jobs to monitor too, obviously 🙂

The Jenkins XML API is very useful for automating tasks like this – if you simply append “/api/xml” to a
Jenkins job URL, it will serve up an XML version – note there is also a JSON API and a CLI and plenty of other options, but I’m using what suits me.

The Jenkins XML API

For example, if you go to one of your Jenkins jobs and add /api/xml like this:

“http://yourjenkinsserver:8080/job/yourjobname/api/xml

you should get back some XML, possibly roughly like this example:

<?xml version="1.0"?>
<freeStyleBuild>
 <action>
 <parameter>
 <name>LOWER_ENV</name>
 <value>dev</value>
 </parameter>
 </action>
 <action>
 <cause>
 <shortDescription>Started by timer</shortDescription>
 </cause>
 </action>
 <building>false</building>
 <duration>61886</duration>
 <fullDisplayName>MyJob #580</fullDisplayName>
 <id>2014-04-01_10-01-50</id>
 <keepLog>false</keepLog>
 <number>580</number>
 <result>SUCCESS</result>
 <timestamp>1396342910088</timestamp>
 <url>http://jenkinsserver:8080/view/MyView/job/MyJob/580/</url>
 <builtOn/>
 <changeSet/>
</freeStyleBuild>

That XML contains loads of very useful information inside handy XML tag descriptions – you just need a way to get at that data and then you can present it as you like…

XPAth queries and the Jenkins XML API

so to automate that, I used to extend that approach a to query Jenkins via the XML API using XPAth queries to bring back just the data I actually wanted, quite like querying a database.

For example, wget’ing this URL would return just the current value of the <building> tag in the above XML:

http://yourjenkinsserver:8080/job/yourjobname/api/xml?xpath=//building/text()

e.g. “true” or “false” – this was very useful and easy to do, but the functionality was removed/disabled in recent versions of Jenkins for security reasons, meaning that my processes that used it needed rewritten 🙁

Extracting the data – Plan B…

So, here’s the new solution I went for – the real scripts/methods do some error handling and cleaning up etc but I’m just highlighting the main functions and the high level logic behind each of them here;

get_url’s method:

query a table in MySQL that contains a list of the job names and URL’s to monitor
for each $JOB_NAME found, it calls the get_file method, passing that the URL as a parameter.

get_file method:

this takes a URL param, and uses curl to fetch and save the XML data from that URL to a temporary file (“xmlfile”):

curl -sL "$1" | xmllint --format - > xmlfile

Note I’m using “xmllint –format” there to nicely format the XML data, which makes processing it later much easier.

get_data method:

this first calls “get_if_building” (see below) to see if the job is currently running or not, then it does:

TRUE_VAR="true"
 if [[ "$IS_BUILDING" == "$TRUE_VAR" ]]; then
 RESULT_TEXT="building..."
 else
 RESULT_TEXT=`grep "result>" xmlfile | awk -F\> '{print $2}' | awk -F\< '{print $1}'`
 fi

get_if_building method:

this simply checks and sets the IS_BUILDING var like so:

IS_BUILDING=`grep building xmlfile | awk -F\> '{print $2}' | awk -F\< '{print $1}'`

Putting it all together

My script then updates the MySQL database with the results from each check: success/failure, date, build number, user, change details etc

I then have JSP pages that read data from that table, and translate things like true/false in to HTML that sets the background colours (Red, Amber, Green), and shows the appropriate blocks and details per job.

If you have a few browsers/TV’s or Monitors showing these strategically placed around the office, developers get rapid feedback on the result of their code changes which speeds up development, increases quality and reduces development time and costs – and they can be fun to watch and set up too 🙂

Cheers,

Don

DIY Information Radiator


Information Radiators are used to provide people with feedback on the current status of code builds and automated tests in Continuous Integration and Agile development environments.

The basic idea is that when developers commit a code change, they can easily and quickly see that it has been picked up by the automated build process, and then (ideally within 10 minutes) see the result of their change; did the build succeeded and did the automated tests pass?

Martin Fowler’s description goes in to more detail on the ideas behind this approach and the function that Information Radiators serve.

The normal convention for these is to use colour coded blocks per build, using:

  • Green for good/passing jobs
  • Amber for either currently building/running jobs (or sometimes for unstable ones)
  • Red for failed jobs

Generally you want to keep things as clean, simple and uncluttered as possible, but sometimes it is helpful to add in a bit more info.

Details I have occasionally found worth adding include things like;

  • name and/or picture of the user who triggered (or broke!) the build
  • commit message from the code change that triggered the build
  • build number
  • history – number of recent fails or passes
  • date/time last failed and last checked

if you use amber for “unstable” rather than “build in progress”, you may want to add text to say if the job is currently building – I often use the “spinning wheel” icon thingy from jenkins itself :

spinner

Why build your own?

There are tons of readily available plugins that allow you to quickly and easily produce a Radiator or Wall panel from Jenkins, so why go to the bother of making your own?

Plugins are usually linked to one Jenkins instance (the one they are running on) and I have often found that alone to be too restrictive – having too many different radiators all over the place makes things too cluttered and uncertain, and people can easily start to “switch off” from them all – having one screen that people can understand at a glance usually works best.

Changing requirements – developers are constantly wanting/looking to improve processes and often come up with ideas and requests for things to try that may help them do their jobs – adding a bit of information from another source, for example, or changing the colours used to a different shade, or adding curved borders etc etc…

What I have found often works best, is to get all of the data I am interested in inside a database then write my own simple but flexible presentation layer from scratch – this gives me all the flexibility I could want (or may find myself wanting or needing later…) and importantly, it also allows me to leverage additional benefits by combining data from Jenkins with data from elsewhere – this means I can easily produce reports, charts, metrics etc that present a view comprised from multiple data sources throughout an organisation – for example, you can then easily create reports that combine:

  • jenkins – live information on the current state of builds and tests
  • defects – data on bugs and changes pulled from bug tracking apps (usually via jenkins jobs)
  • version control – the actual code change can be extracted from version control and linked to both the developer and bug details – the “svn log” command is useful for this
  • environment monitors – state and health of environments; database and app server health, deployed patch and code levels etc (again, these are usually other Jenkins jobs!)

and you can add in anything else you can get your hands on 🙂

This allows you to track the flow of a change right through the development life cycle – from the initial change/requirement/defect to the change itself at the code/file level, then the testing and building of it and the eventual release. This is far more than you need for a simple Information Radiator, but using this approach means that you can easily reuse much of the work in different ways.

Part II covers the technical approach I use for Extracting data from Jenkins

Monitoring Jenkins Slave Nodes with Groovy

This script is now available on GitHub:

https://github.com/DonaldSimpson/groovy

Here is a simple little Groovy script to monitor the health of slaves in Jenkins and let you know when they fail.

I use a lot of Jenkins slaves on many different Jenkins master instances, and I often have something like this running in a Jenkins job that lets me know if there are issues anywhere – which it will do if any of the Jenkins Slave Nodes are offline or dead etc.

To set this up, you first need to install the Groovy Plugin (https://wiki.jenkins-ci.org/display/JENKINS/Groovy+plugin).

Do this in Jenkins by going to “Manage Jenkins -> Manage Plugins -> Available”, then search for “Groovy Plugin”.

Once that’s done, create a new “Freestyle” Jenkins job and add a Build Step to “Execute System Groovy Script”.

Here’s the code:

int exitcode = 0
for (slave in hudson.model.Hudson.instance.slaves) {
 if (slave.getComputer().isOffline().toString() == "true"){
 println('Slave ' + slave.name + " is offline!"); 
 exitcode++;
 }
}

if (exitcode > 0){
 println("We have a Slave down, failing the build!");
 return 1;
}

You can see what’s going on here, but to be clear the main processing logic is:

for each Slave;
-  if it's offline, increment the exit code

if the exit code is greater than zero;
 - return 1, which will fail the job and trigger an email alert.

Obviously this is deliberately simple, and you could extend it to go off and do any number of things – including trying to bring the slave back online again with something like this: https://wiki.jenkins-ci.org/display/JENKINS/Monitor+and+Restart+Offline+Slaves.

I then configure the job run periodically through the Jenkins cron (check “build periodically” in the build triggers section of your jobs config, then put in a cron schedule – “* * * * *” or “@midnight” for example), and to email me if it fails so I know there’s something up.

A word of warning: don’t try changing the “return 1” to something like System.exit(1)… I did that initially, and it killed the running Jenkins instance… doh! 🙂

So when the Groovy script detects an Offline Jenkins Slave Node, the console output should look something like this:


Building on master in workspace /apps/jenkins/jobs/MonitorSlaves/workspace
Slave <YOURSLAVENAME> is offline!
We have a Slave down, failing the build!
Script returned: 1
Build step 'Execute system Groovy script' marked build as failure
Finished: FAILURE
<send an email or whatever here...>

Cheers,

Don

Jenkins Agent Nodes – using the Swarm Plugin

NOTE: This post and approach is quite old now; a better alternative for dynamically provisioning and scaling Jenkins Agents and running CI/CD Pipelines is demonstrated here.


I’ve been trying out a new (to me at least) way to add a Jenkins Agent Node – using UDP auto discovery via the Jenkins Swarm Plugin

This is a very easy and nice way to do it, with minimal configuration/hassle required so you can quickly and easily add new Jenkins Agent Nodes to your Master Jenkins instance as and when they are required.

Here are my notes from setting this up – it’s pretty simple to do and worked well for me out of the box…

Set up a new instance of Jenkins:

  • Make & cd to a working directory

mkdir jenkinsswarm; cd jenkinsswarm

  • Fetch jenkins.war

curl -O http://mirrors.karan.org/jenkins/war/1.506/jenkins.war

  • Start Jenkins

{/path/to/java/bin/}java -jar jenkins.war

After that, you should get console output along these lines…

Running from: /root/jenkinsswarm/jenkins.war
webroot: $user.home/.jenkins
18-Mar-2013 15:19:26 winstone.Logger logInternal
INFO: Beginning extraction from war file
Jenkins home directory: /root/.jenkins found at: $user.home/.jenkins
18-Mar-2013 15:19:33 winstone.Logger logInternal
INFO: HTTP Listener started: port=8080
18-Mar-2013 15:19:33 winstone.Logger logInternal
INFO: Winstone Servlet Engine v0.9.10 running: controlPort=disabled
18-Mar-2013 15:19:34 jenkins.InitReactorRunner$1 onAttained
INFO: Started initialization
18-Mar-2013 15:19:35 jenkins.InitReactorRunner$1 onAttained
INFO: Listed all plugins
18-Mar-2013 15:19:35 jenkins.InitReactorRunner$1 onAttained
INFO: Prepared all plugins
18-Mar-2013 15:19:35 jenkins.InitReactorRunner$1 onAttained
INFO: Started all plugins
18-Mar-2013 15:19:41 jenkins.InitReactorRunner$1 onAttained
INFO: Augmented all extensions
18-Mar-2013 15:19:41 jenkins.InitReactorRunner$1 onAttained
INFO: Loaded all jobs
18-Mar-2013 15:19:44 org.jenkinsci.main.modules.sshd.SSHD start
INFO: Started SSHD at port 25133
18-Mar-2013 15:19:44 jenkins.InitReactorRunner$1 onAttained
INFO: Completed initialization
18-Mar-2013 15:19:44 hudson.TcpAgentListener <init>
INFO: JNLP agent listener started on TCP port 41790
18-Mar-2013 15:19:44 hudson.WebAppMain$2 run
INFO: Jenkins is fully up and running

– that looks happy enough, and as you can see from the line “HTTP Listener started: port=8080” it’s running on the default port, so connect to http://yourhost:8080 and you should see something like this…

the next step is to install the Swarm Plugin (https://wiki.jenkins-ci.org/display/JENKINS/Swarm+Plugin) on this Jenkins Master instance so that Swarm Clients can connect to it.

Do this by going to “Manage Jenkins > Manage Plugins > Available” then selecting to install the “Swarm Plugin“.

Once that’s done you should see that the plugin has been installed…


Now that your new Jenkins server is set up and ready, hop over to your other Jenkins Agent/Client host and do the following…

mkdir for the swarm client

mkdir swarmclient; cd swarmclient/

Get the Swarm Client jar file from the ‘net

curl -O http://maven.jenkins-ci.org/content/repositories/releases/org/jenkins-ci/plugins/swarm-client/1.8/swarm-client-1.8-jar-with-dependencies.jar

Start up the Client

java -jar swarm-client-1.8-jar-with-dependencies.jar
Found 1 eligible Jenkins.
Connecting to http://mydomain.com:8080/
Attempting to connect to http://mydomain.com:8080/ a2721b16-04e4-0d962
18-Mar-2013 15:33:22 org.apache.commons.httpclient.HttpMethodDirector authenticateHost
WARNING: Required credentials not available for BASIC <any realm>@mydomain.com:8080
18-Mar-2013 15:33:22 org.apache.commons.httpclient.HttpMethodDirector authenticateHost
WARNING: Preemptive authentication requested but no default credentials available
18-Mar-2013 15:33:23 hudson.remoting.jnlp.Main$CuiListener <init>
INFO: Hudson agent is running in headless mode.
18-Mar-2013 15:33:23 hudson.remoting.jnlp.Main$CuiListener status
INFO: Locating server among [http://mydomain.com:8080/]
18-Mar-2013 15:33:23 hudson.remoting.jnlp.Main$CuiListener status
INFO: Connecting to myhost.mydomain.com:43932
18-Mar-2013 15:33:23 hudson.remoting.jnlp.Main$CuiListener status
INFO: Handshaking
18-Mar-2013 15:33:23 hudson.remoting.jnlp.Main$CuiListener status
INFO: Connected

Now take a look at your browser and you should see a new Node automatically added to the Master Jenkins instance…

A very handy and flexible approach to adding/managing Nodes and workload – many thanks to the developers behind this!

Cheers,

Don

Pin It on Pinterest

%d bloggers like this: