Some pics on a range of wood-related things I’ve been working on recently.
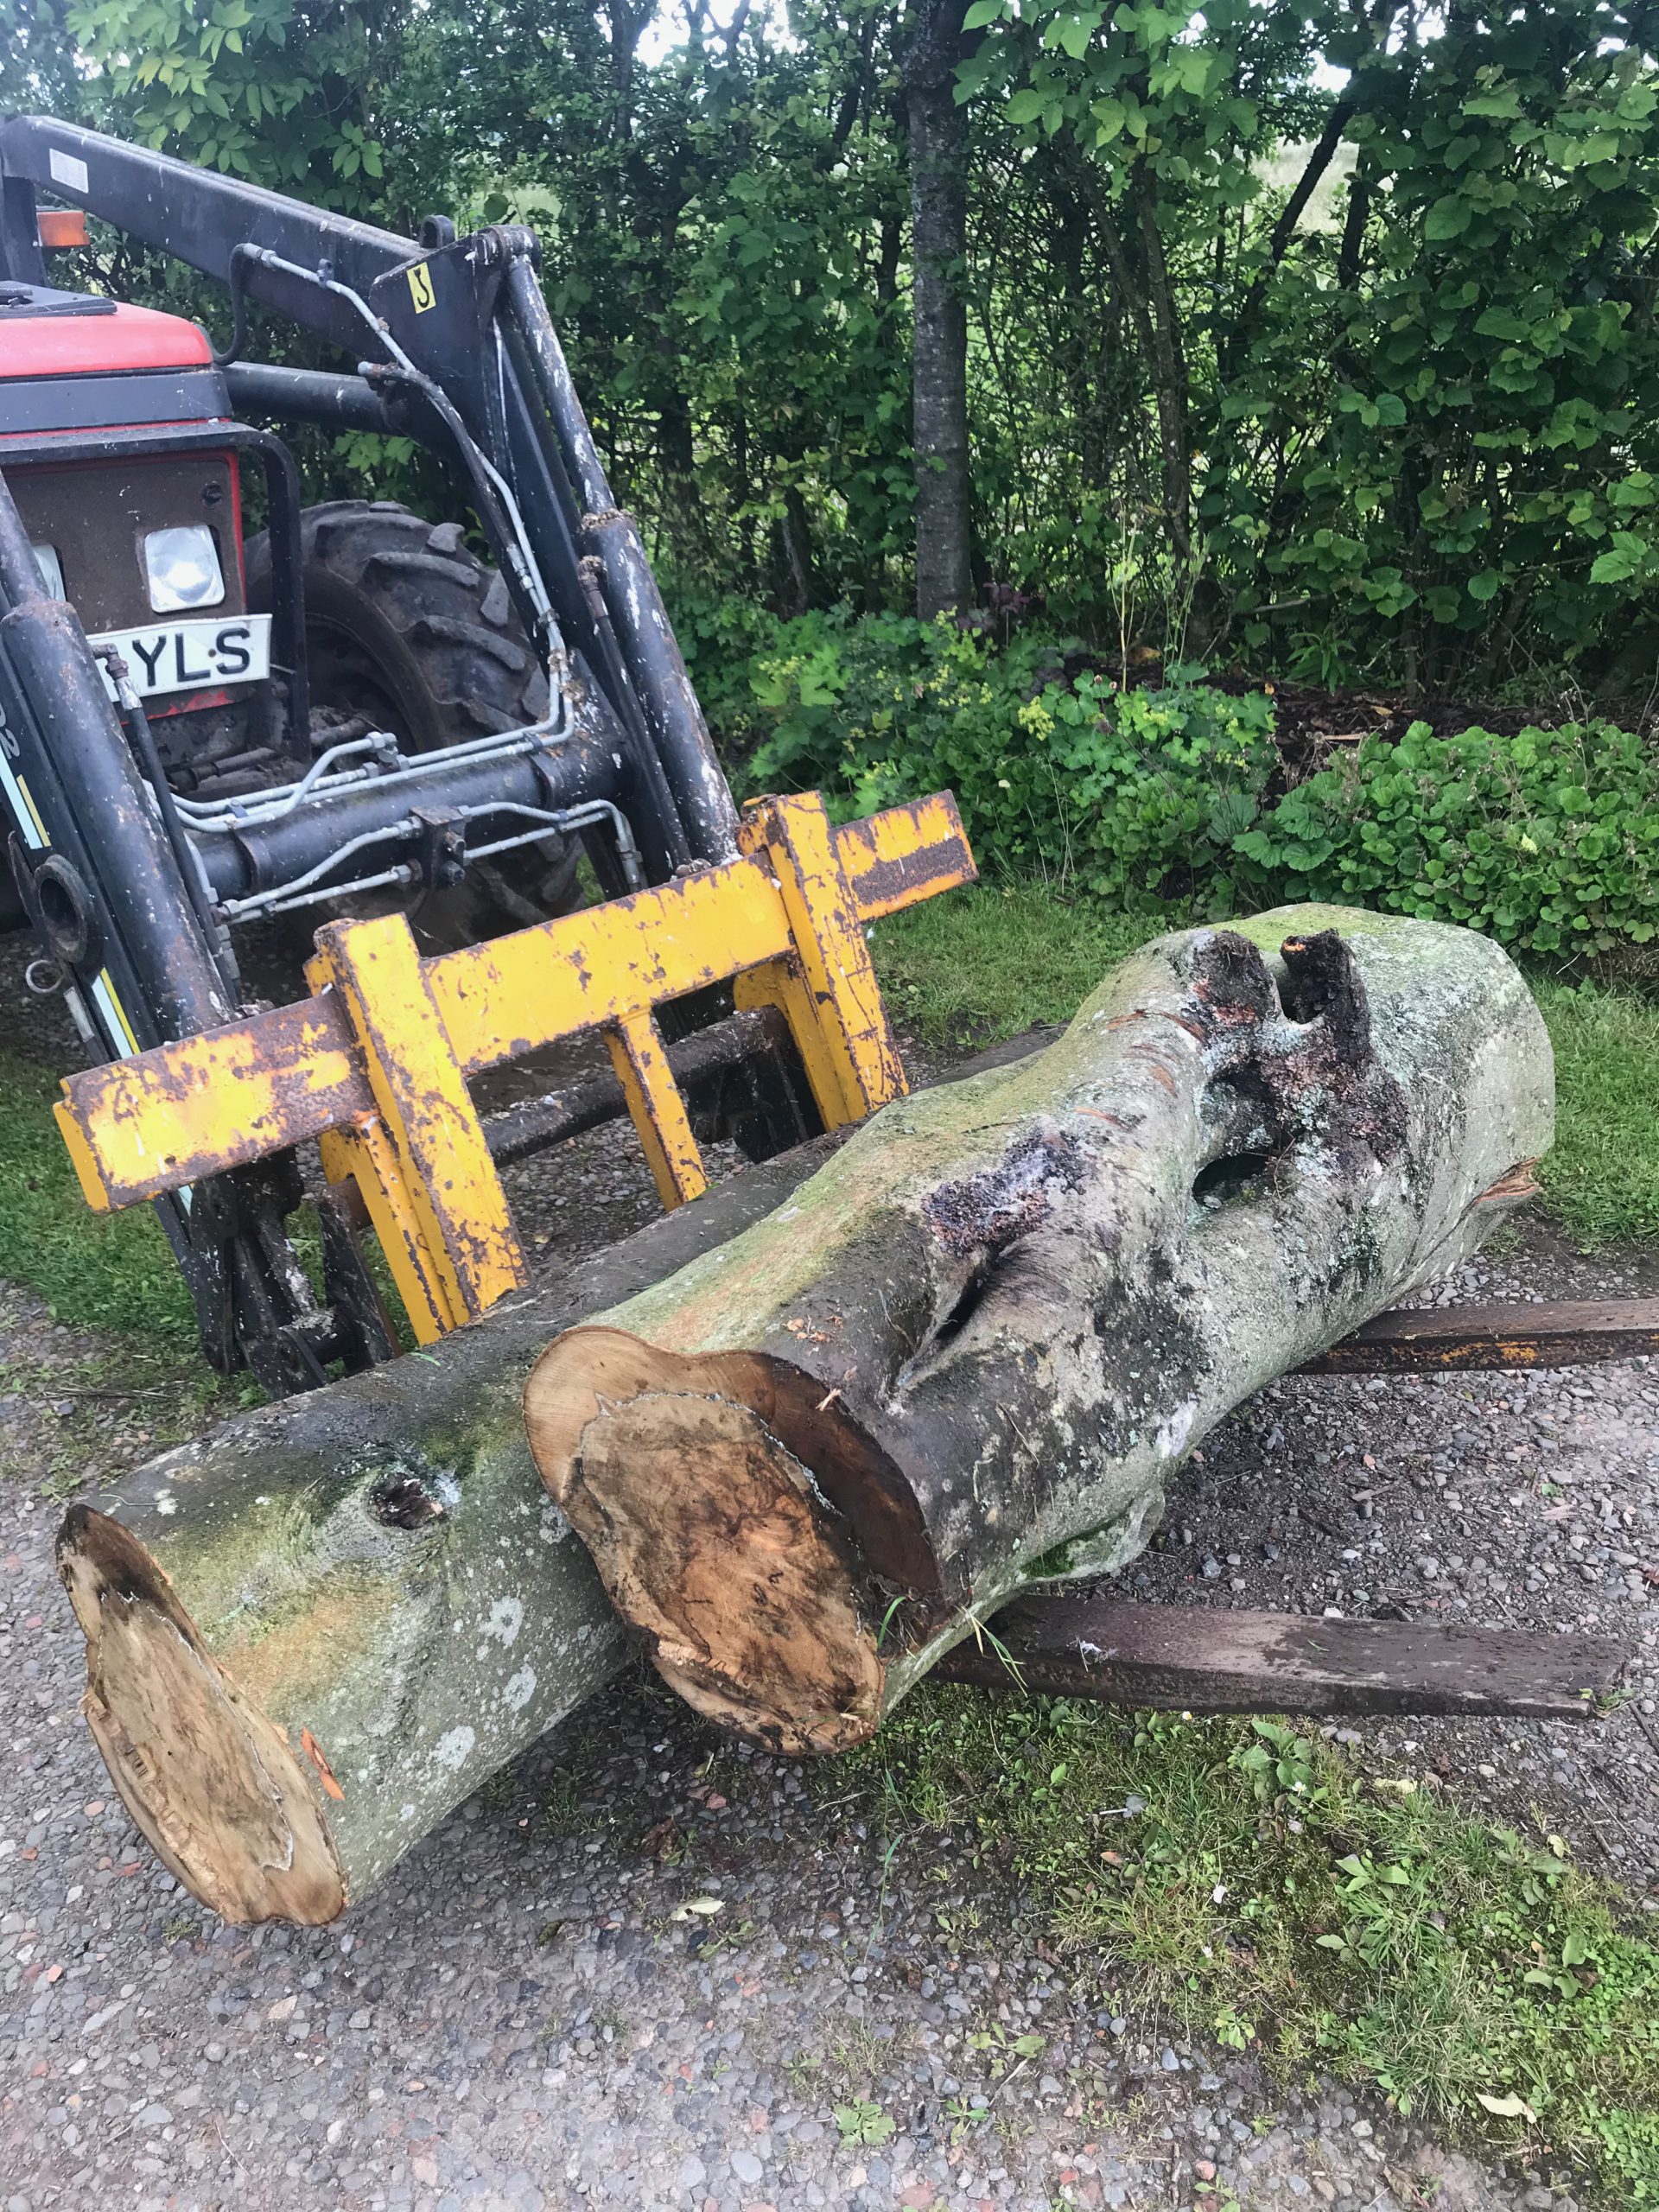
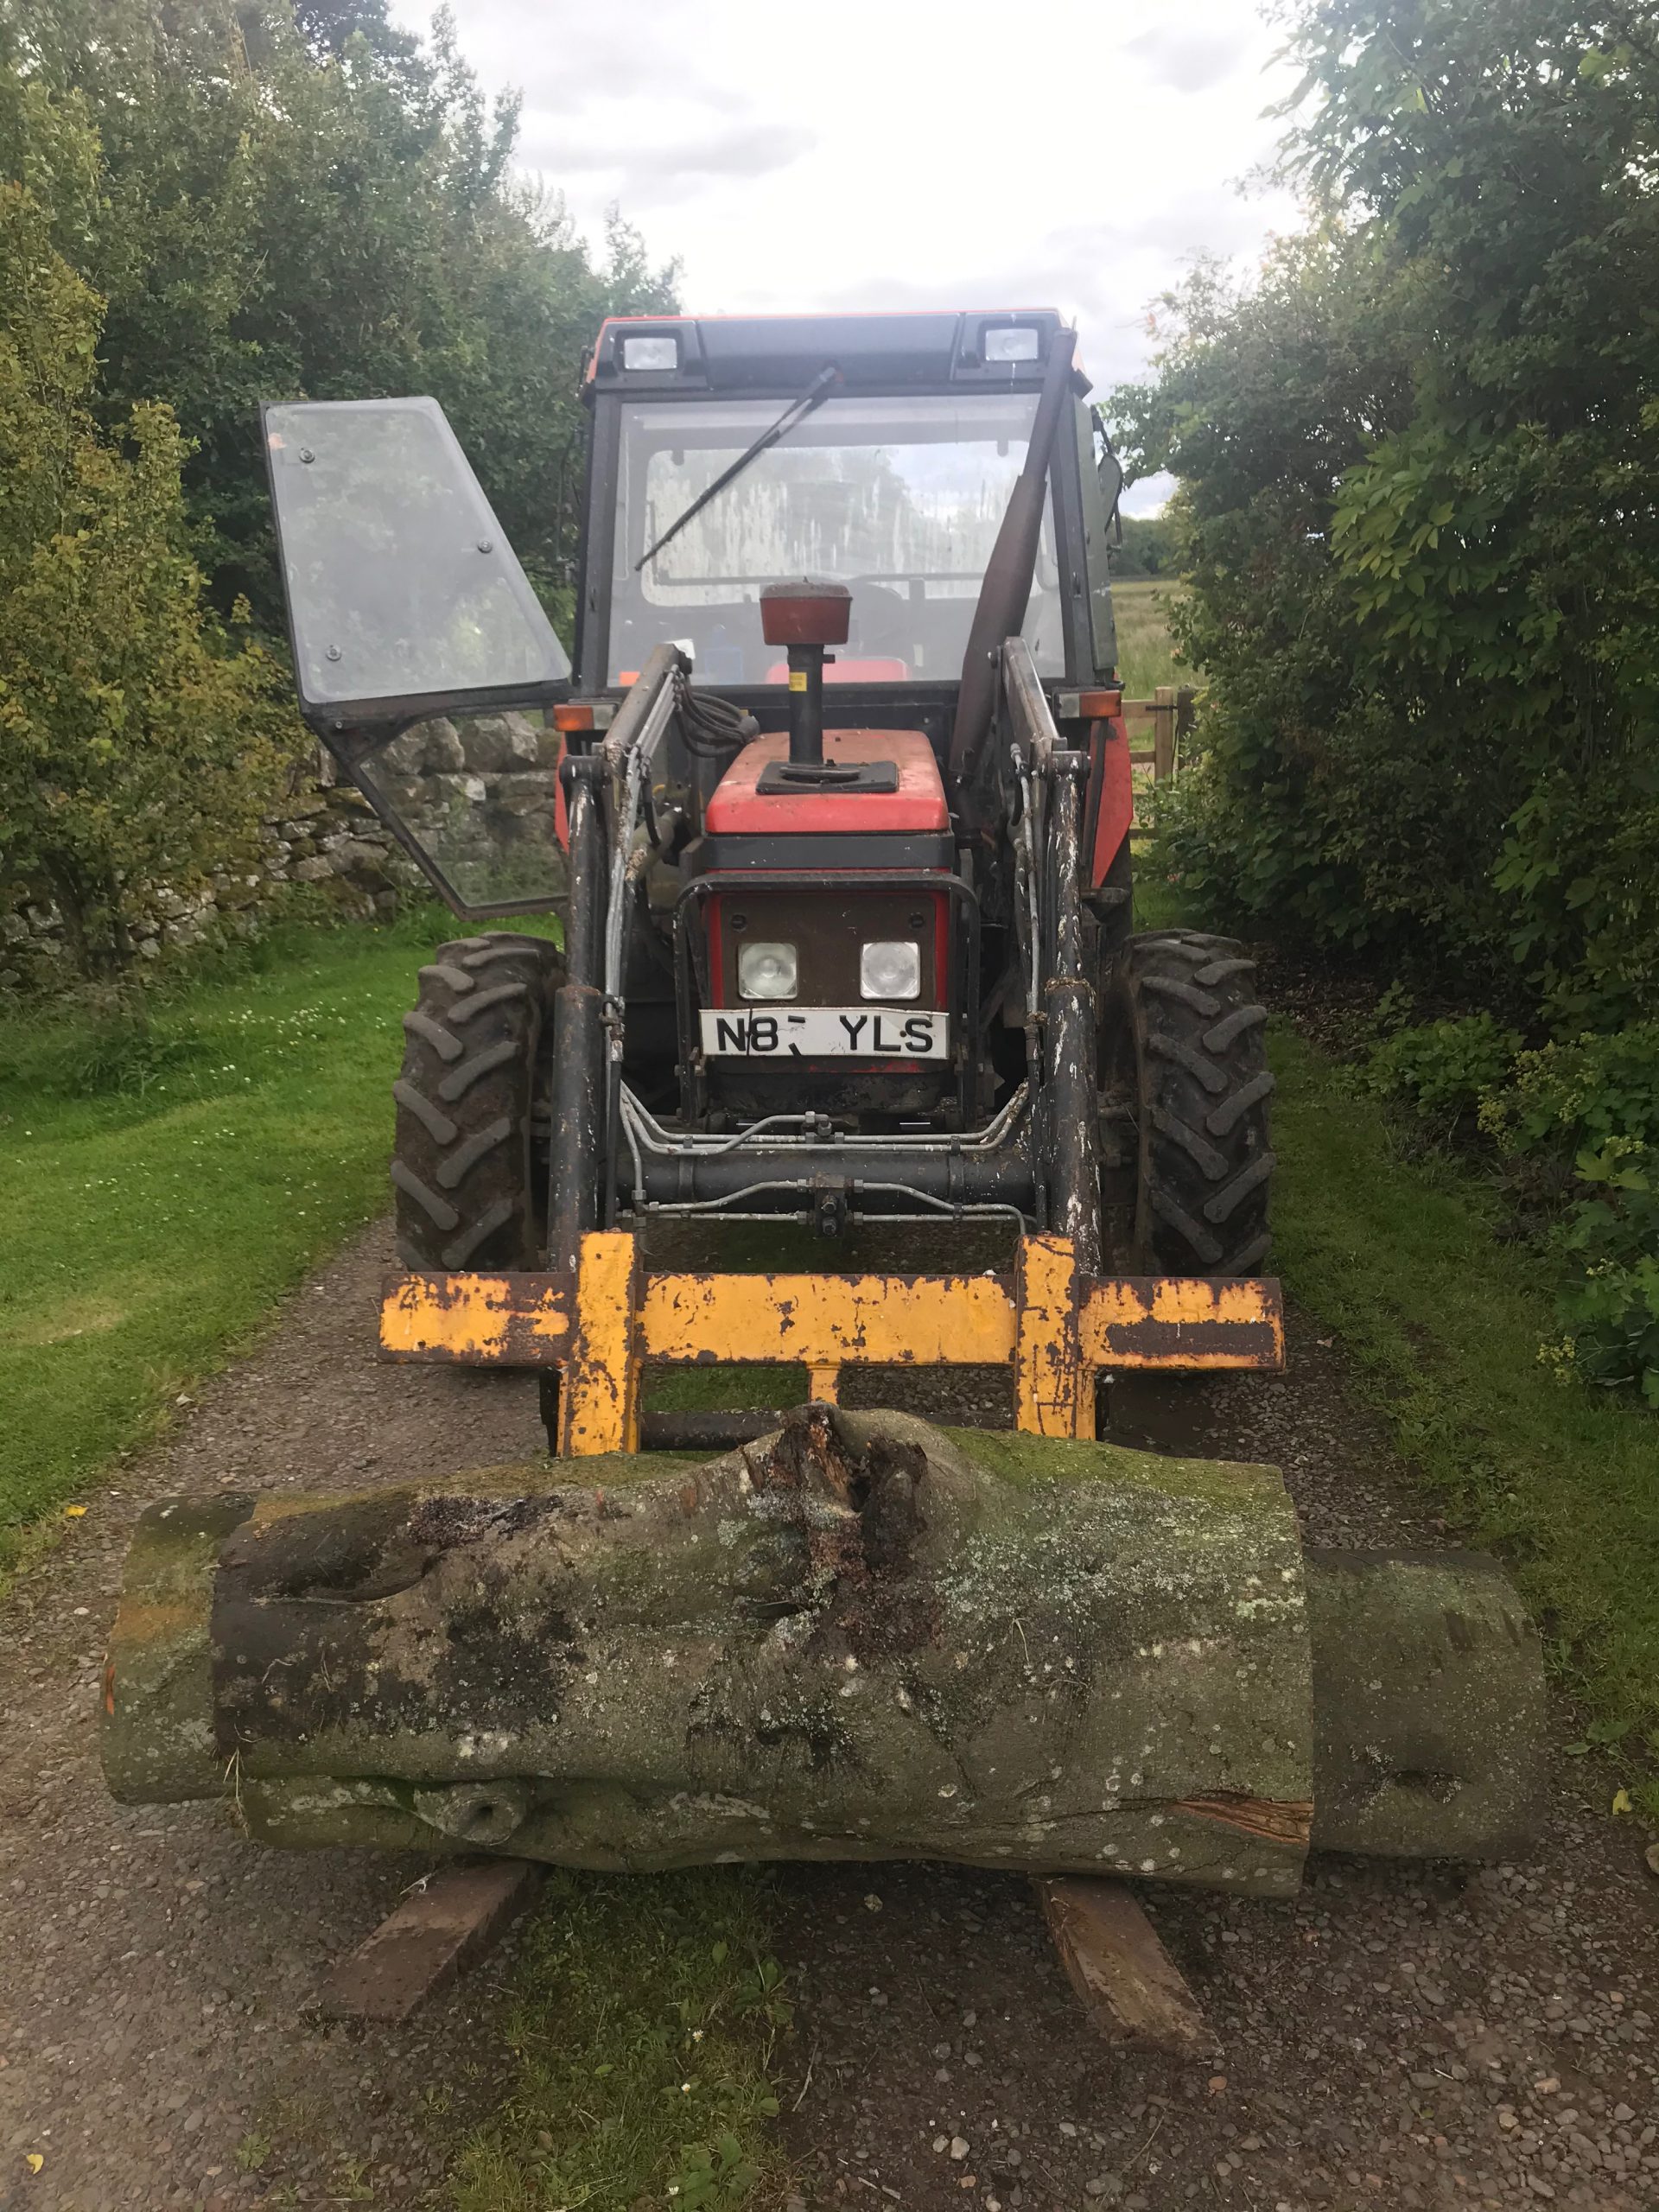
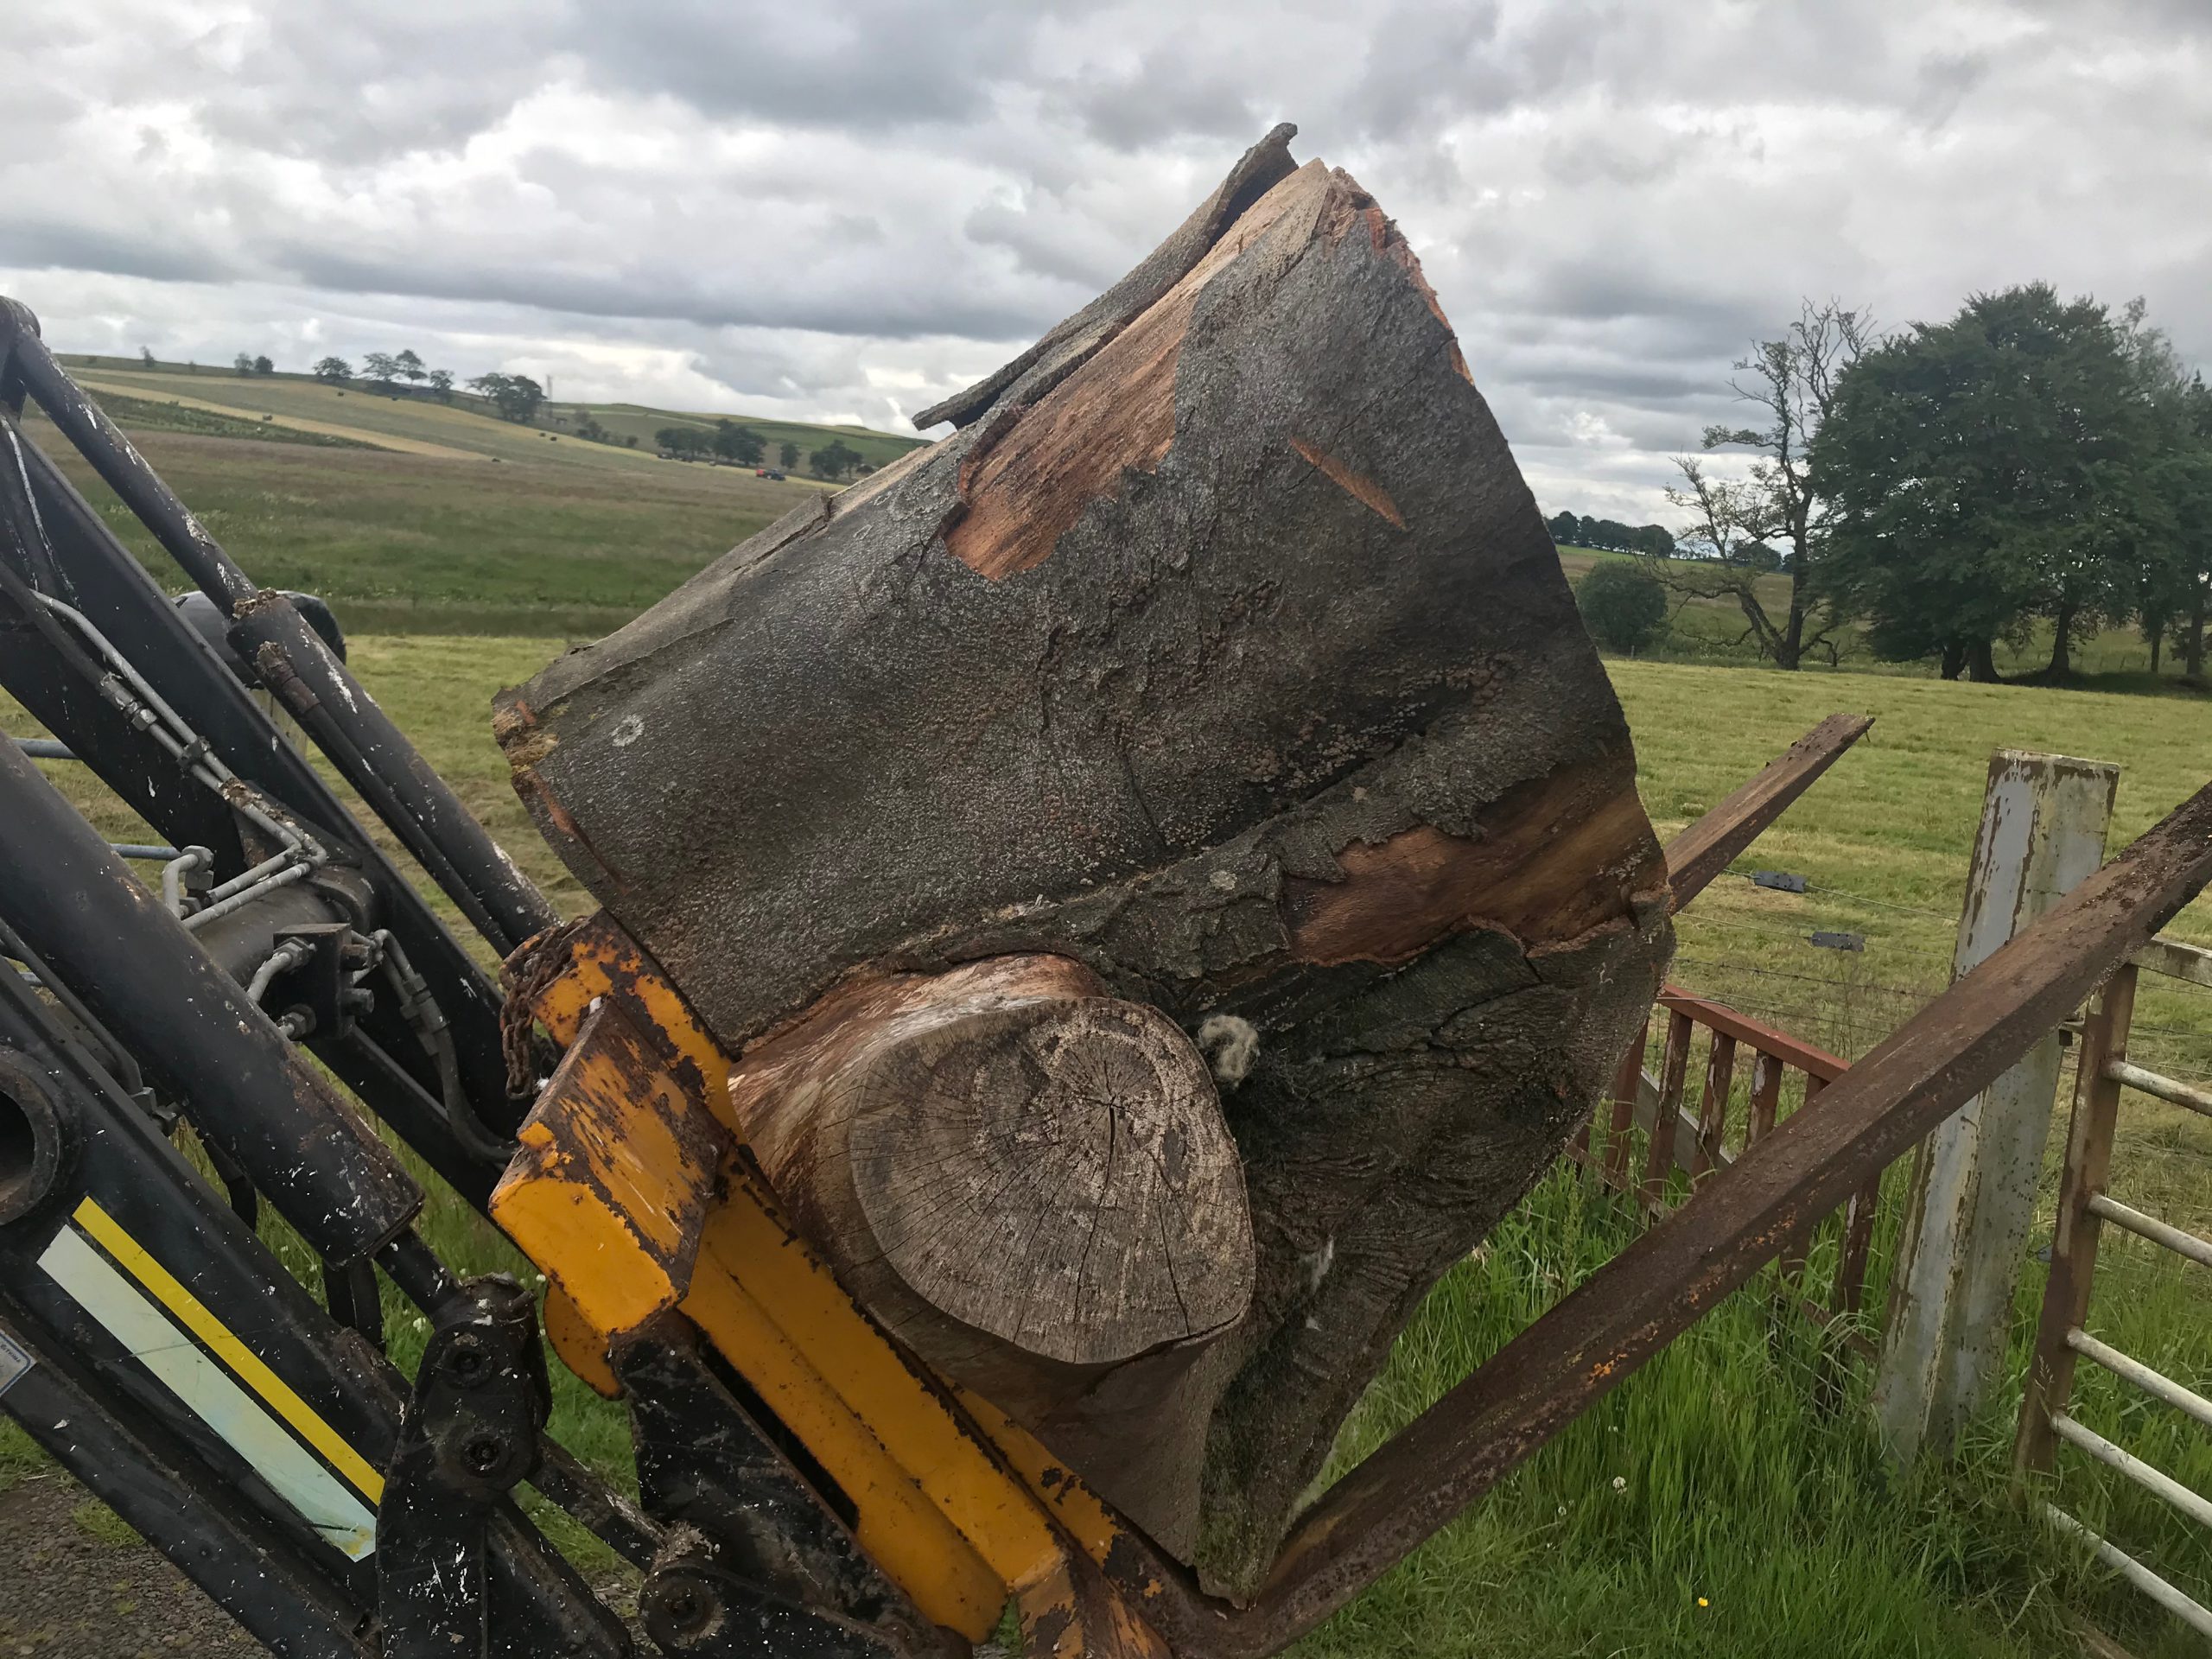
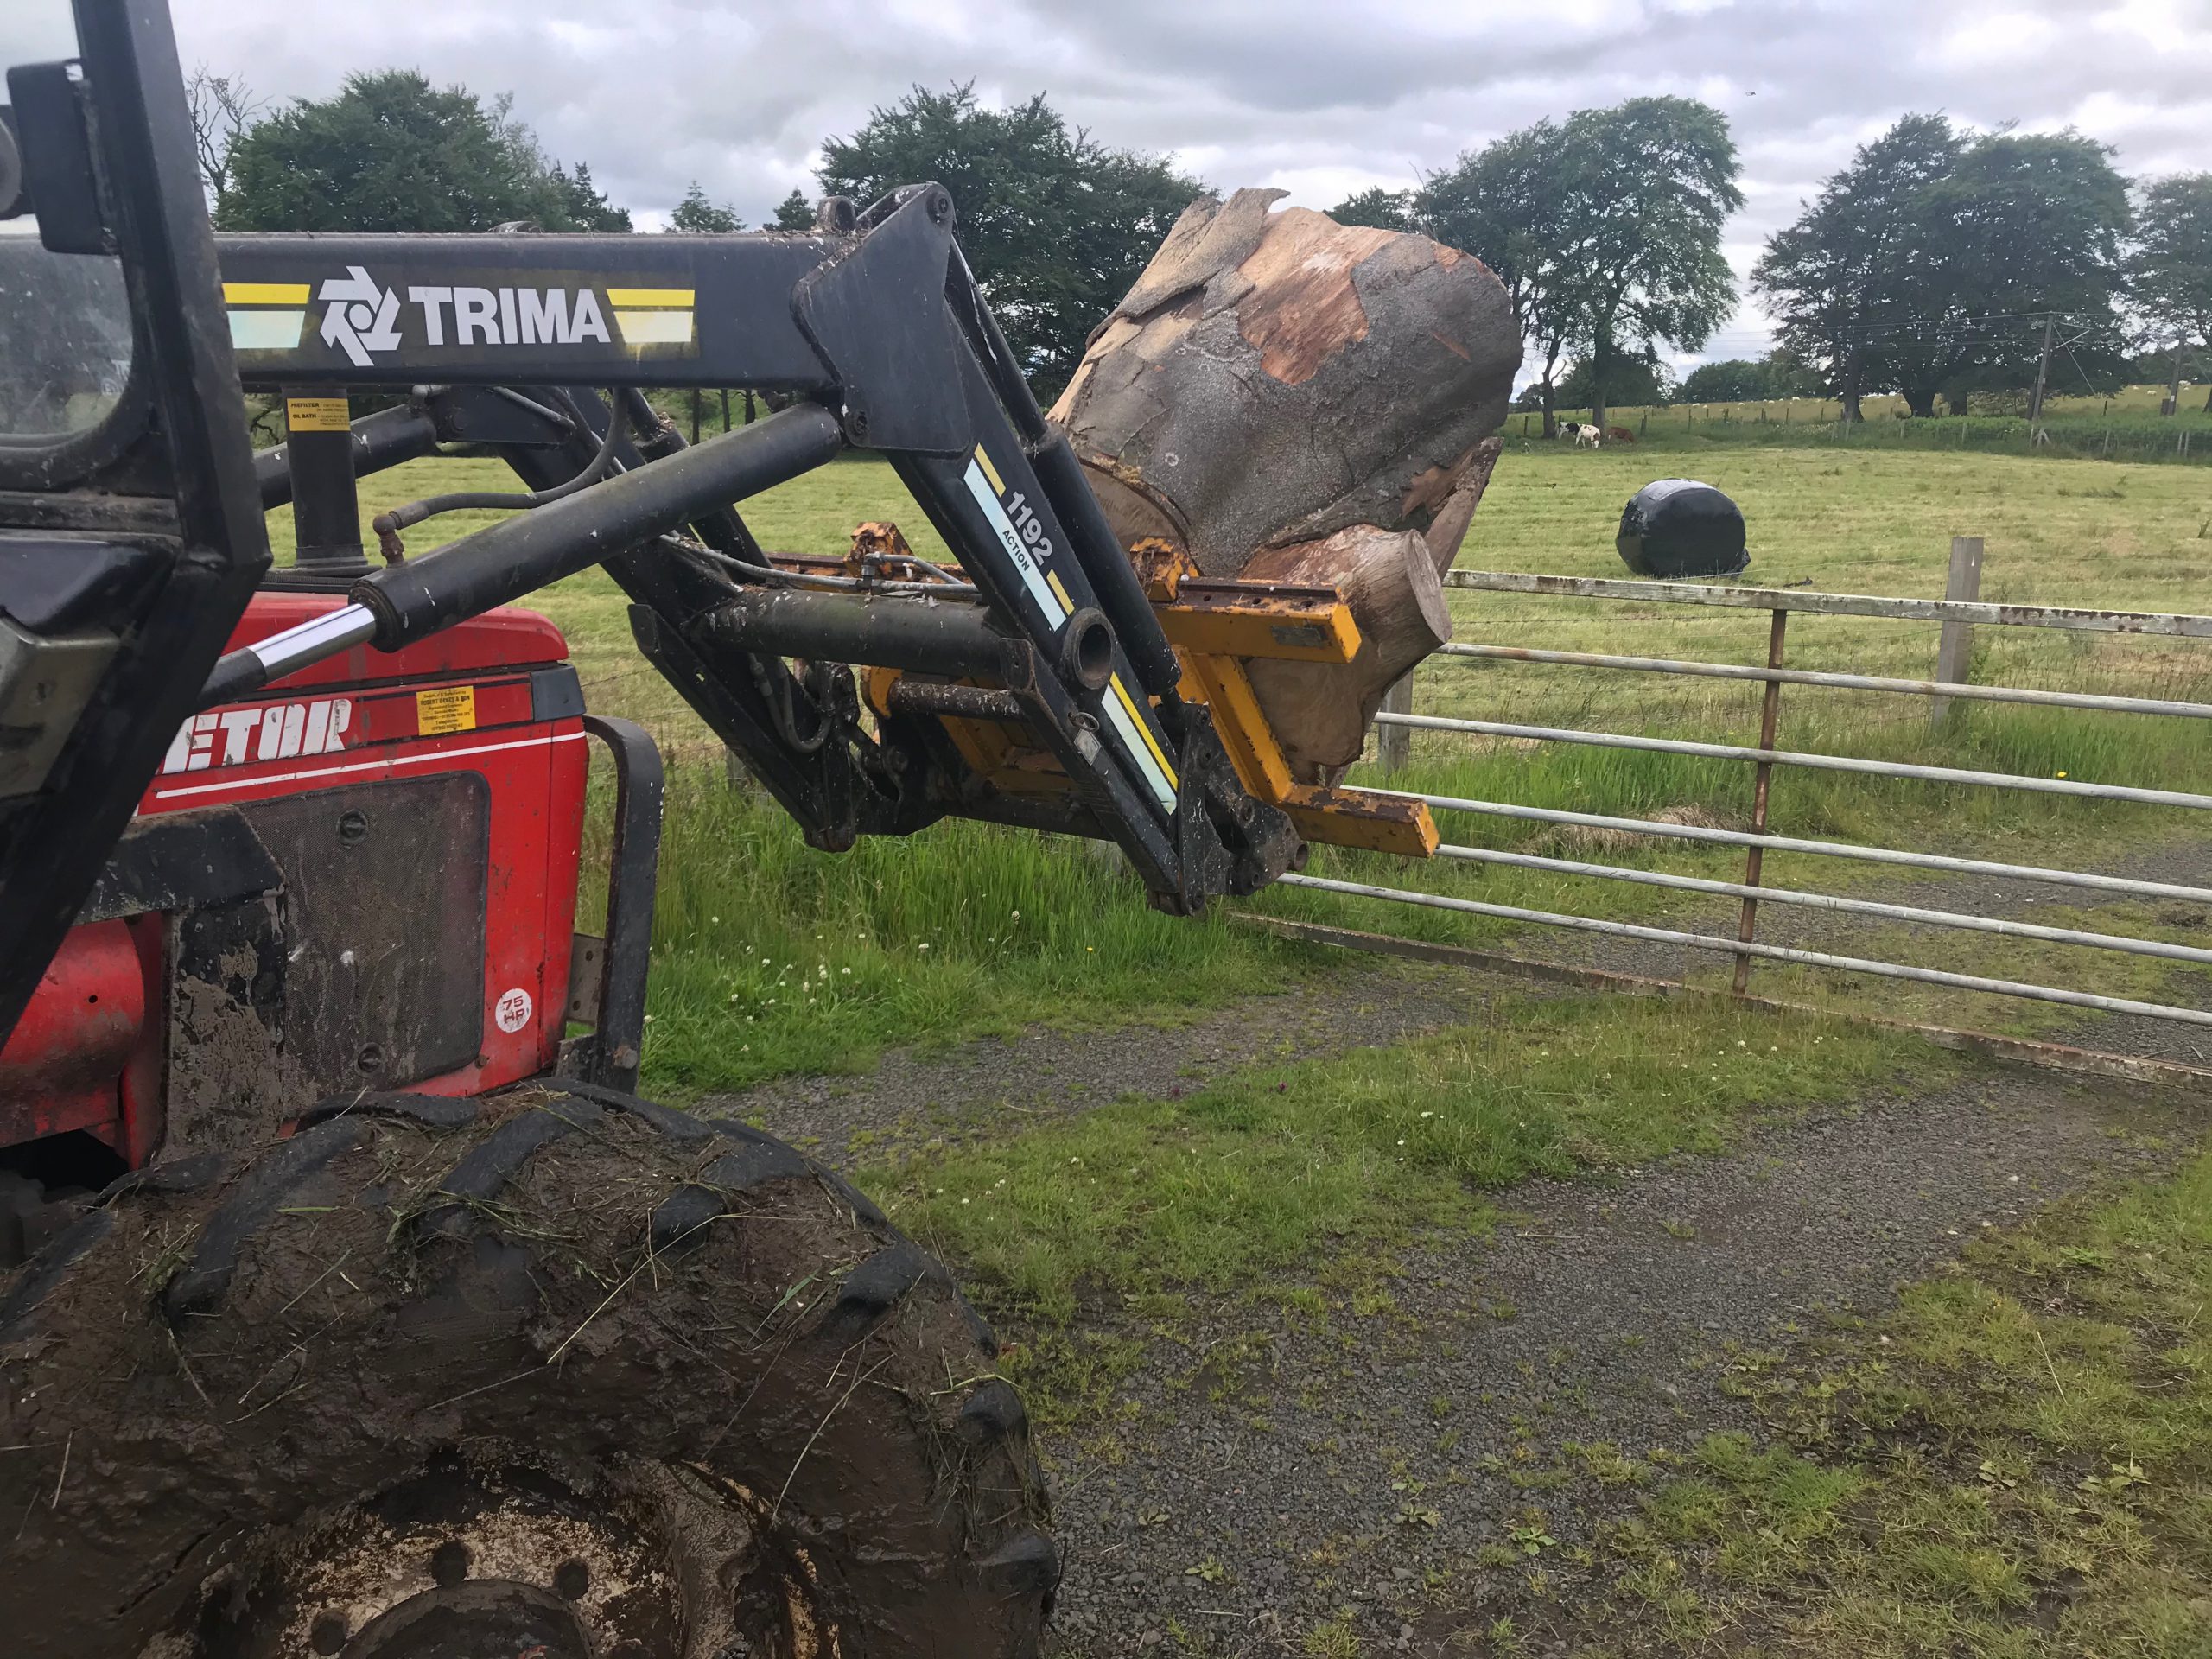
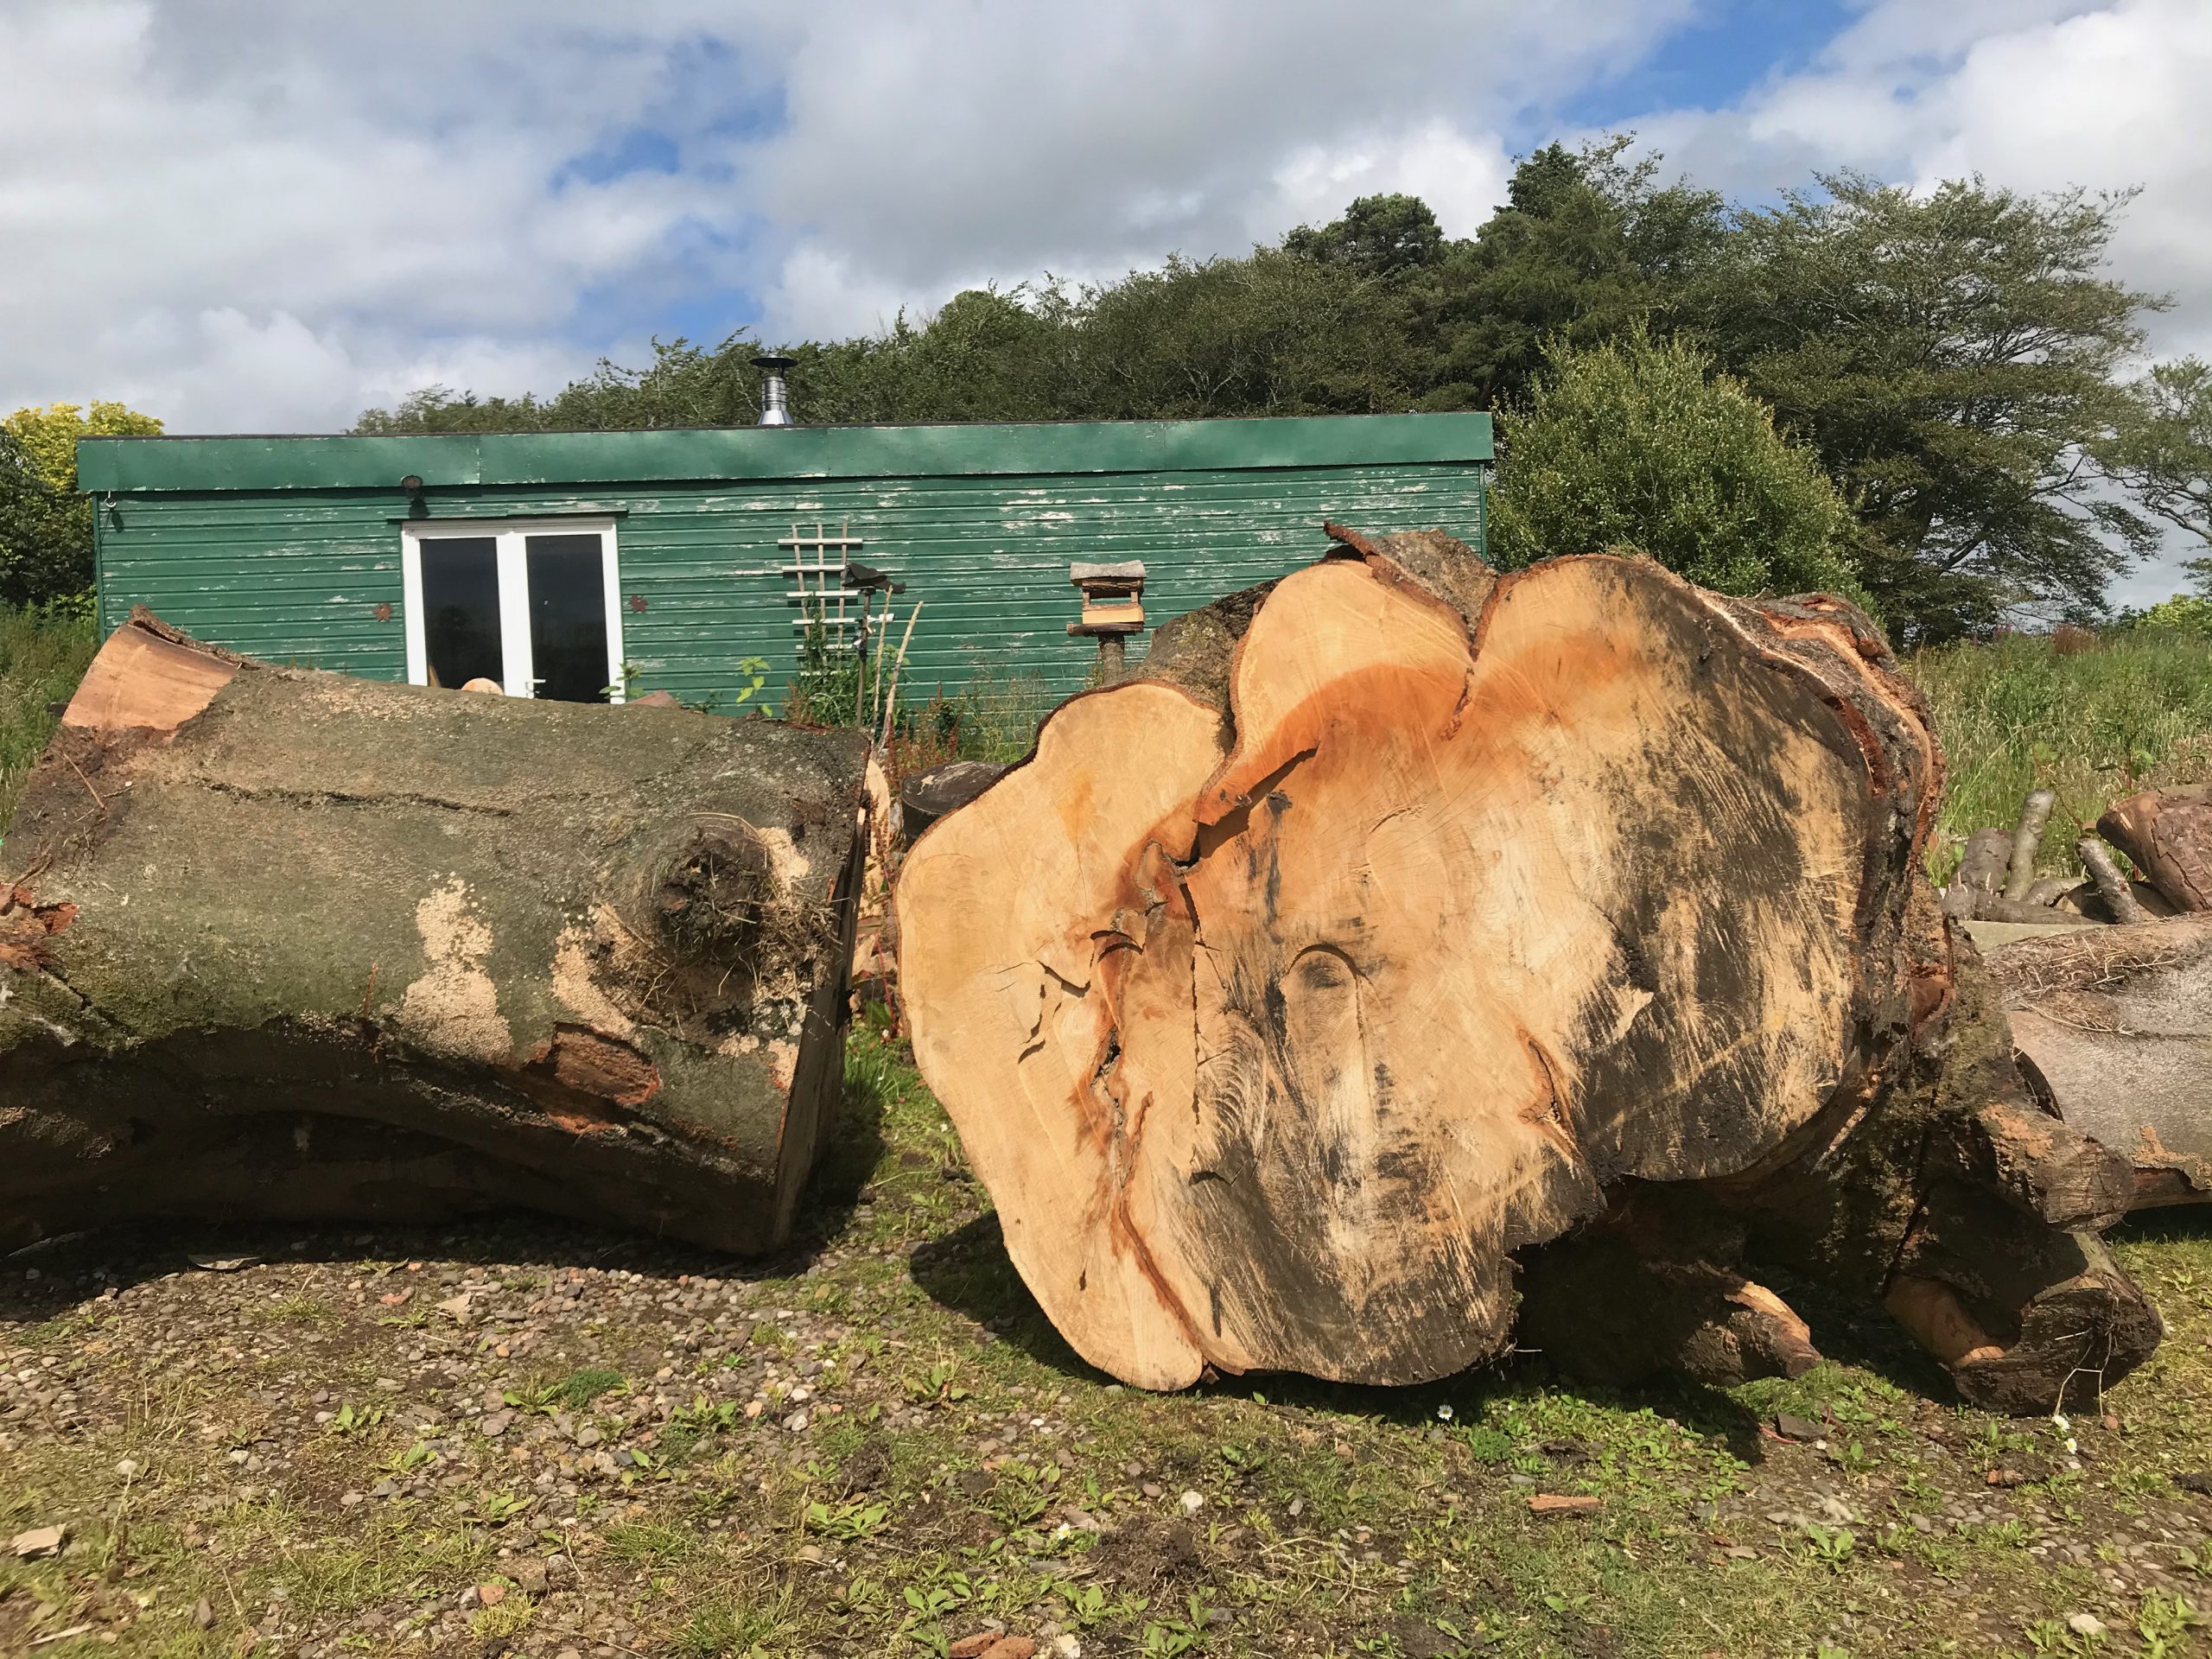
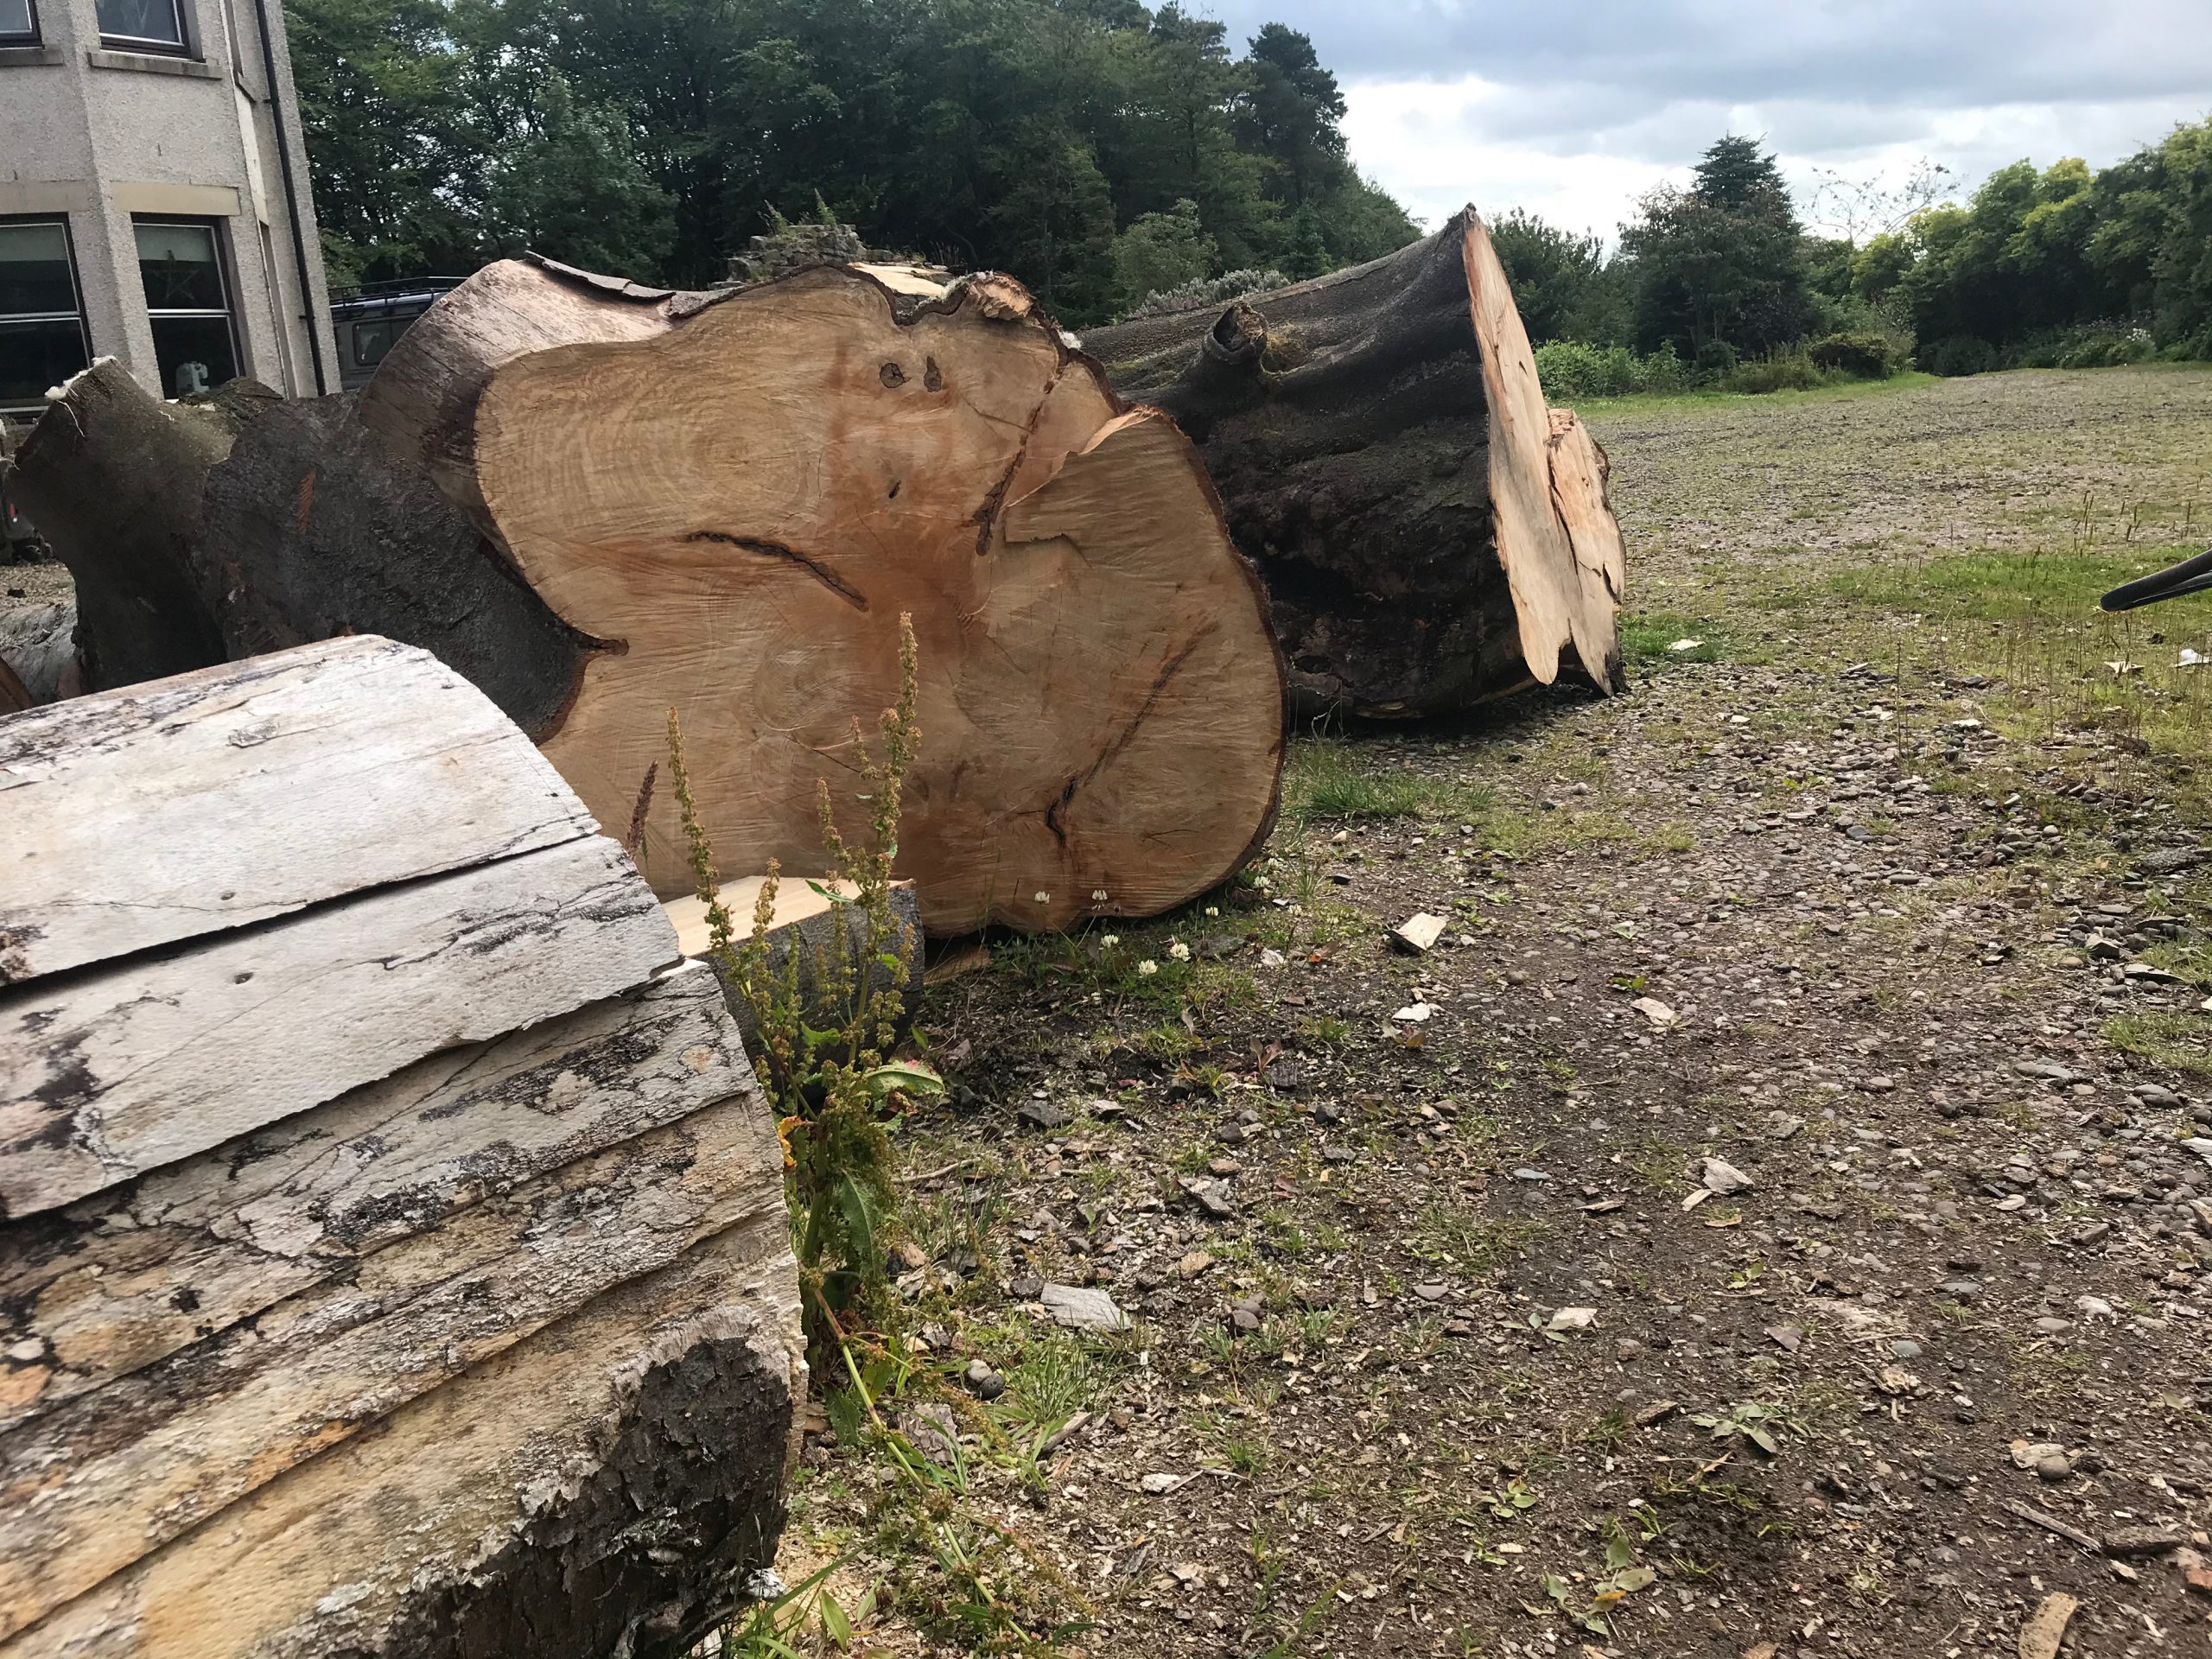
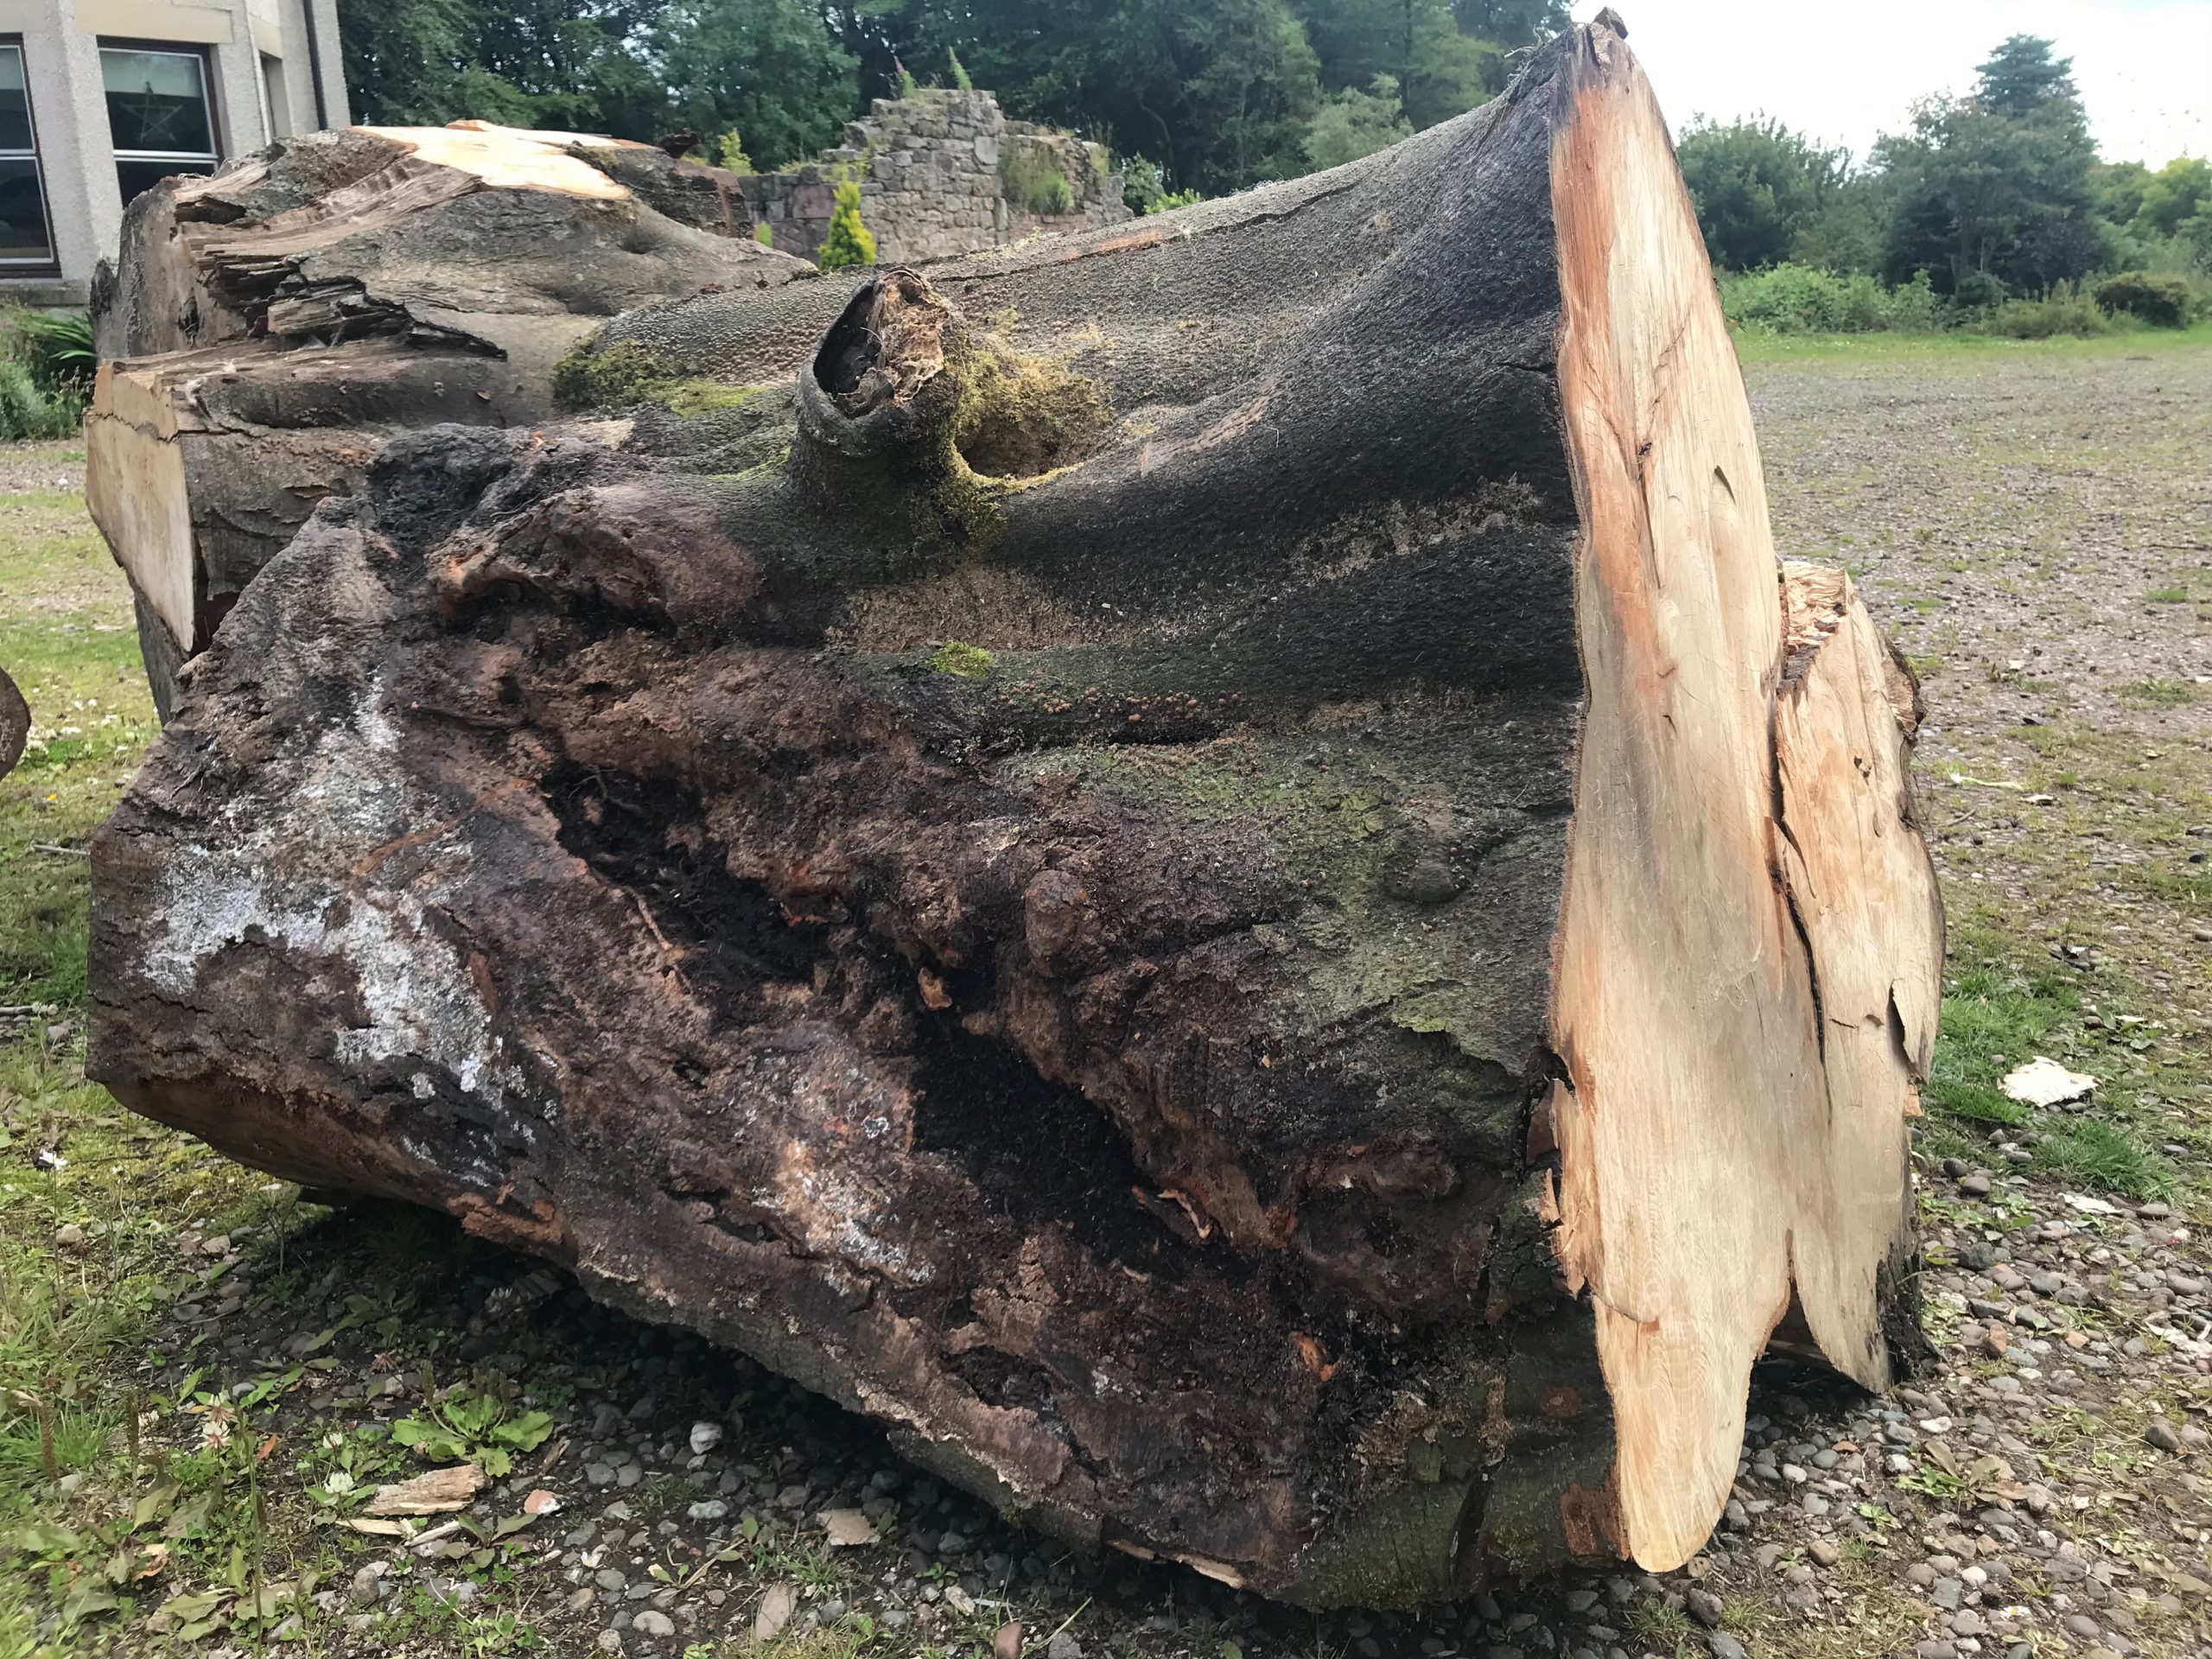
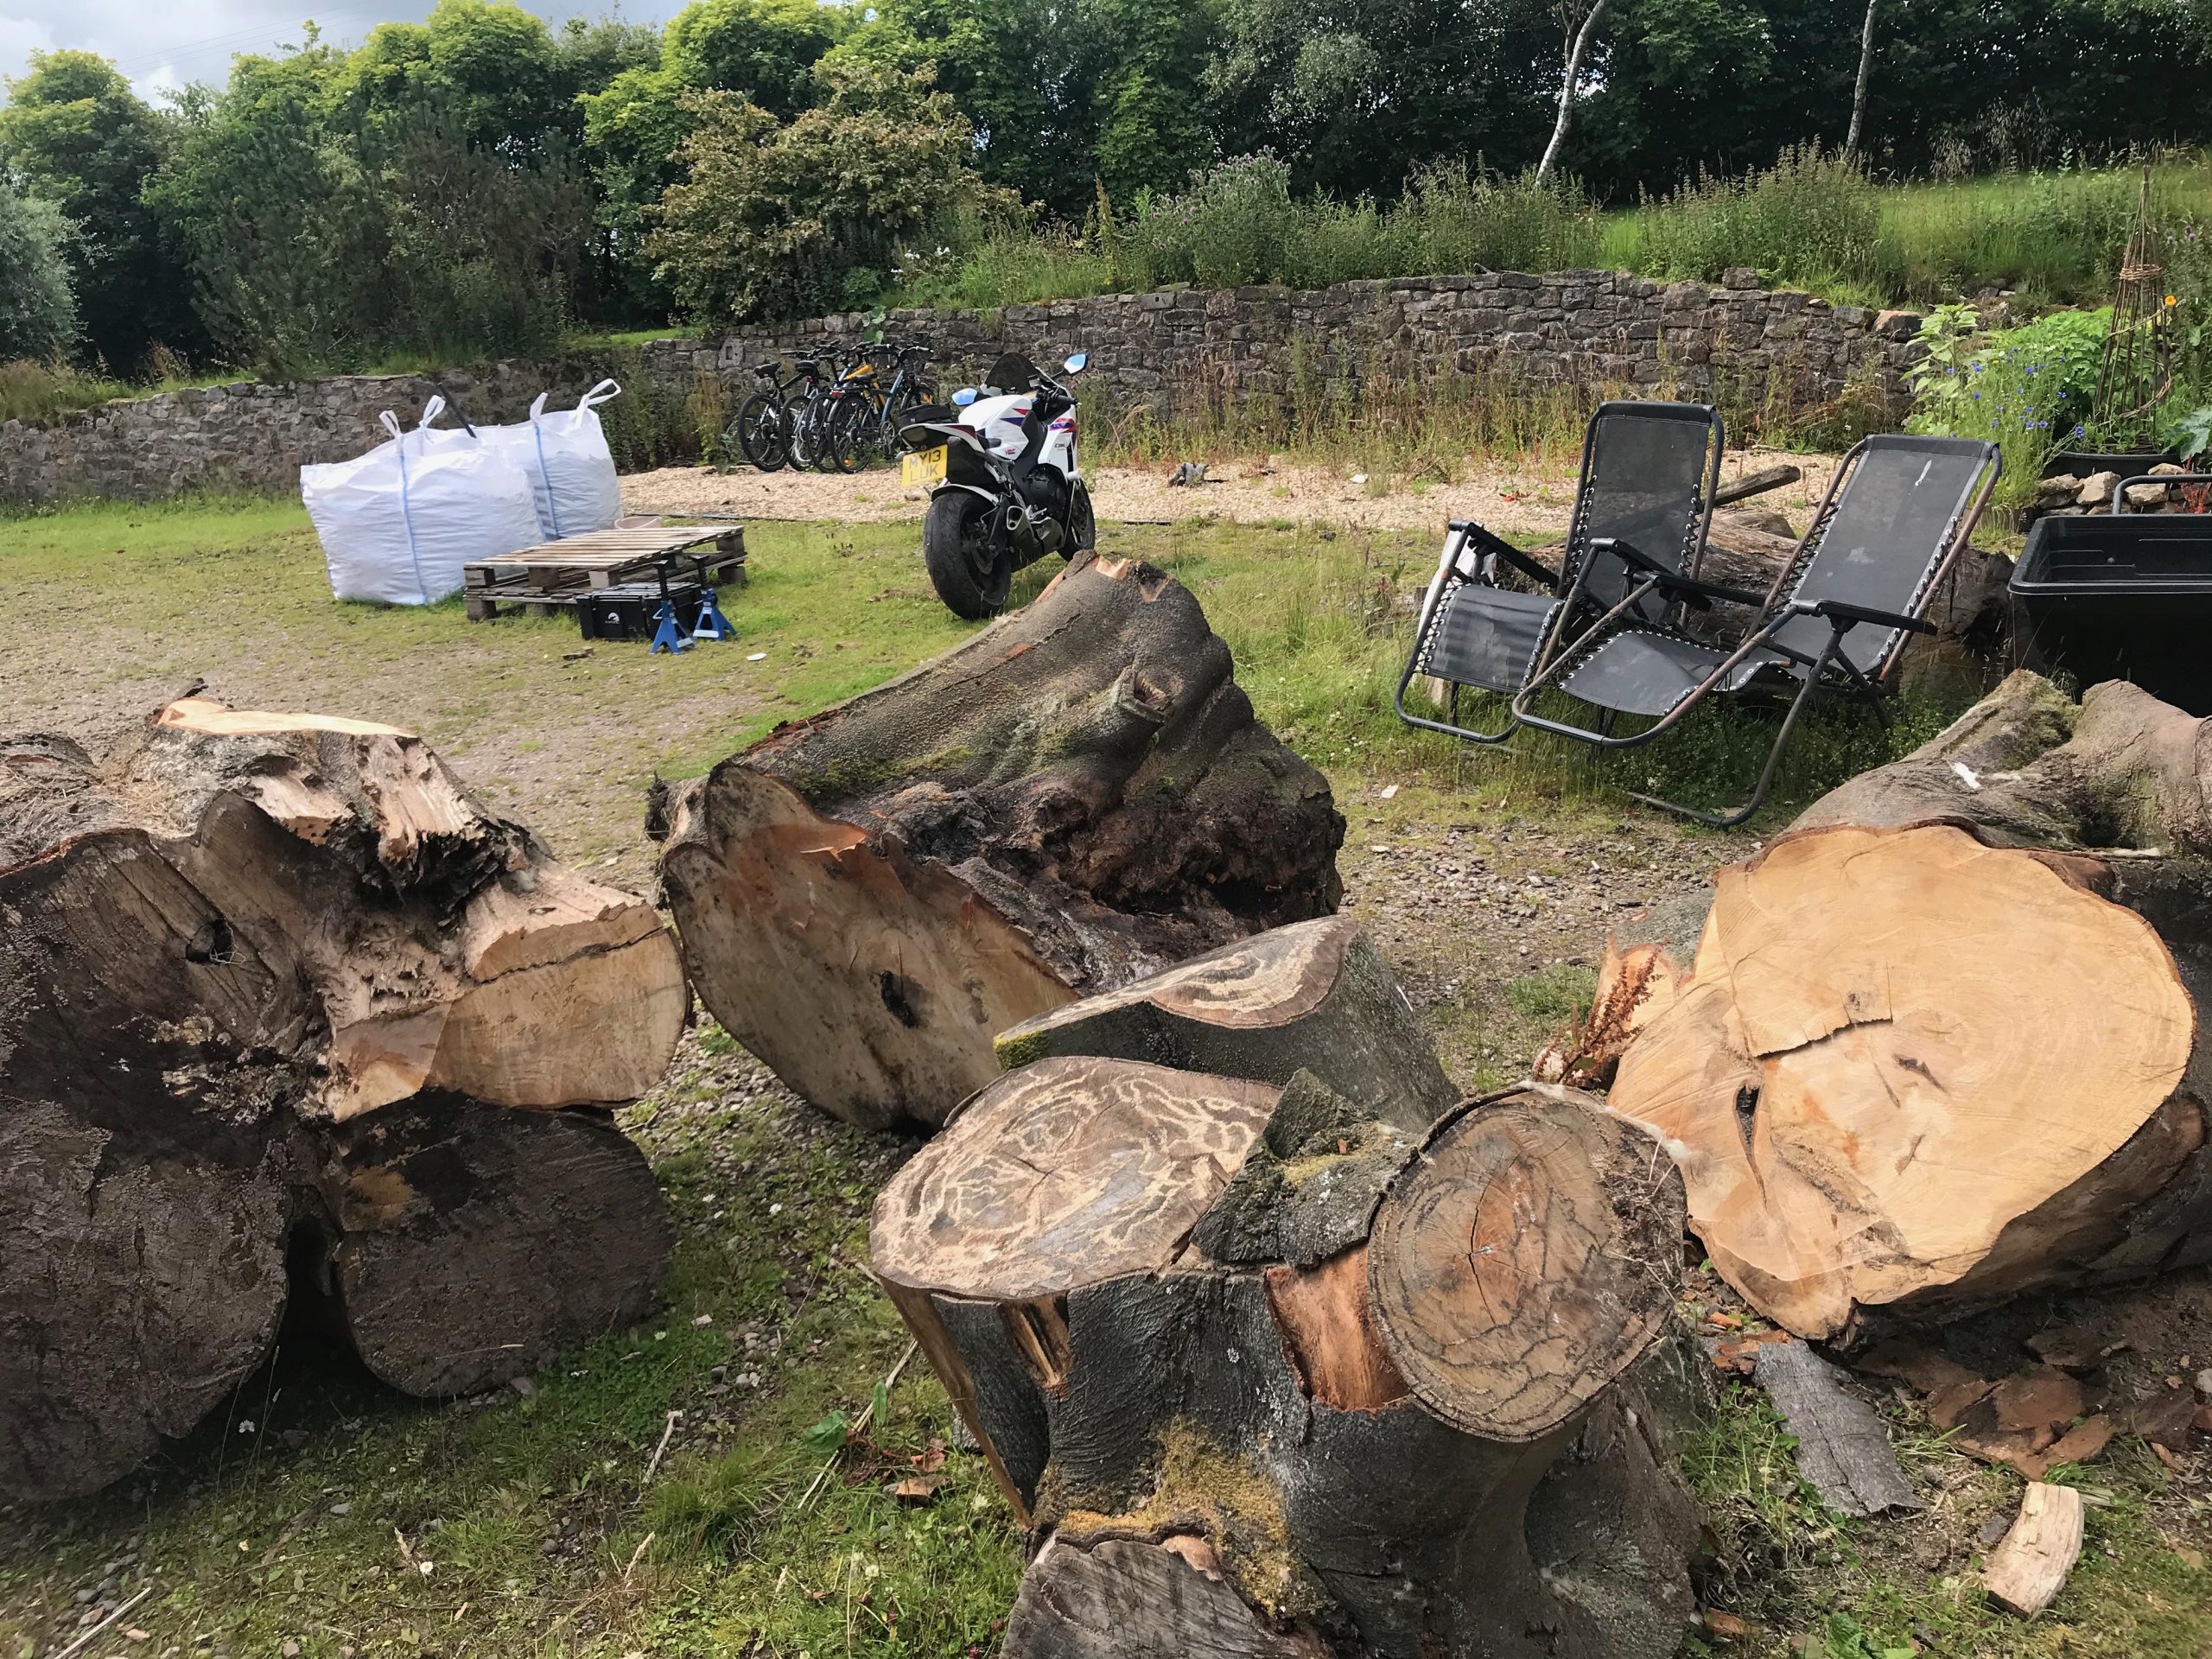
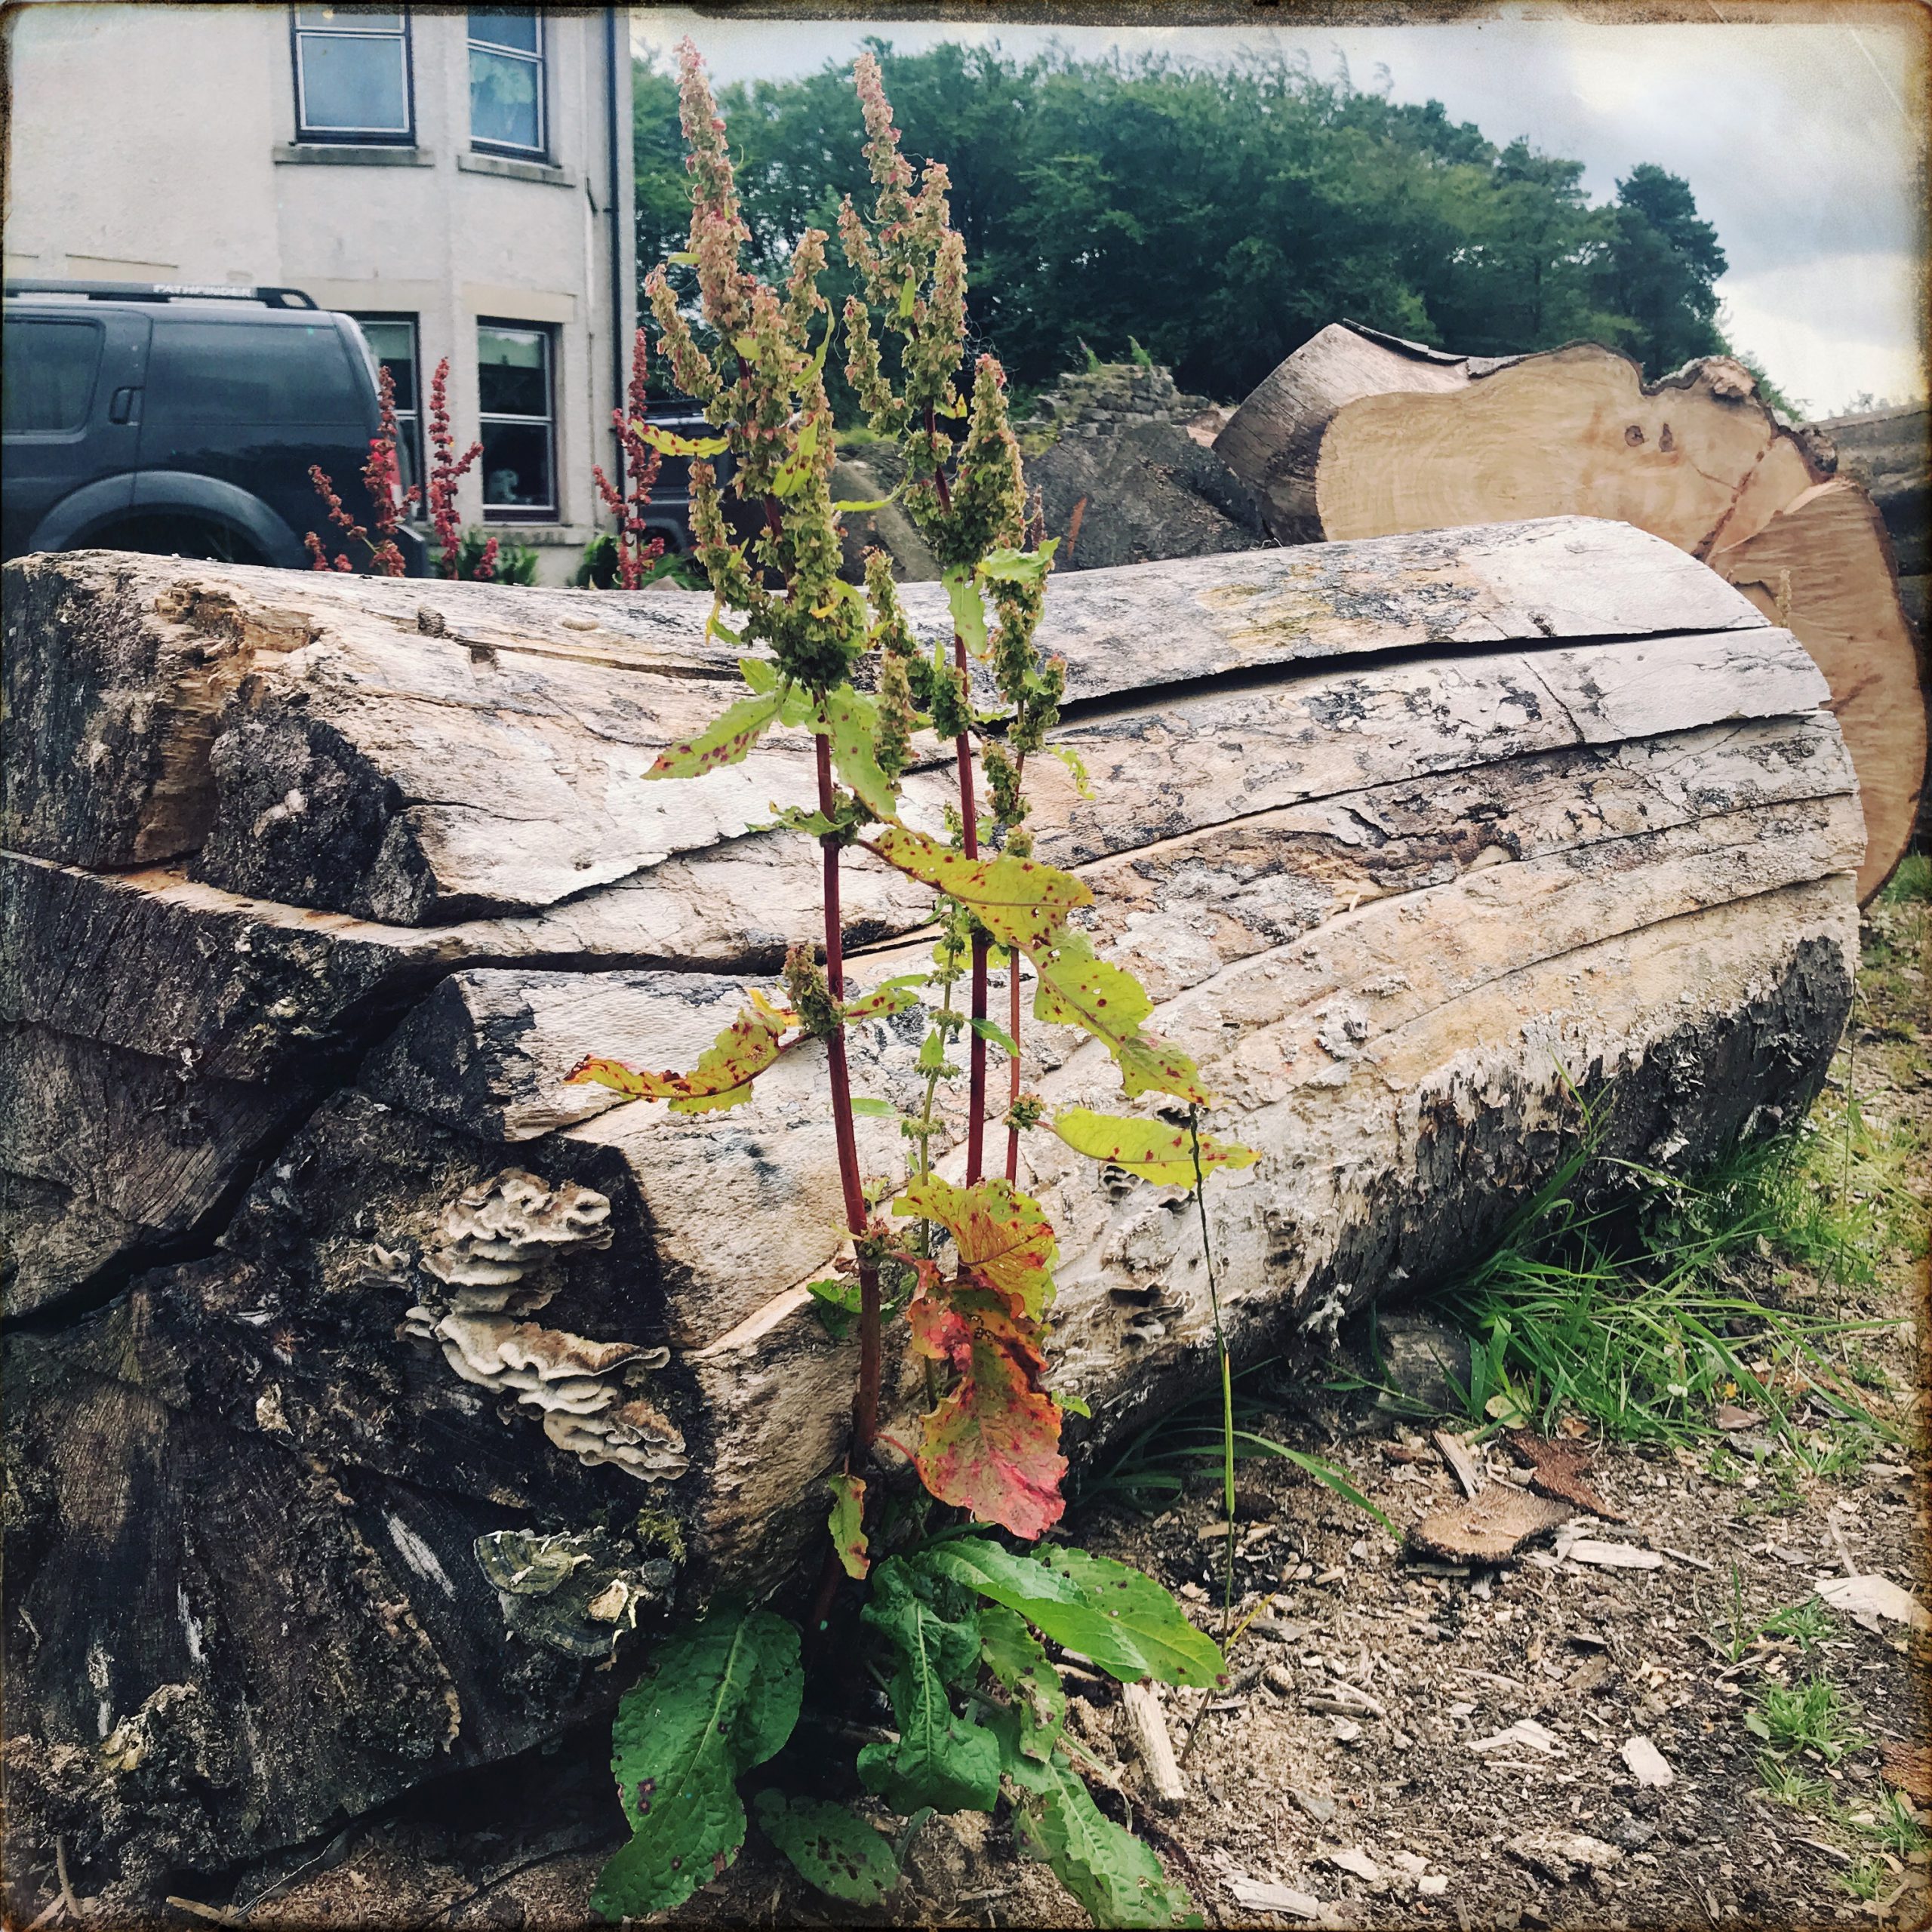
Bringing home the last of the Beech tree 2019, finally! Dealing with the massive trunk & stump sections – they’re to be sealed, slabbed and stored away for milling next year…
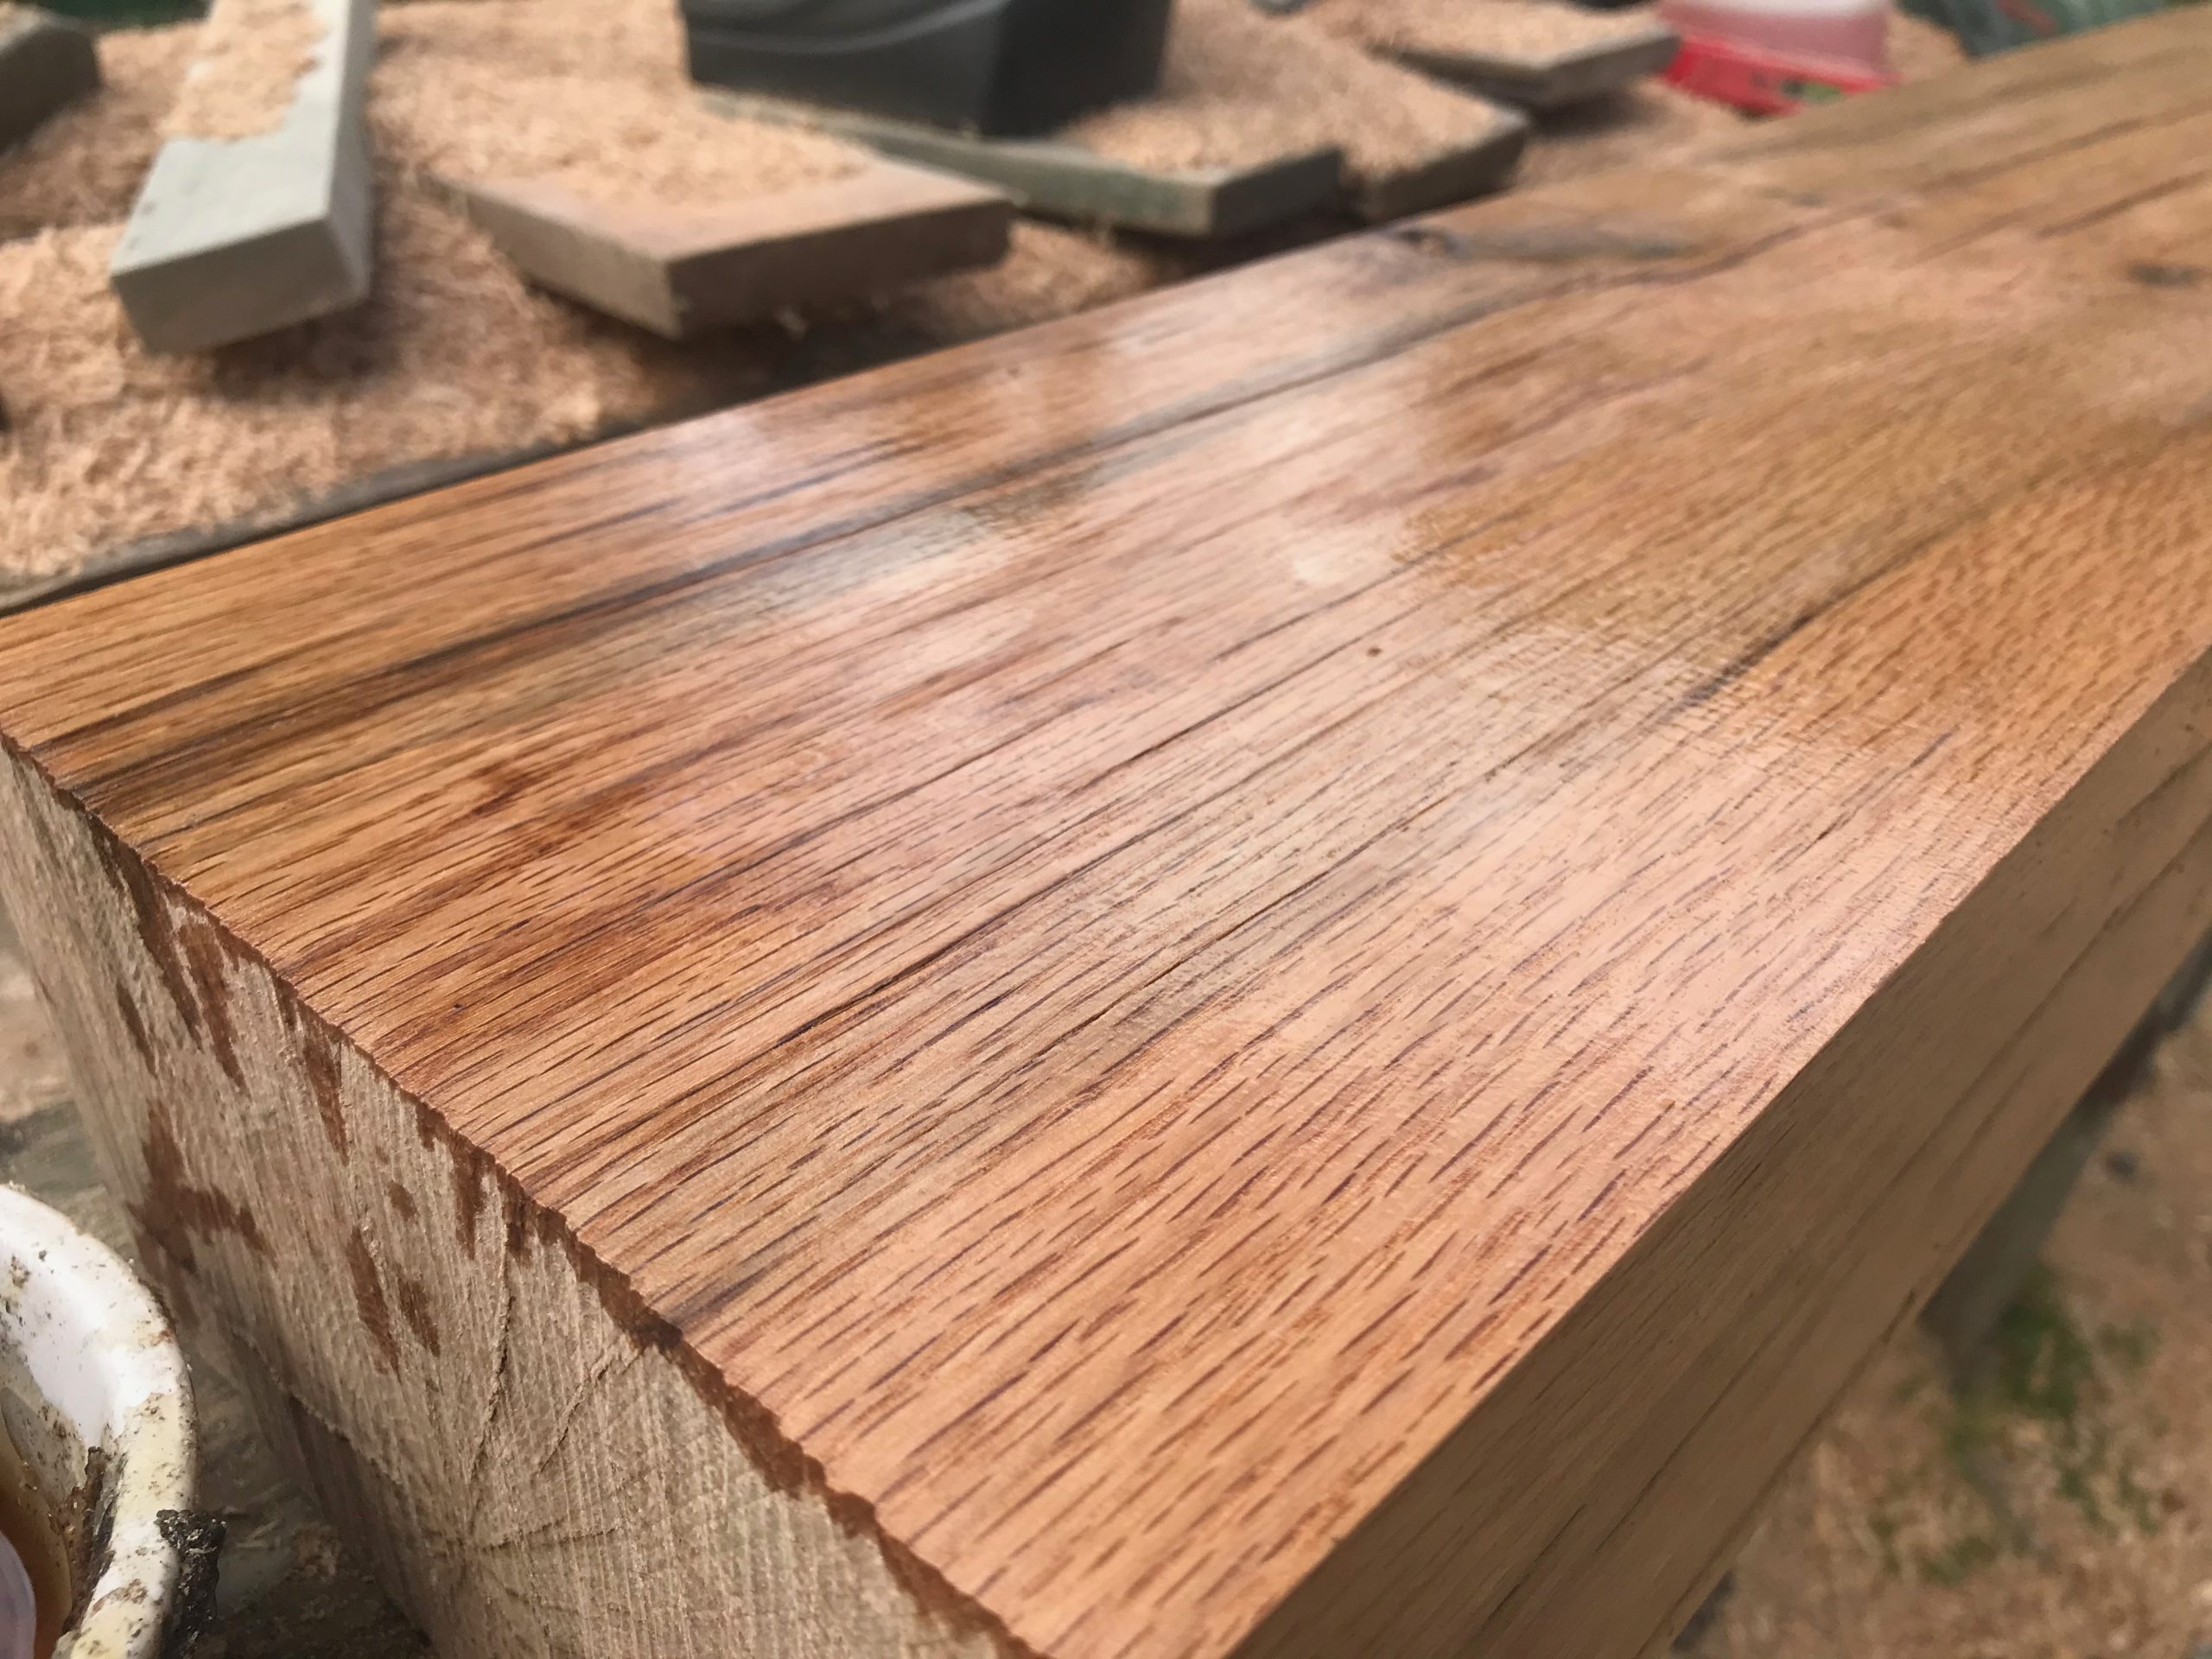
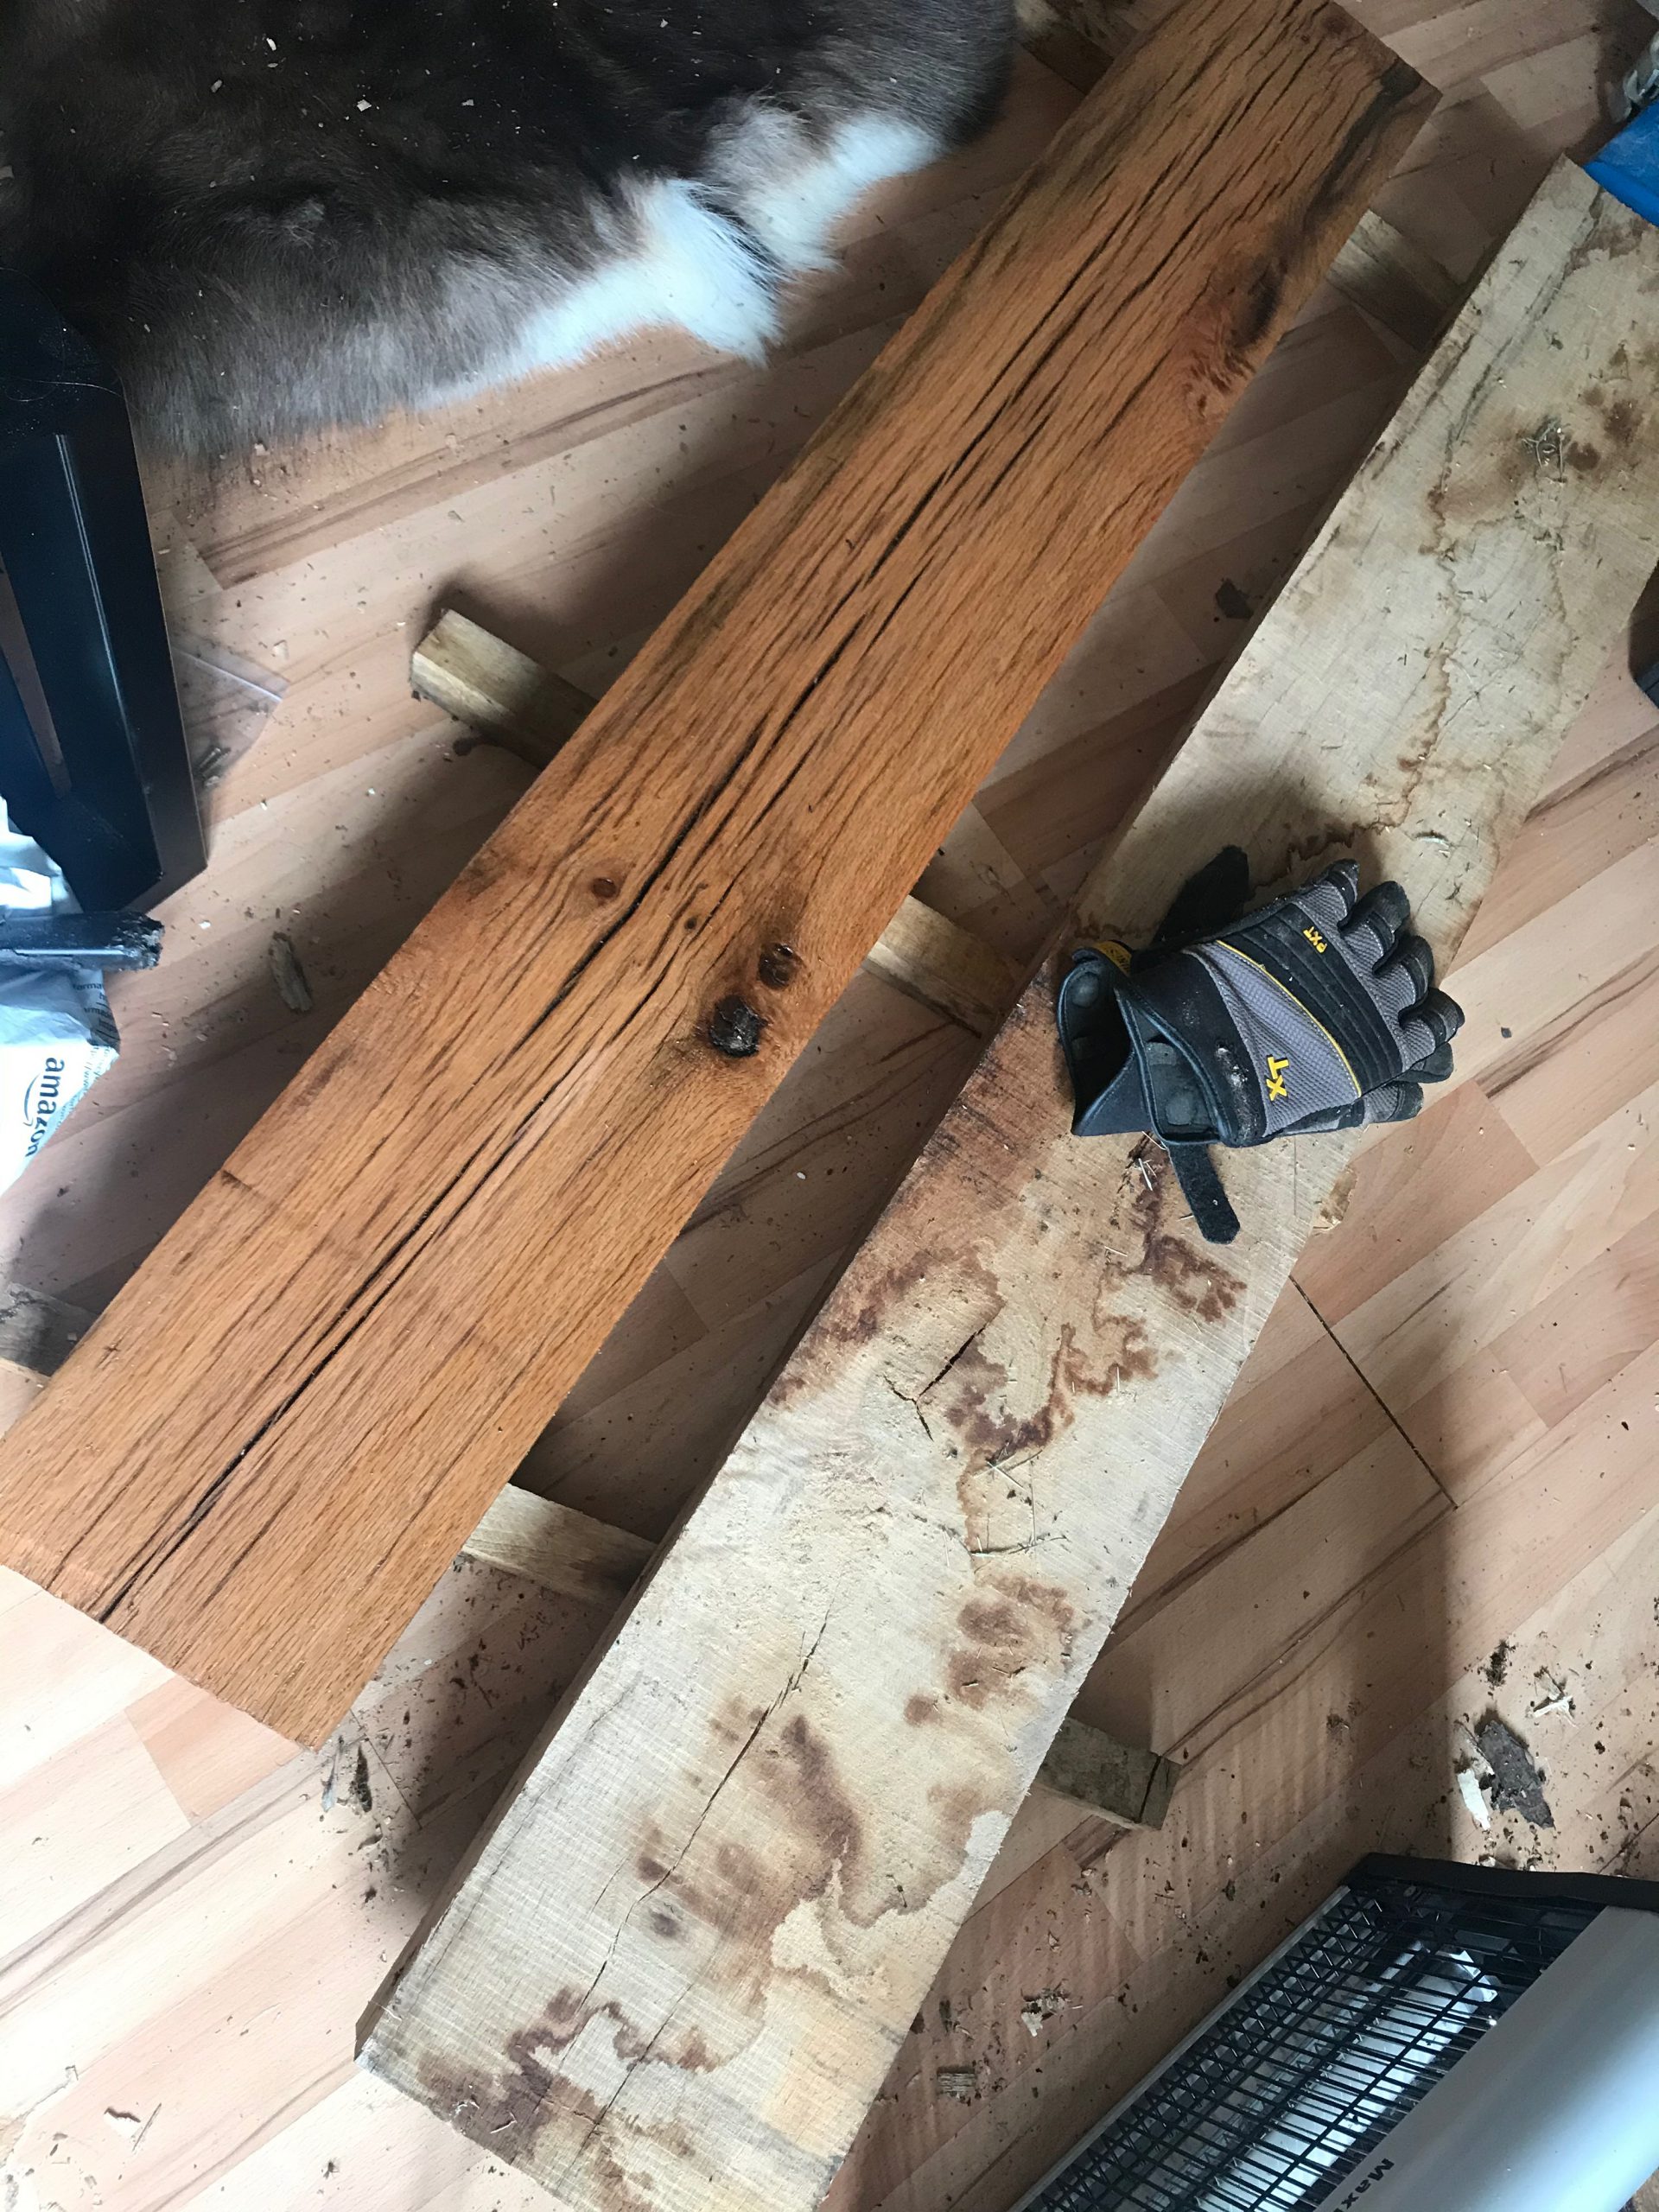
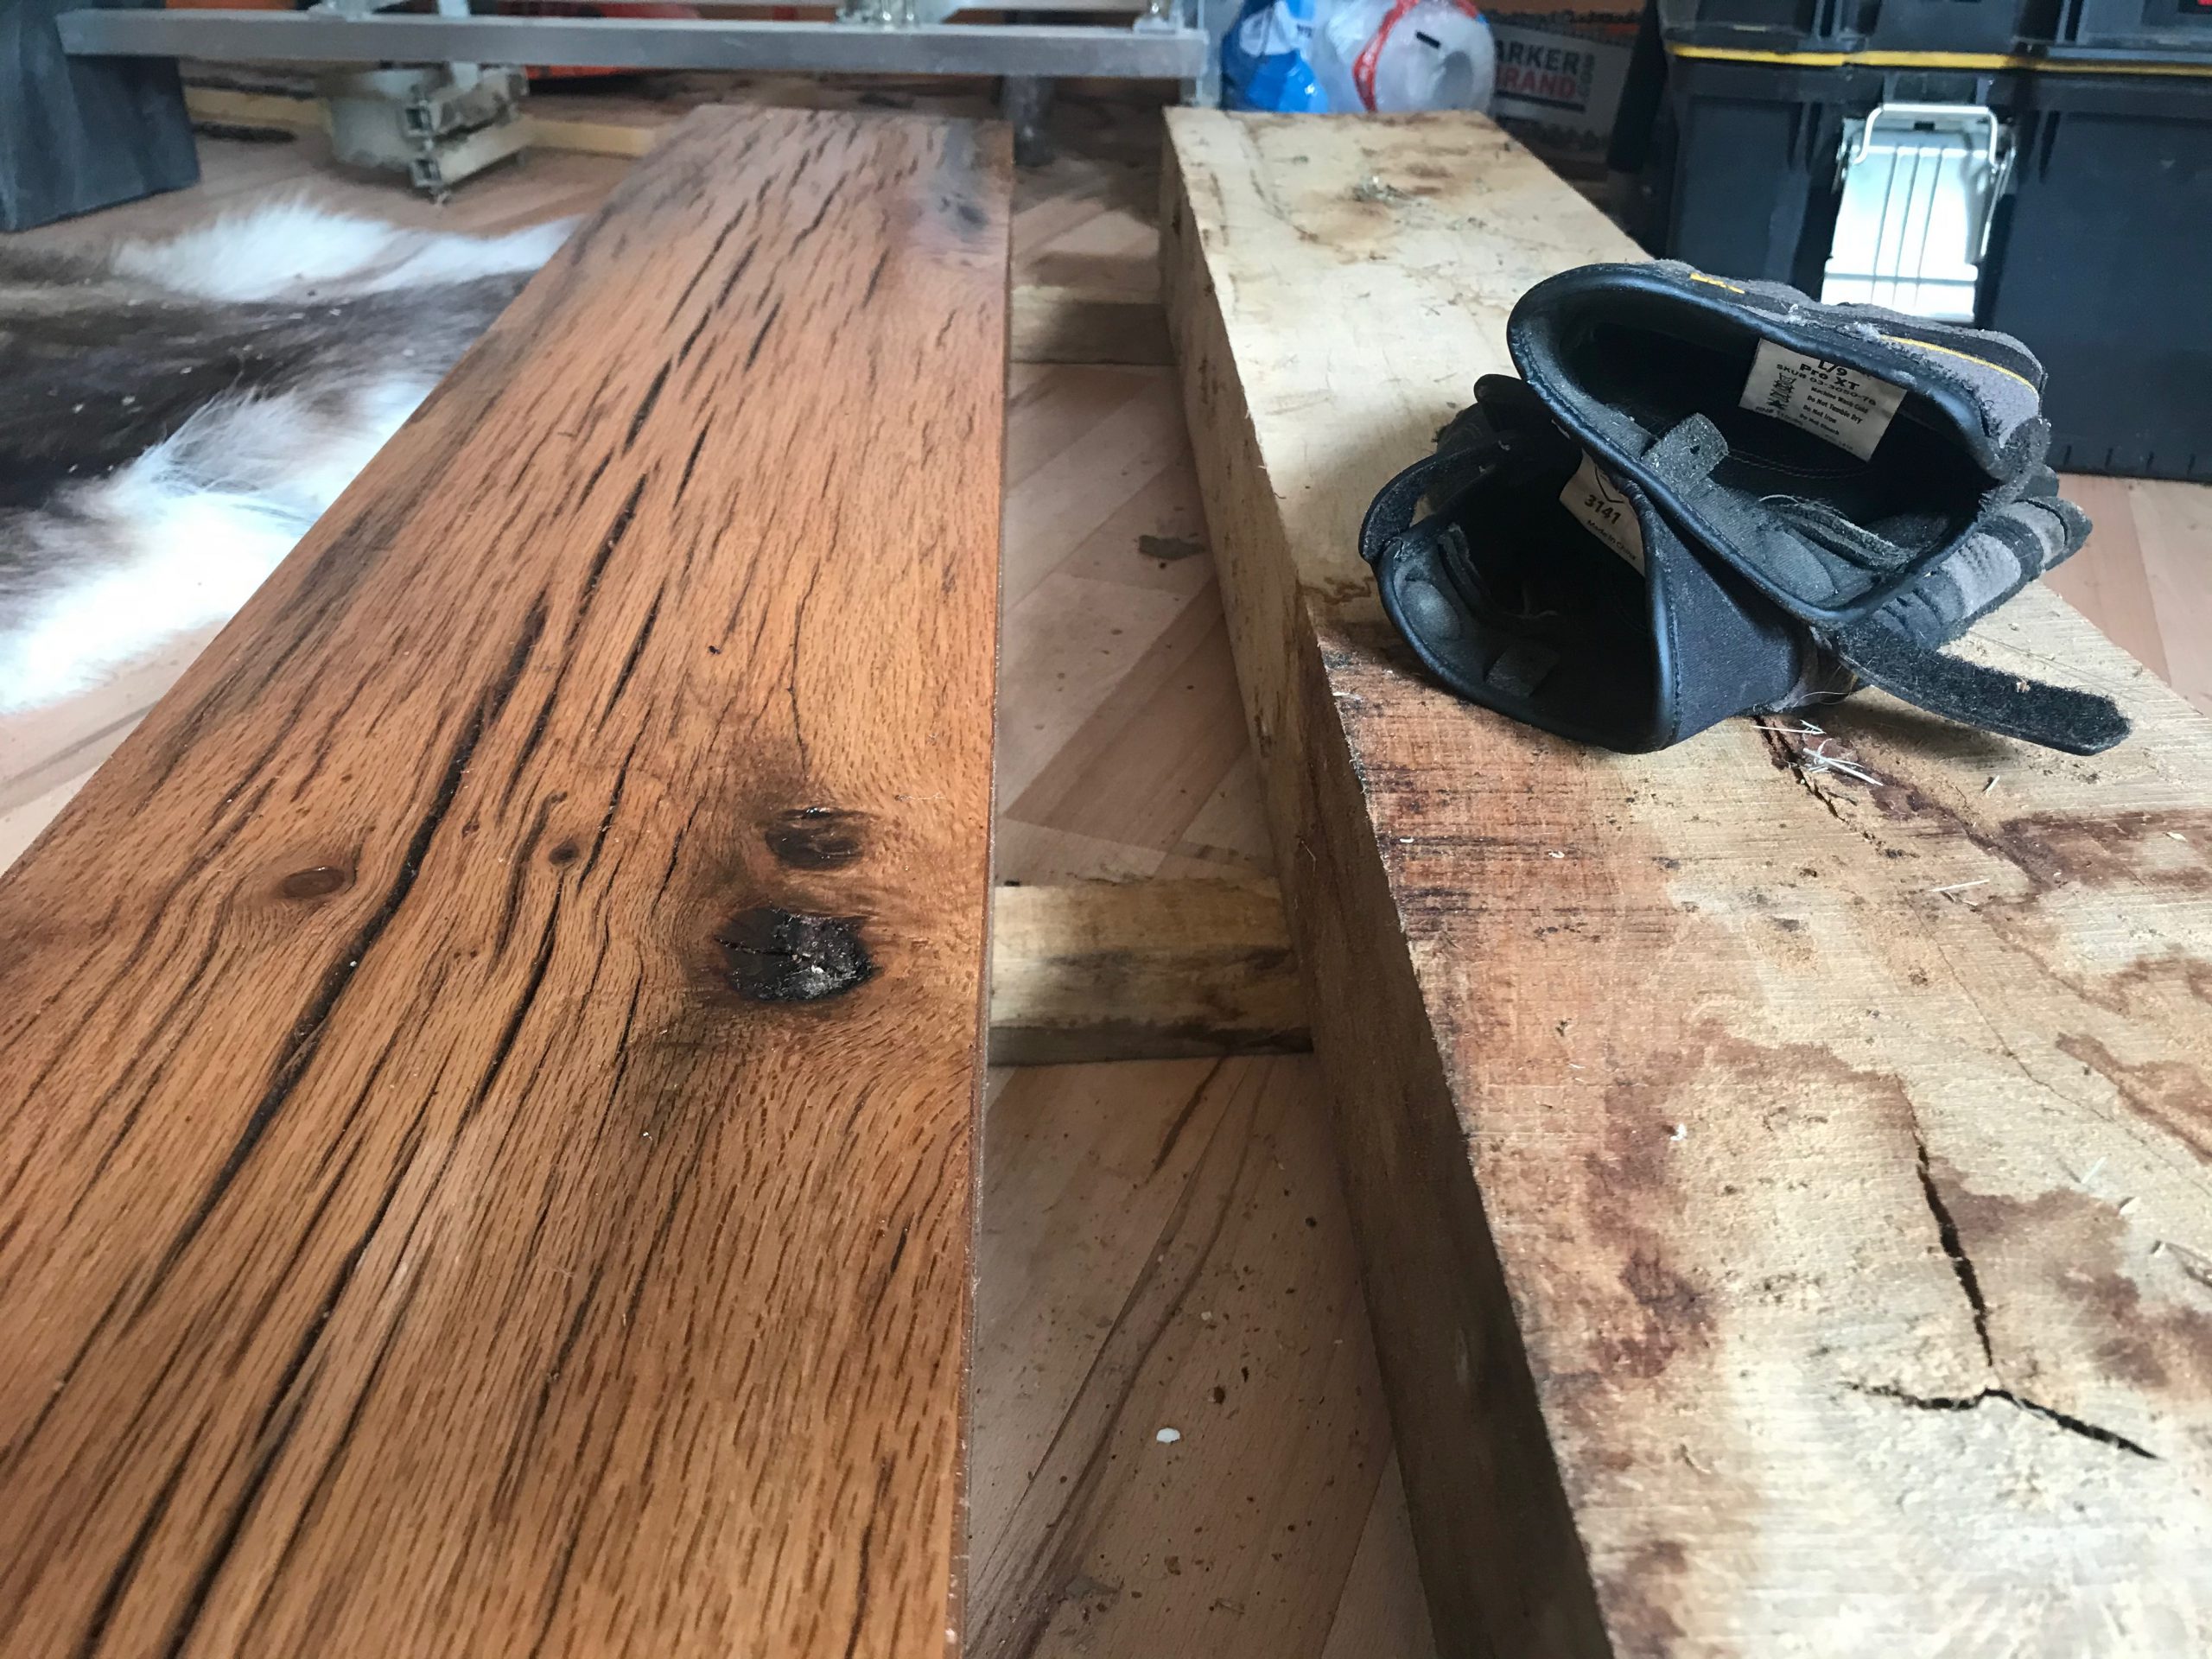
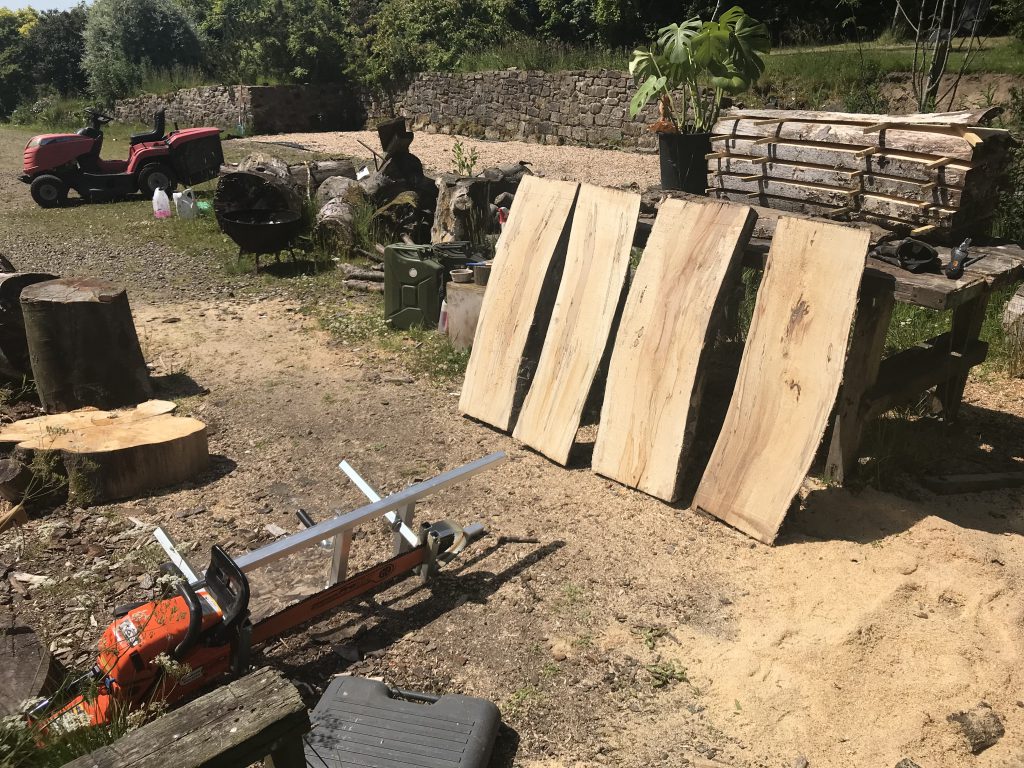
Some nice Oak Sleepers brought over by a friend, which I’m experimenting with – hopefully going to be some chunky tables, benches and maybe other things too.
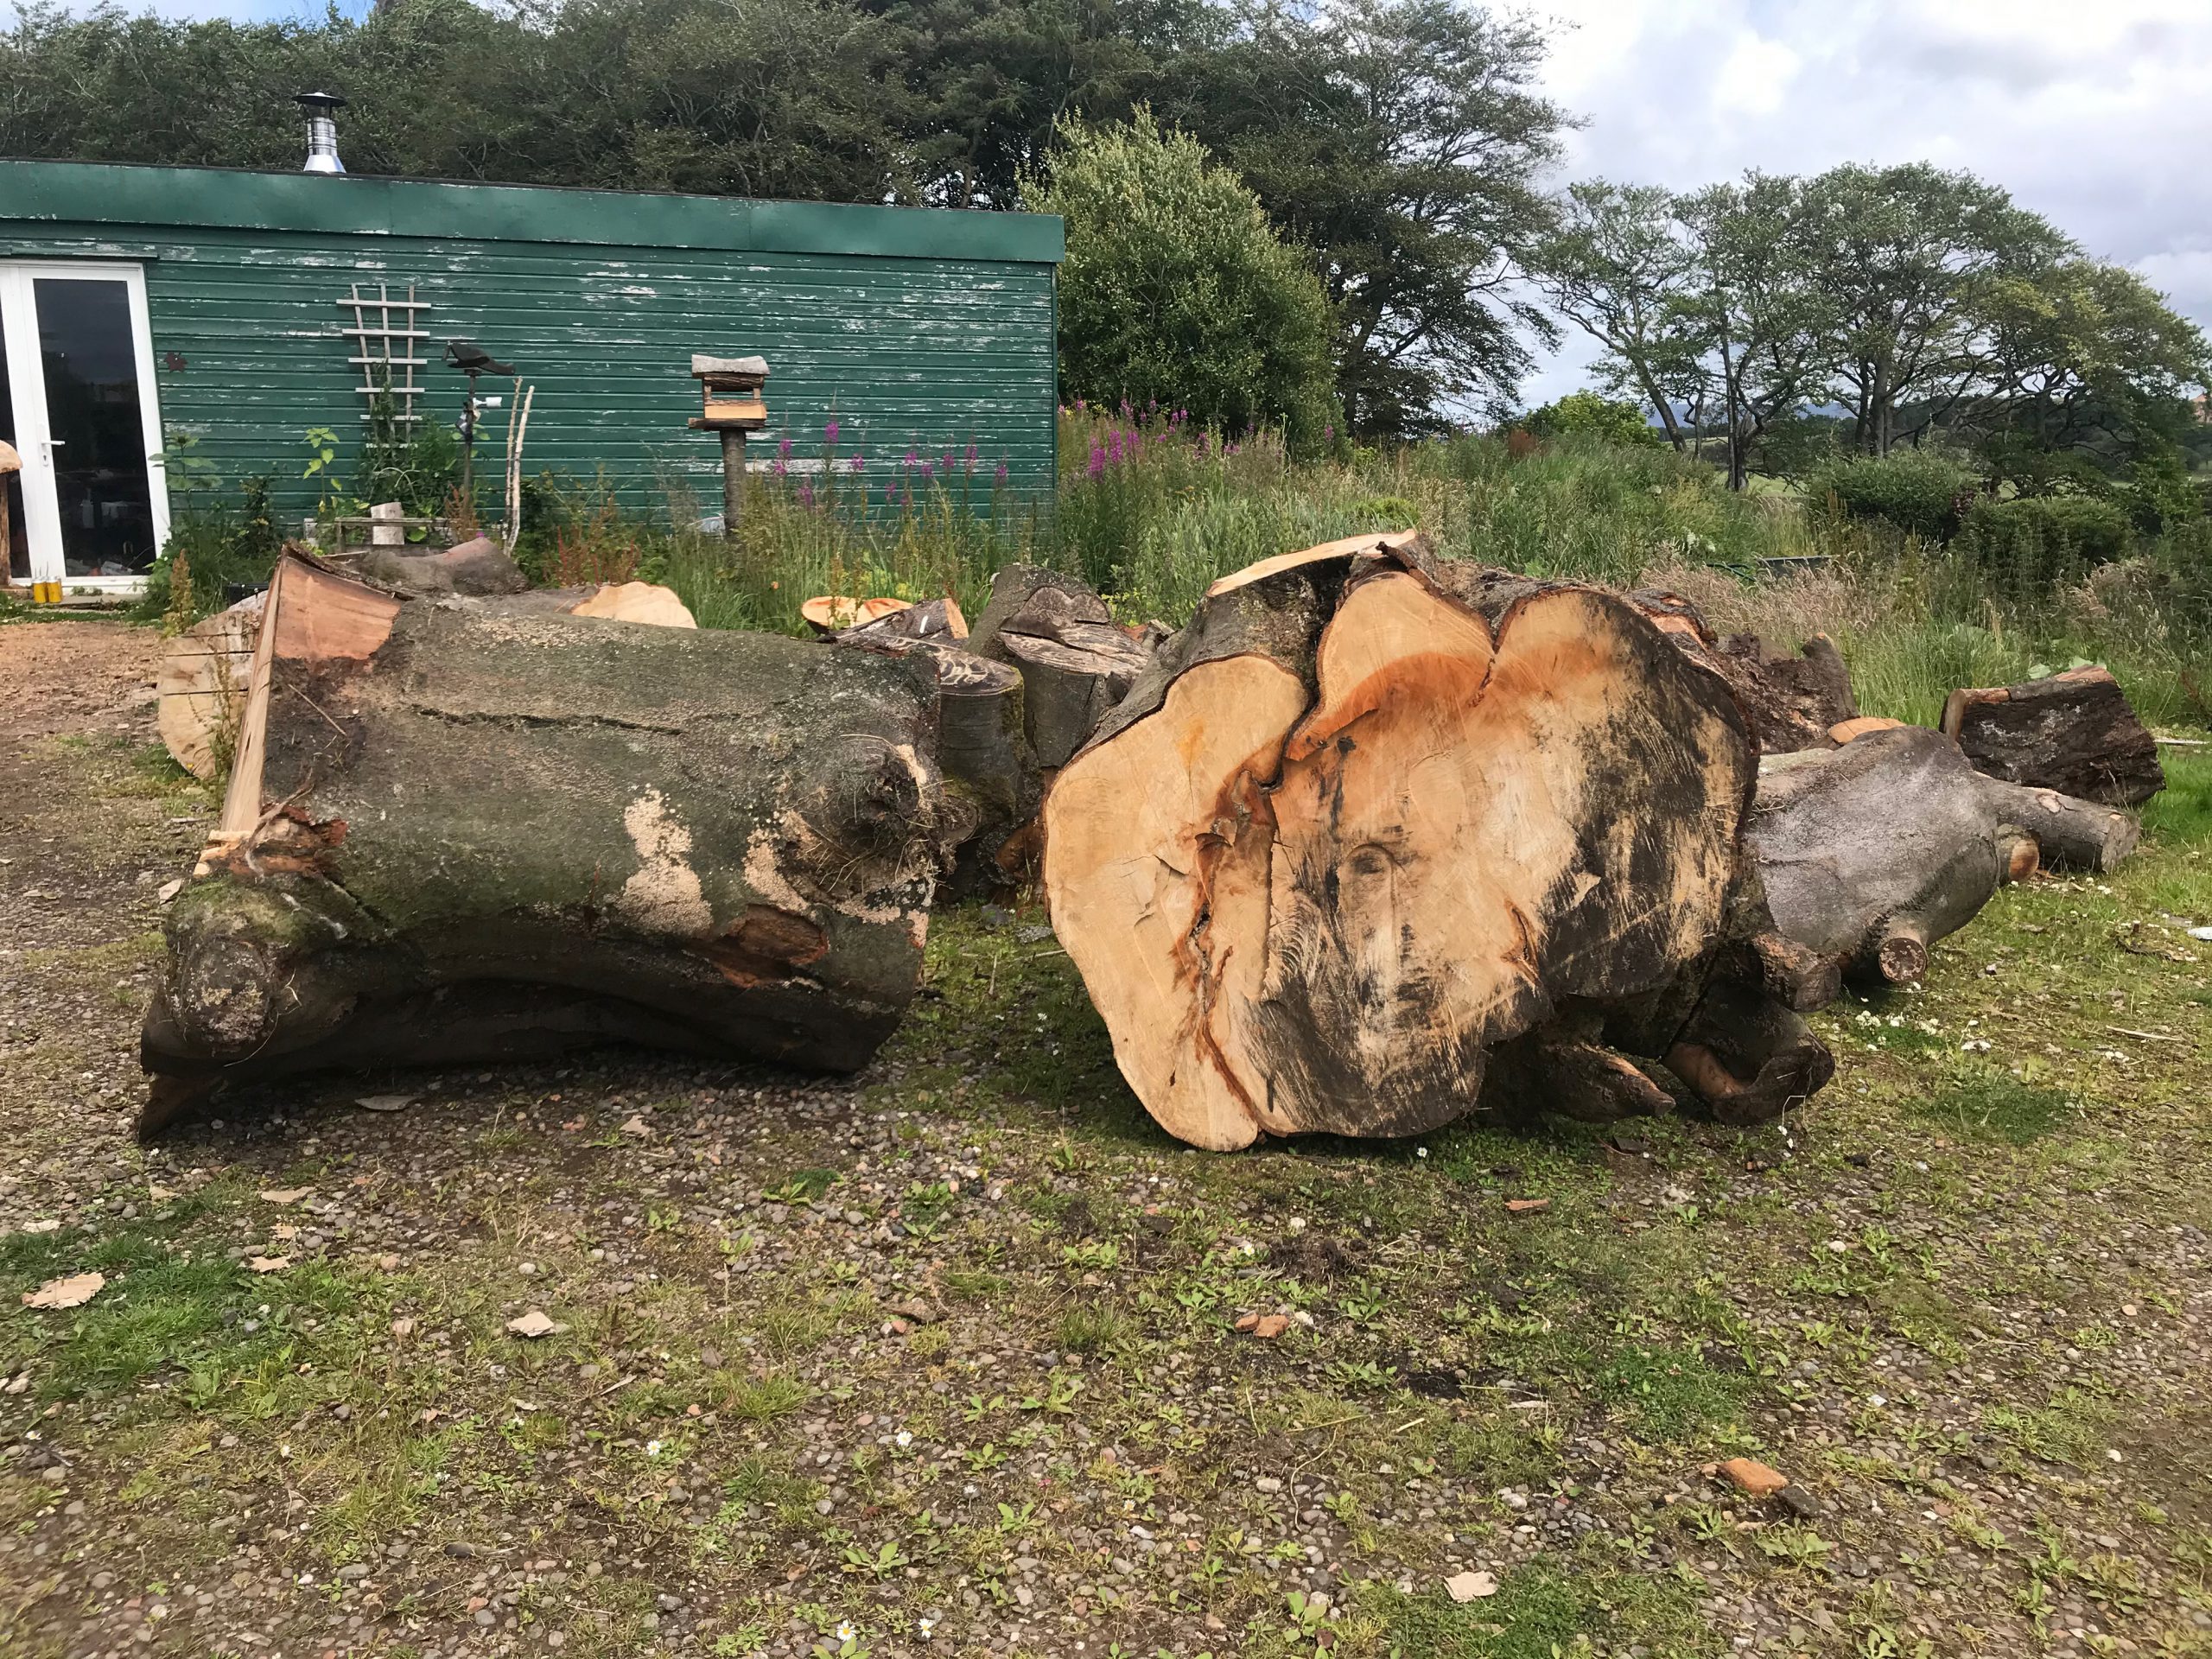
Slabs from old Beech wood that’s gone a bit soft with white rot, and some slabs from decent beech that’s been drying for about a year – more tables coming soon hopefully.
This post takes a look at setting up monitoring and alerting in Kubernetes, using Helm and Kubernetes Operators to deploy and configure Prometheus and Grafana.
This platform is quickly and easily deployed to the cluster using a Helm Chart, which in turn uses a Kubernetes Operator, to setup all of the required resources in an existing Kubernetes Cluster.
I’m re-using the Minikube Kubernetes cluster with Helm that was built and described in previous posts here and here, but the same steps should work for any working Kubernetes & Helm setup.
An example Grafana Dashboard for Kubernetes monitoring is then imported and we take a quick look at monitoring of Cluster components with other dashboards
It may sound like Helm and Operators do much the same thing, but they are different and complimentary
Helm and Operators are complementary technologies. Helm is geared towards performing day-1 operations of templatization and deployment of Kubernetes YAMLs — in this case Operator deployment. Operator is geared towards handling day-2 operations of managing application workloads on Kubernetes.
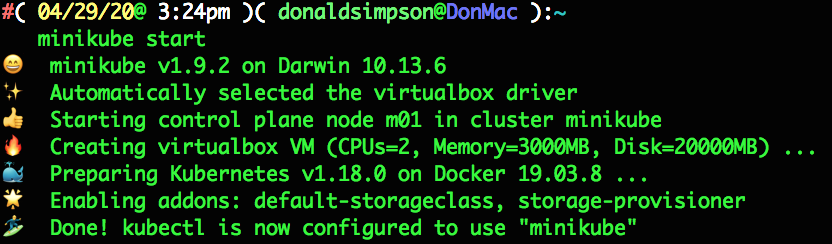
I’m reusing the Minikube cluster from previous posts, so start it back up with:
minikube start
which outputs the following in the console
🎉 minikube 1.10.1 is available! Download it: https://github.com/kubernetes/minikube/releases/tag/v1.10.1 💡 To disable this notice, run: ‘minikube config set WantUpdateNotification false’
🙄 minikube v1.9.2 on Darwin 10.13.6 ✨ Using the virtualbox driver based on existing profile 👍 Starting control plane node m01 in cluster minikube 🔄 Restarting existing virtualbox VM for “minikube” … 🐳 Preparing Kubernetes v1.18.0 on Docker 19.03.8 … 🌟 Enabling addons: dashboard, default-storageclass, helm-tiller, metrics-server, storage-provisioner 🏄 Done! kubectl is now configured to use “minikube”
this all looks ok, and includes the minikube addons I’d selected previously. Now a quick check to make sure my local helm repo is up to date:
helm repo update
I then used this command to find the latest version of the stable prometheus-operator via a helm search: helm search stable/prometheus-operator --versions | head -2
there’s no doubt a neater/builtin way to find out the latest version, but this did the job – I’m going to install 8.13.8:
install the prometheus operator using Helm, in to a new dedicated “monitoring” namespace just takes this one command: helm install stable/prometheus-operator --version=8.13.8 --name=monitoring --namespace=monitoring
Ooops
that should normally be it, but for me, this resulted in some issues along these lines:
Error: Get http://localhost:8080/version?timeout=32s: dial tcp 127.0.0.1:8080: connect: connection refused
– looks like Helm can’t communicate with Tiller any more; I confirmed this with a simple helm ls which also failed with the same message. This shouldn’t be a problem when v3 of Helm goes “tillerless”, but to fix this quickly I simply re-enabled Tiller in my cluster via Minikube Addons:
verified things worked again with helm ls, then the helm install... command worked and started to do its thing…
New Operator and Namespace
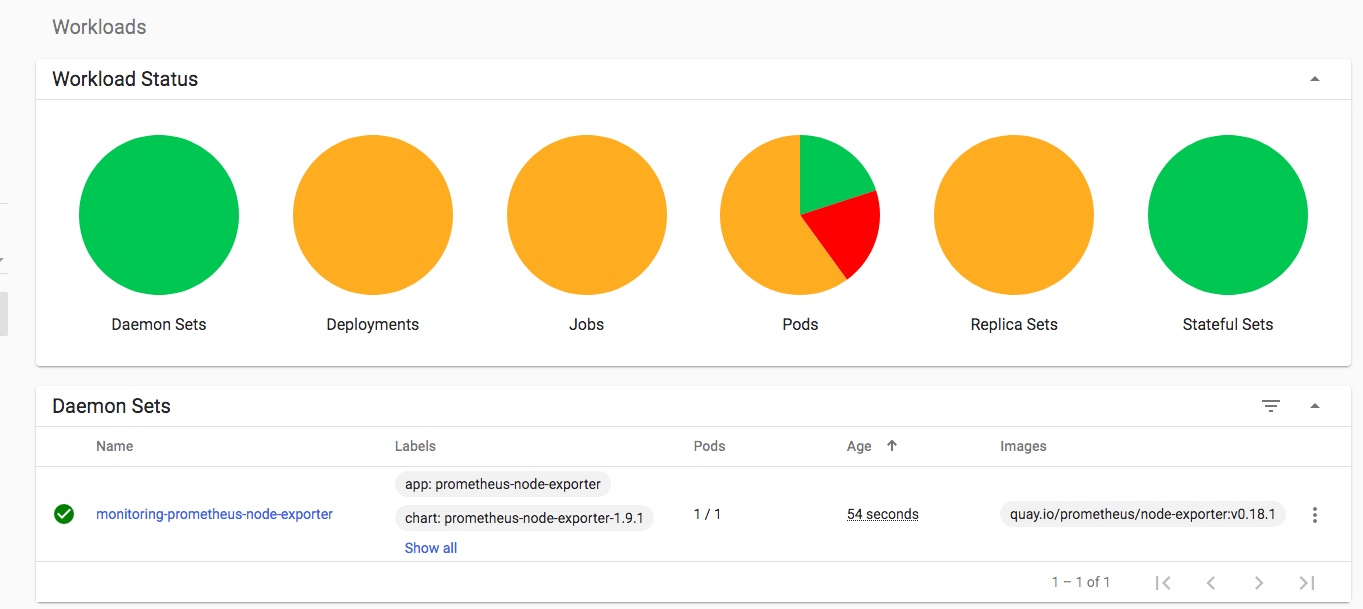
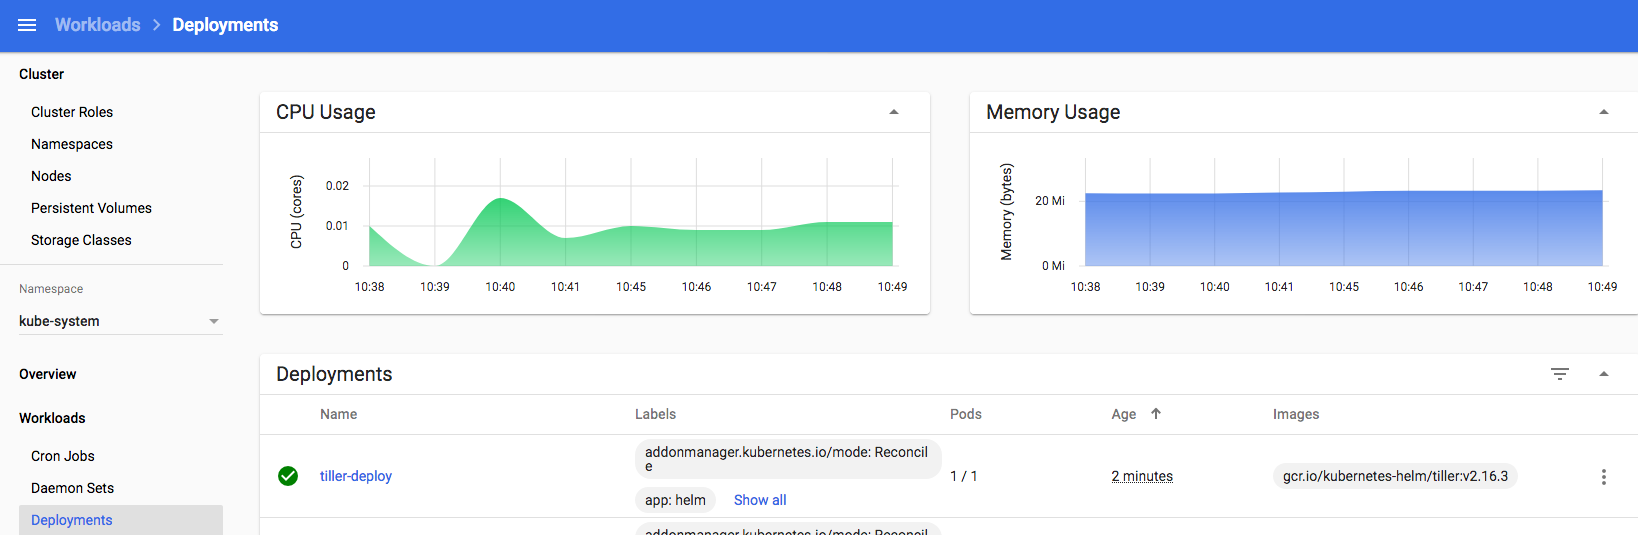
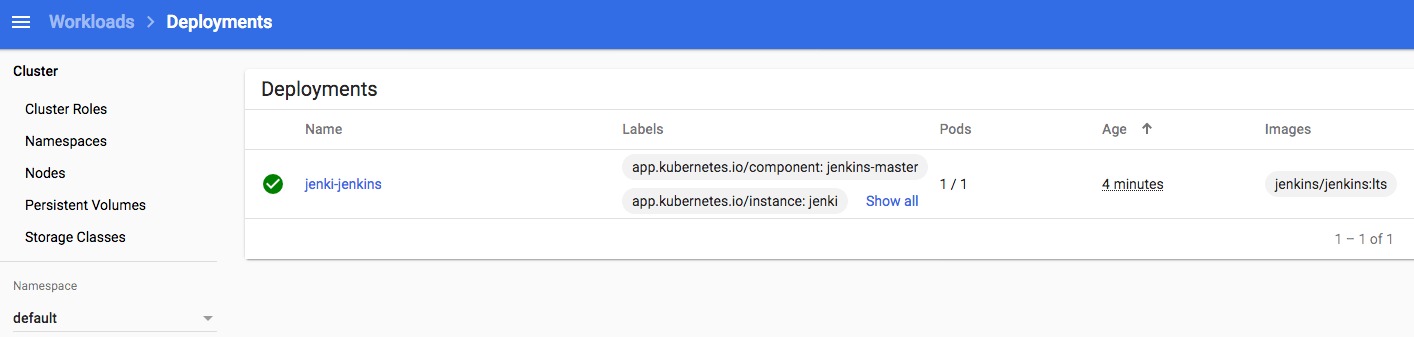
Keeping an eye on progress in my k8s dashboard, I can see the new “monitoring” namespace has been created, and the various Operator components are being downloaded, started up and configured:
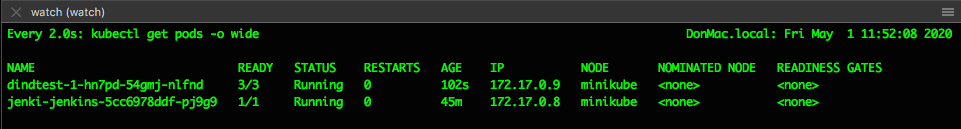
you can also keep an eye on progress with: watch -d kubectl get po --namespace=monitoring
this takes a while on my machine, but eventually completes with this console output:
NOTES: The Prometheus Operator has been installed. Check its status by running: kubectl –namespace monitoring get pods -l “release=monitoring”
Visit https://github.com/coreos/prometheus-operator for instructions on how to create & configure Alertmanager and Prometheus instances using the Operator.
kubectl get po --namespace=monitoring shows the pods now running in the cluster, and for this quick example the easiest way to get access to the new Grafana instance is to forward the pods port 3000 to localhost like this:
the default user for this Grafana is “admin” and the password for that user is “prom-operator“, so log in with those credentials…
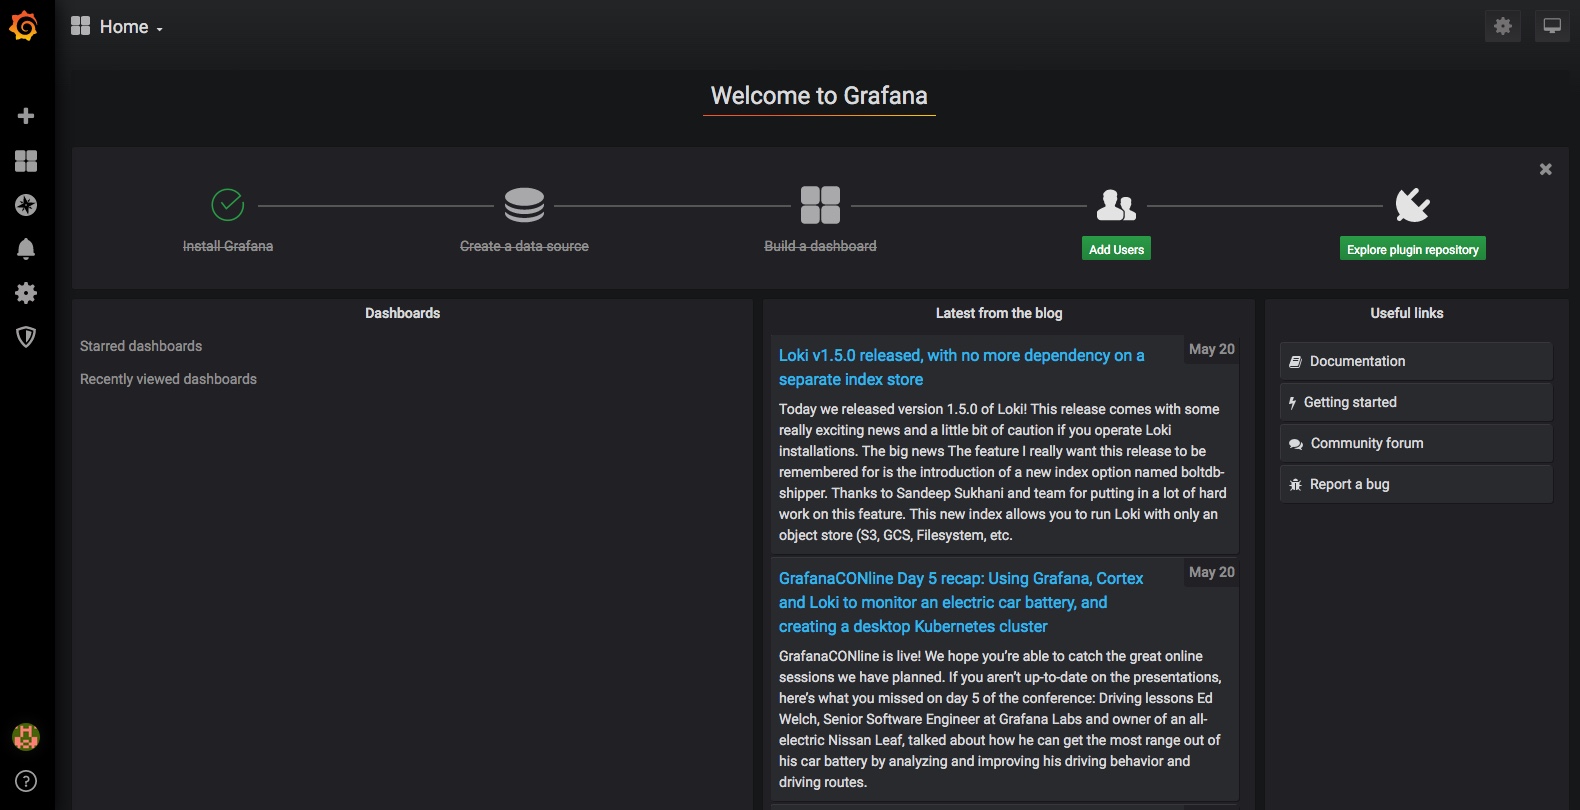
Grafana Dashboards for Kubernetes
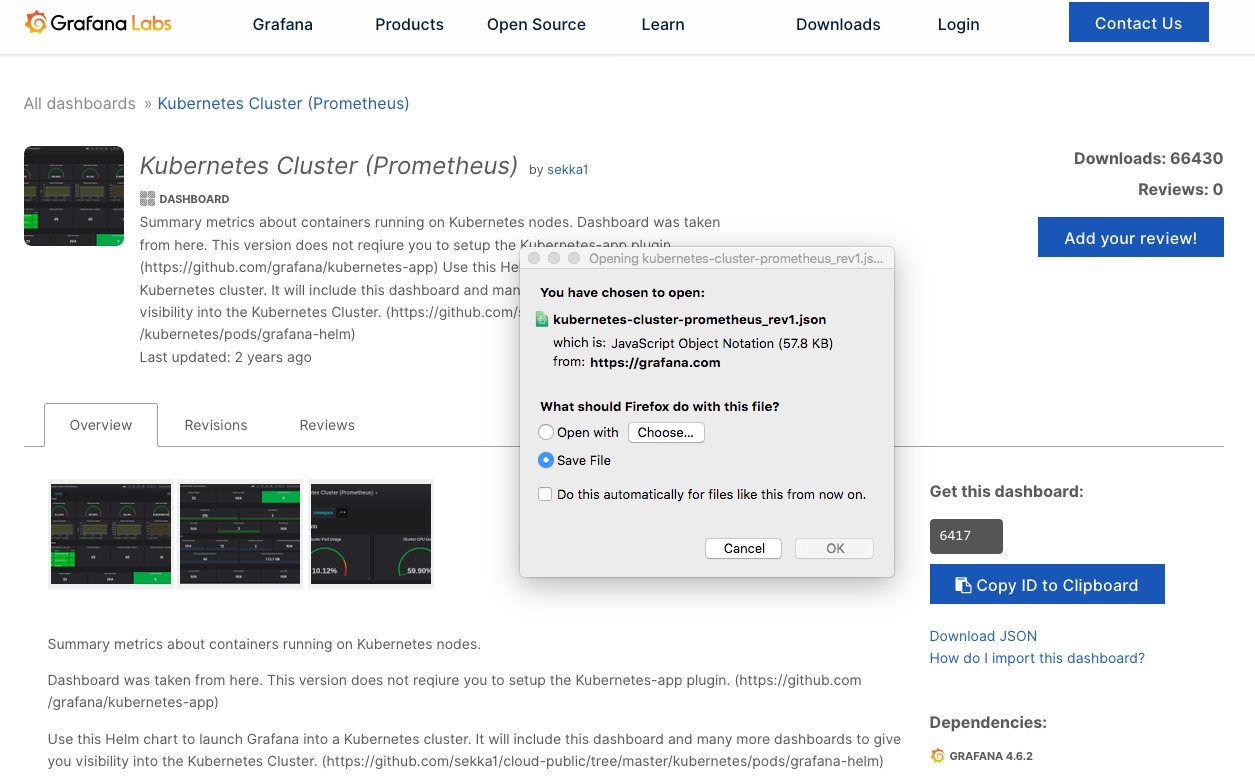
We can now use the ready-made Grafana dashboards, or add/import ones from the extensive online collection, like this one here for example: https://grafana.com/grafana/dashboards/6417 – simply save the JSON file
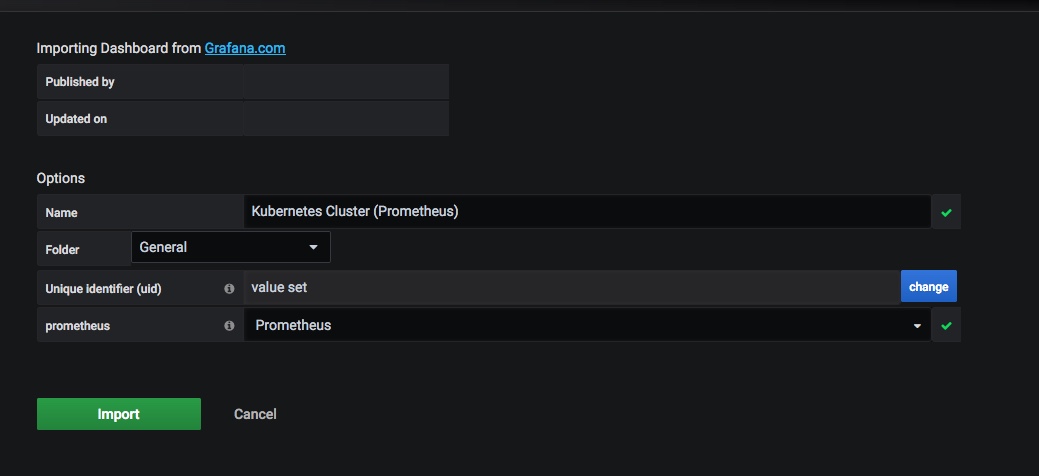
then go to Grafana and import it with these settings:
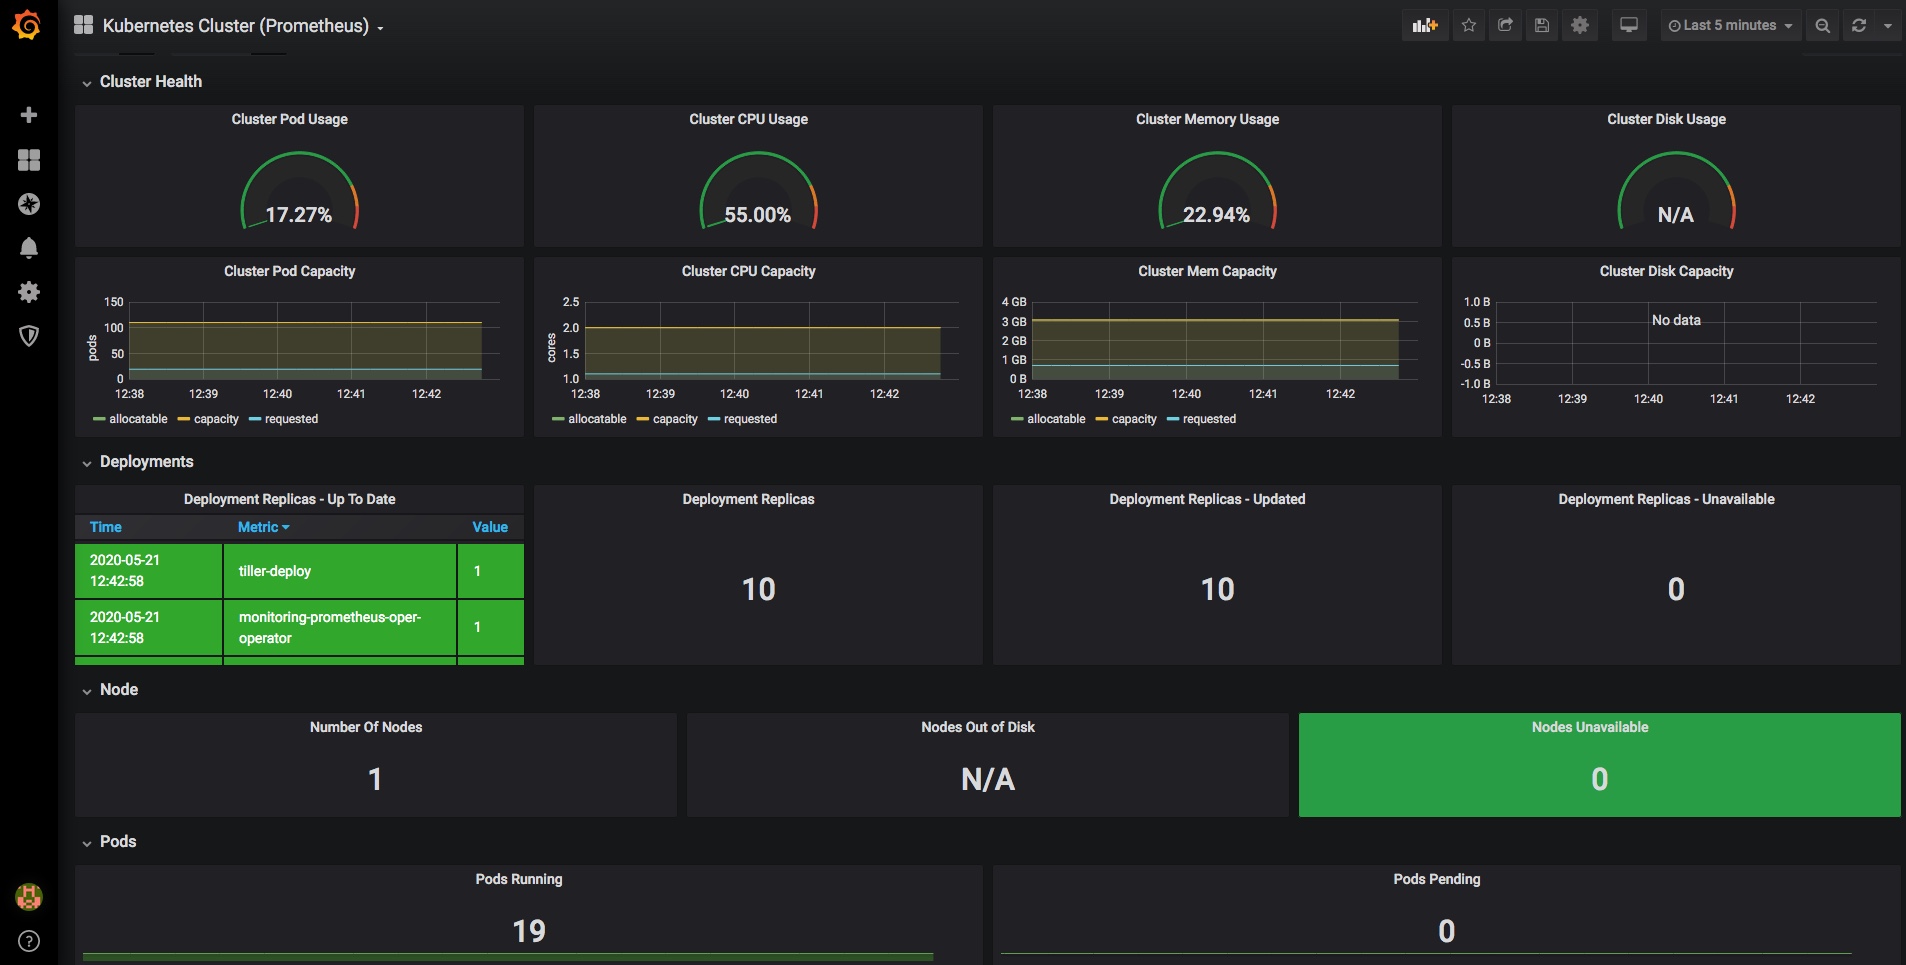
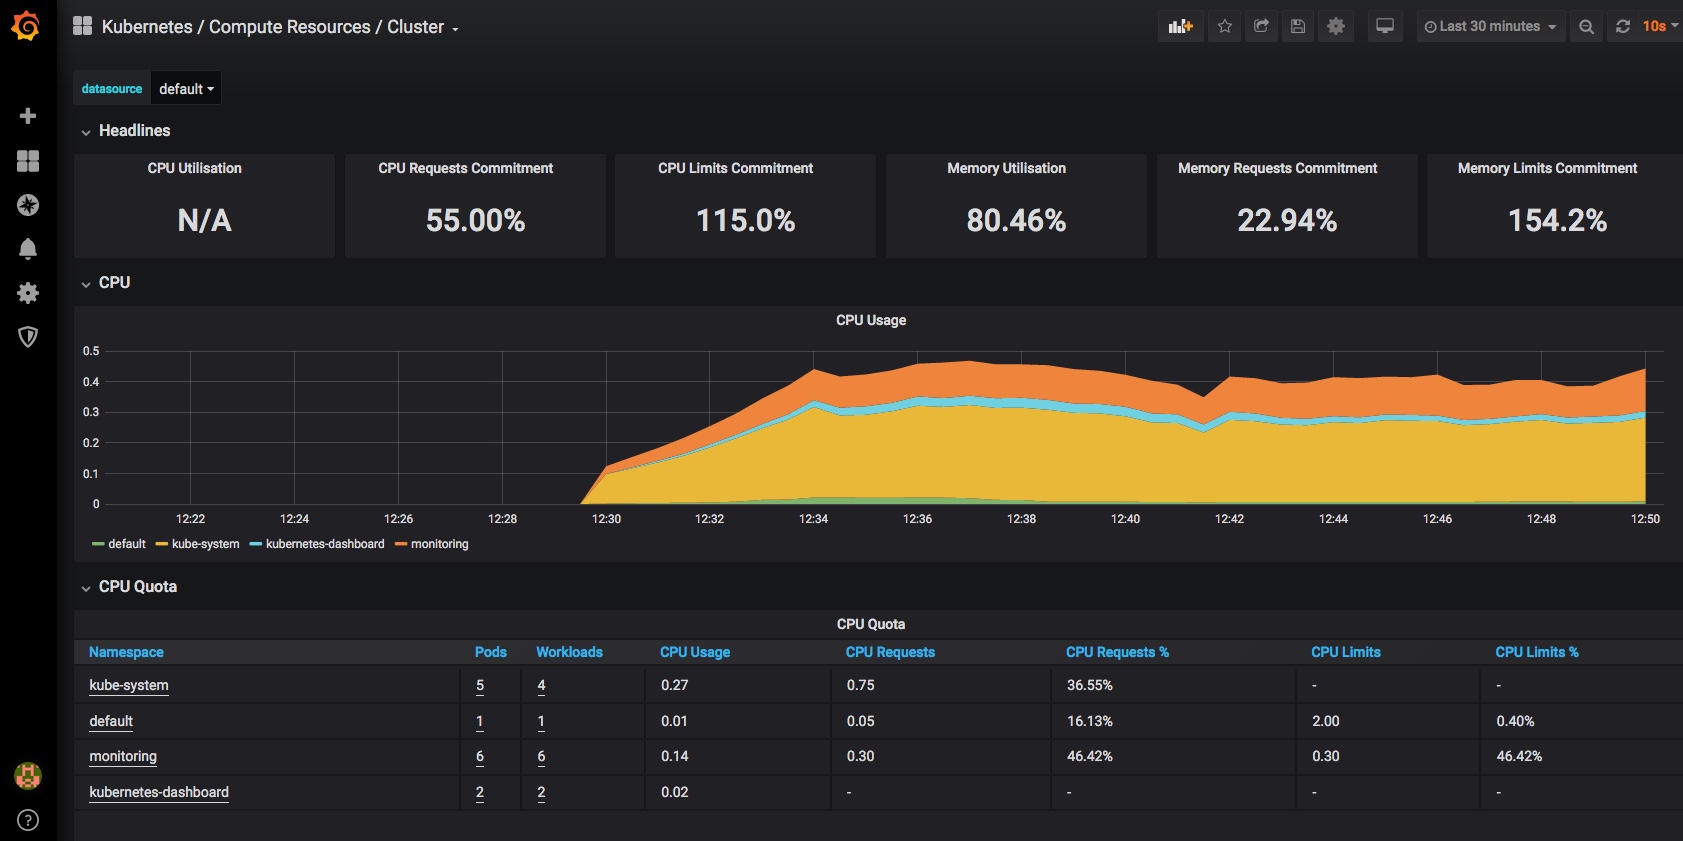
and you should now have a dashboard showing some pretty helpful stats on your kubernetes cluster, it’s health and resource usage:
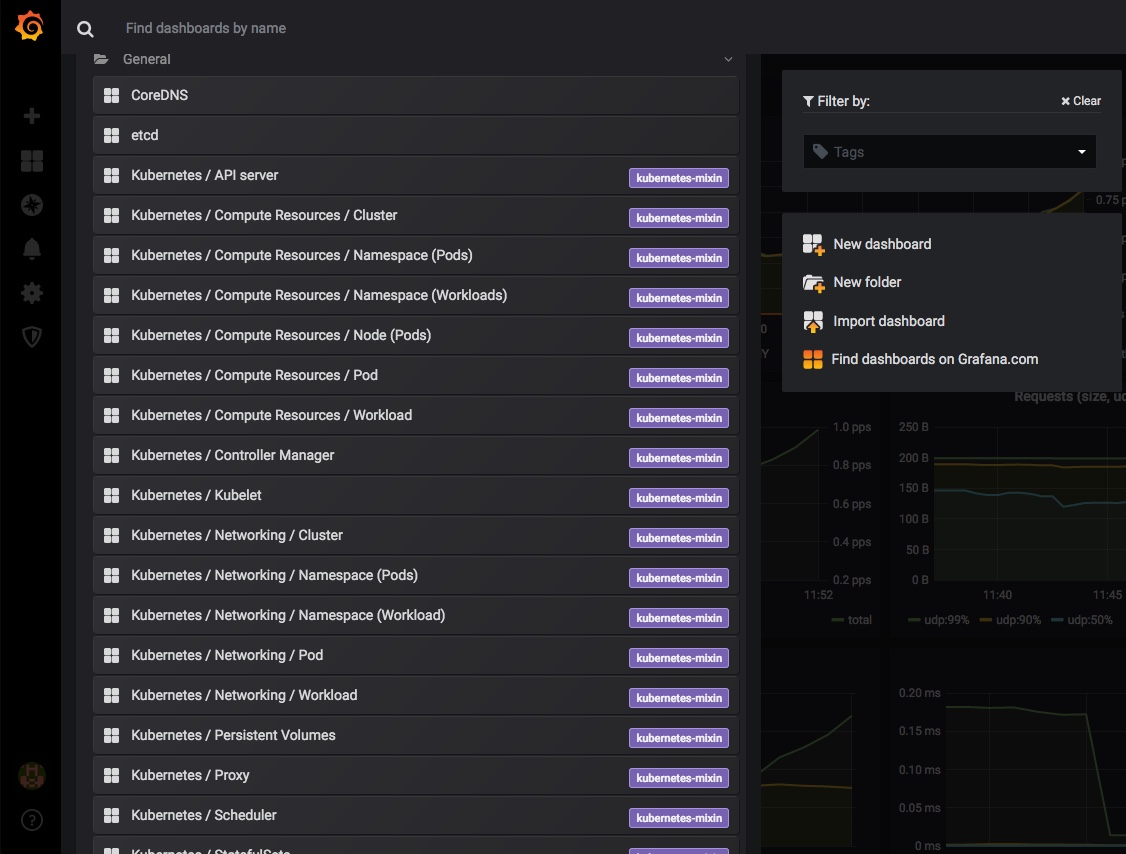
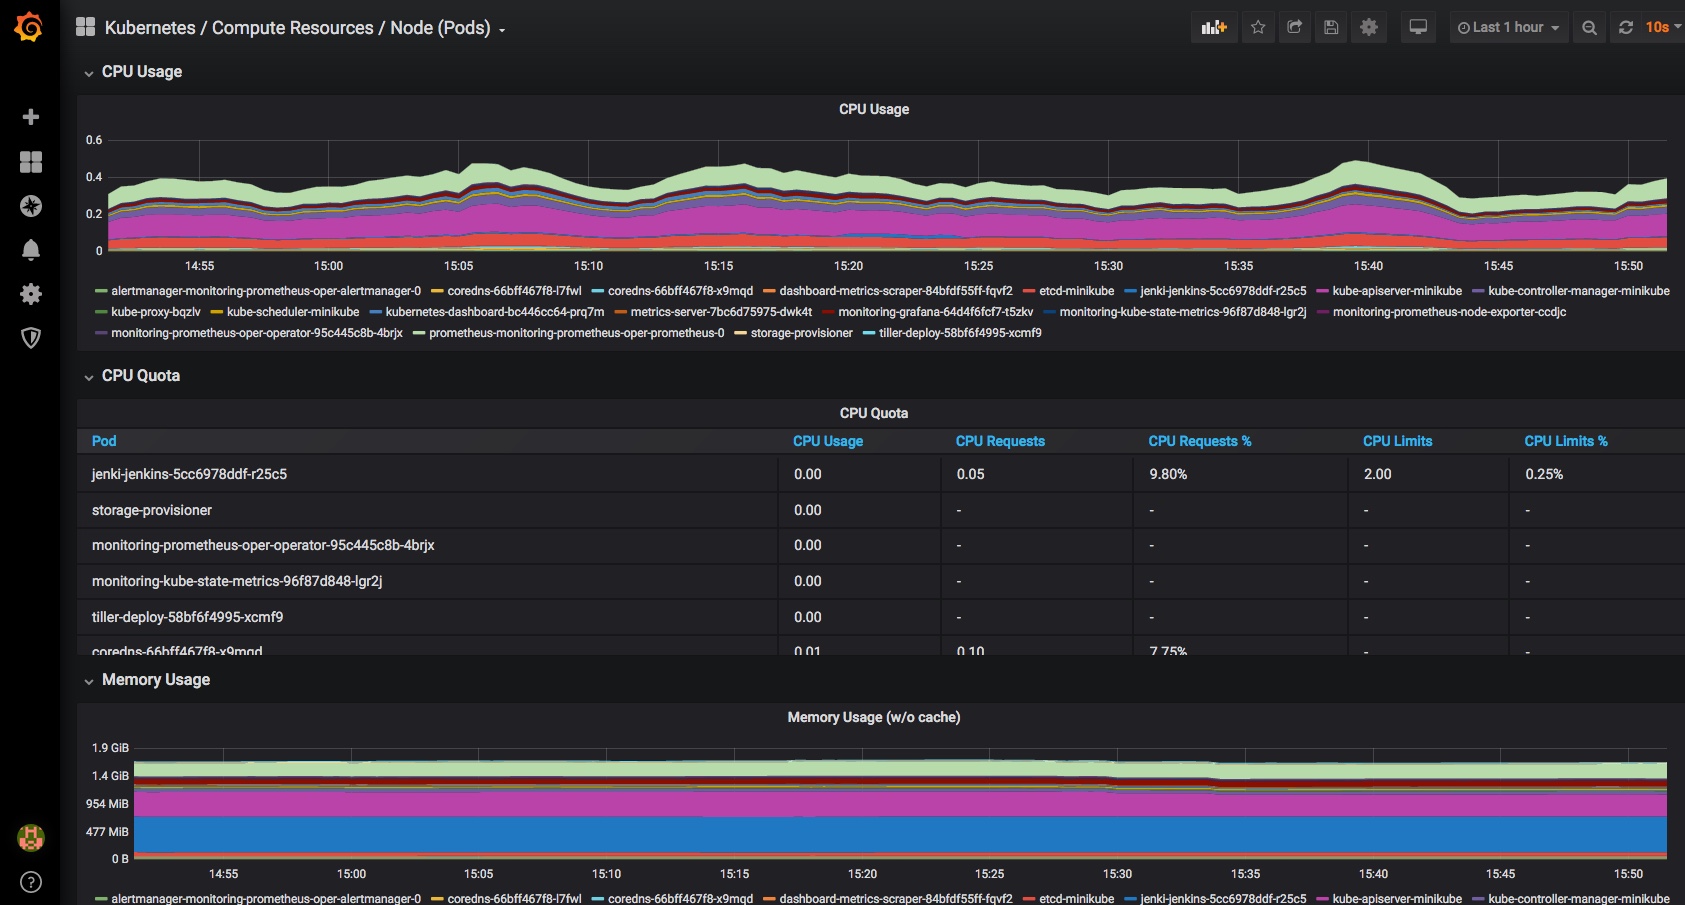
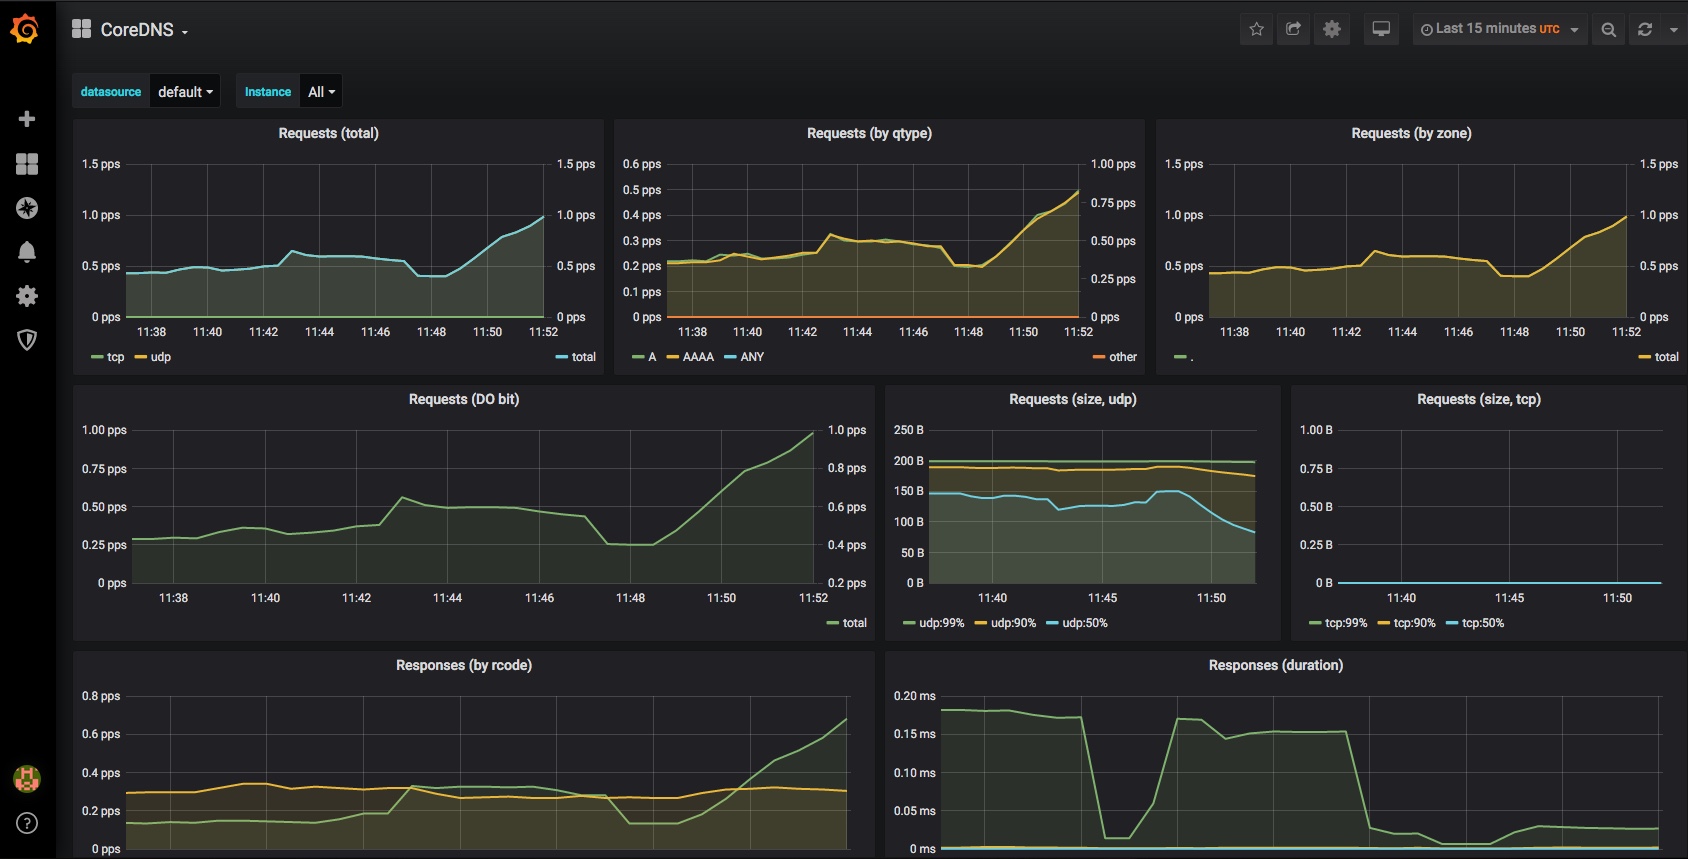
Finally a very quick look at some of the other inbuilt dashboards – you can use and adjust these to monitor all of the components that comprise your cluster and set up alerting when limits or triggers are reached:
All done & next steps
There’s a whole lot more that can be done here, and many other ways to get to this point, but I found this pretty quick and easy.
I’ve only been looking at monitoring of k8s resources here, but you can obviously set up grafana dashboards for many other things, like monitoring your deployed applications. Many applications (and charts and operators) come with prom endpoints built in, and can easily and automatically be added to your monitoring and alerting dashboards along with other datasources.
That post went as far as having a Kubernetes cluster up and running for local development. That was primarily focused on Mac, but once you reach the point of having a running Kubernetes Cluster with kubectl configured to talk to it, the hosting platform/OS makes little difference.
This second section takes a more detailed look at running Jenkins Pipelines inside the Kubernetes Cluster, and automatically provisioning Jenkins JNLP Agents via Kubernetes, then takes an in-depth look at what we can do with all of that, with a complete working example.
This post covers quite a lot:
Adding Helm to the Kubernetes cluster for package management
Deploying Jenkins on Kubernetes with Helm
Connecting to the Jenkins UI
Setting up a first Jenkins Pipeline job
Running our pipeline and taking a look at the results
What Next
Adding Helm to the Kubernetes cluster for package management
Helm is a package manager for Kubernetes, and like Minikube it is ideal for quickly setting up development environments, plus much more if you want to. Take a look through the Helm hub to see just some of the other things it can do.
On Mac you can use brew to install the local helm component:
you should then see a tiller pod start up in your Kubernetes kube-system namespace:
Before you can use Helm we first need to initialise the local Helm client, so simply run:
helm init --client-only
as our earlier minikube addons command has configured the connectivity and cluster already. Before we can use Helm to install Jenkins (or any of the many other things it can do), we need to update the local repo that contains the Helm Charts:
helm repo update
Hang tight while we grab the latest from your chart repositories…
…Skip local chart repository
…Successfully got an update from the "stable" chart repository
Update Complete.
That should be Helm setup complete and ready to use now.
Deploying Jenkins on Kubernetes with Helm
Now that Helm is setup and can speak to our k8s instance, installing 100’s of software packages suddenly becomes very simple – including, Jenkins. We’ll just give the install a friendly name “jenki” and use NodePort to simplify the networking, nothing more is required for this dev setup:
obviously we’re skipping over all the for-real things you may want for a longer lived Jenkins instance, like backups, persistence, resilience, authentication and authorisation etc., but this bare-bones setup is sufficient for now.
Connect to the Jenkins UI
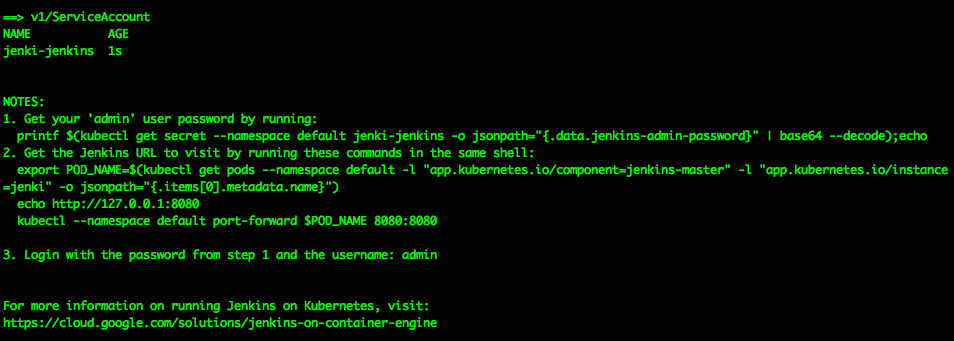
The Helm install should spit out some helpful info like this, explaining how to get the Jenkins Admin password and how to connect to the UI:
Get your ‘admin’ user password by running: printf $(kubectl get secret –namespace default jenki-jenkins -o jsonpath=”{.data.jenkins-admin-password}” | base64 –decode);echo
Get the Jenkins URL to visit by running these commands in the same shell: export POD_NAME=$(kubectl get pods –namespace default -l “app.kubernetes.io/component=jenkins-master” -l “app.kubernetes.io/instance=jenki” -o jsonpath=”{.items[0].metadata.name}”) echo http://127.0.0.1:8080 kubectl –namespace default port-forward $POD_NAME 8080:8080
Login with the password from step 1 and the username: admin
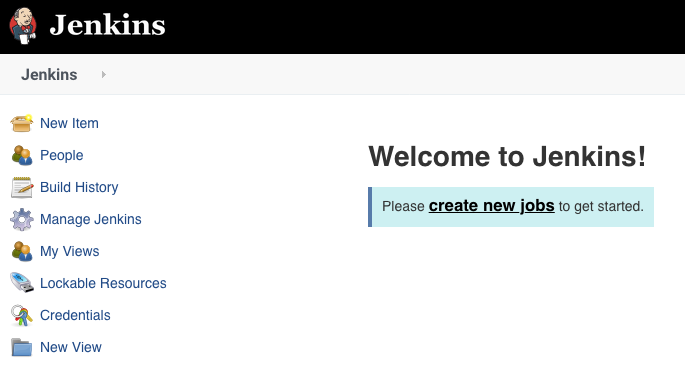
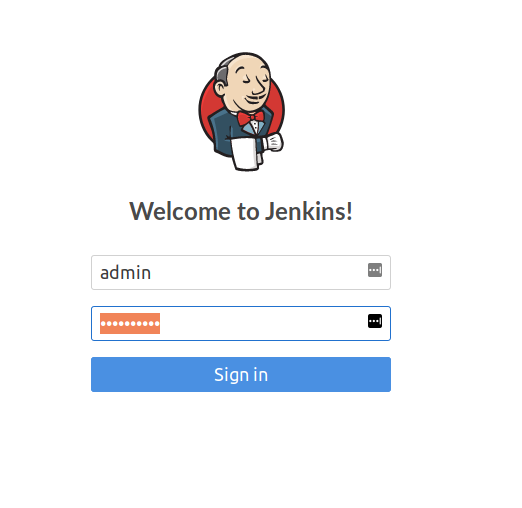
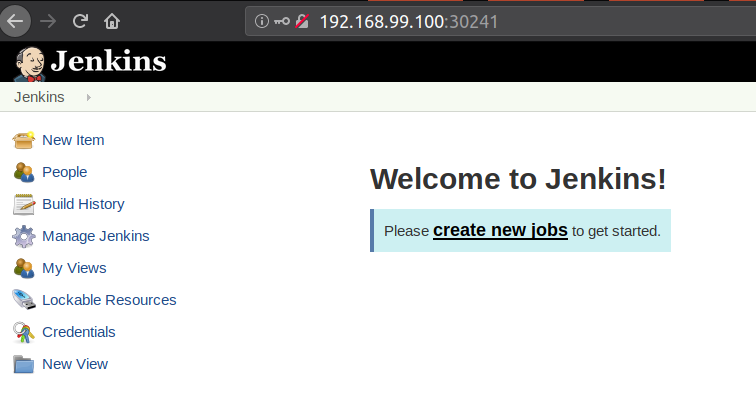
After following the steps to get the admin password and hit the Jenkins URL http://127.0.0.1:8080 in your desktop browser, you should see the familiar “Welcome to Jenkins!” page…
Pause a moment to appreciate that this Jenkins is running in a JVM inside a Docker container on a Kubernetes Pod as a Service in a Namespace in a Kubernetes Instance that’s running inside a Virtual Machine running under a Hypervisor on a host device….
turtles all the way down
there are many things I’ve skipped over here, including looking at storage, auth, security and all the usual considerations but the aim has been to quickly and easily get to this point so we can start developing the pipelines and processes we’re really wanting to focus on.
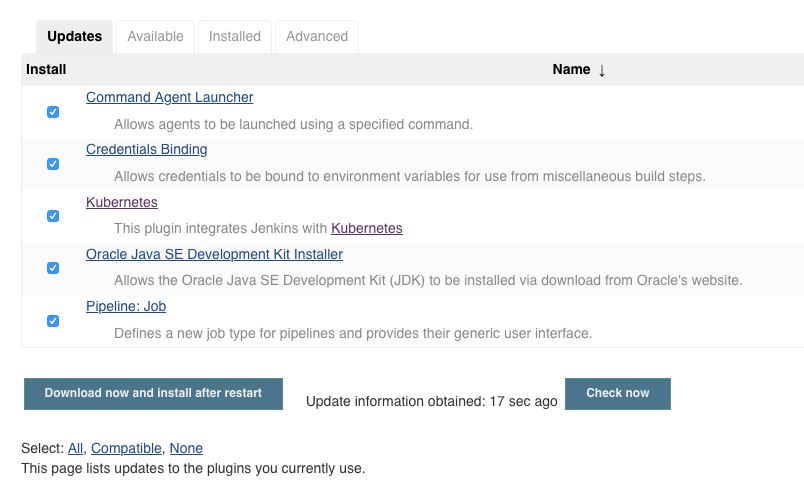
Navigating to Manage Jenkins then Plugins Manager should show some updates already available – this proves we have connectivity to the public Jenkins Update Centre out of the box. The Kubernetes Jenkins plugin is the key thing I’m looking for – select and update if required:
If you go to http://127.0.0.1:8080/configure you should see a link at the foot of the page to the new location for “Clouds”: http://127.0.0.1:8080/configureClouds/ – that should already be configured with sufficient settings for Jenkins to use your Kubernetes cluster, but it’s worthwhile taking a look through the settings and options there. No changes should be required here now though.
Setup a first Jenkins Pipeline job
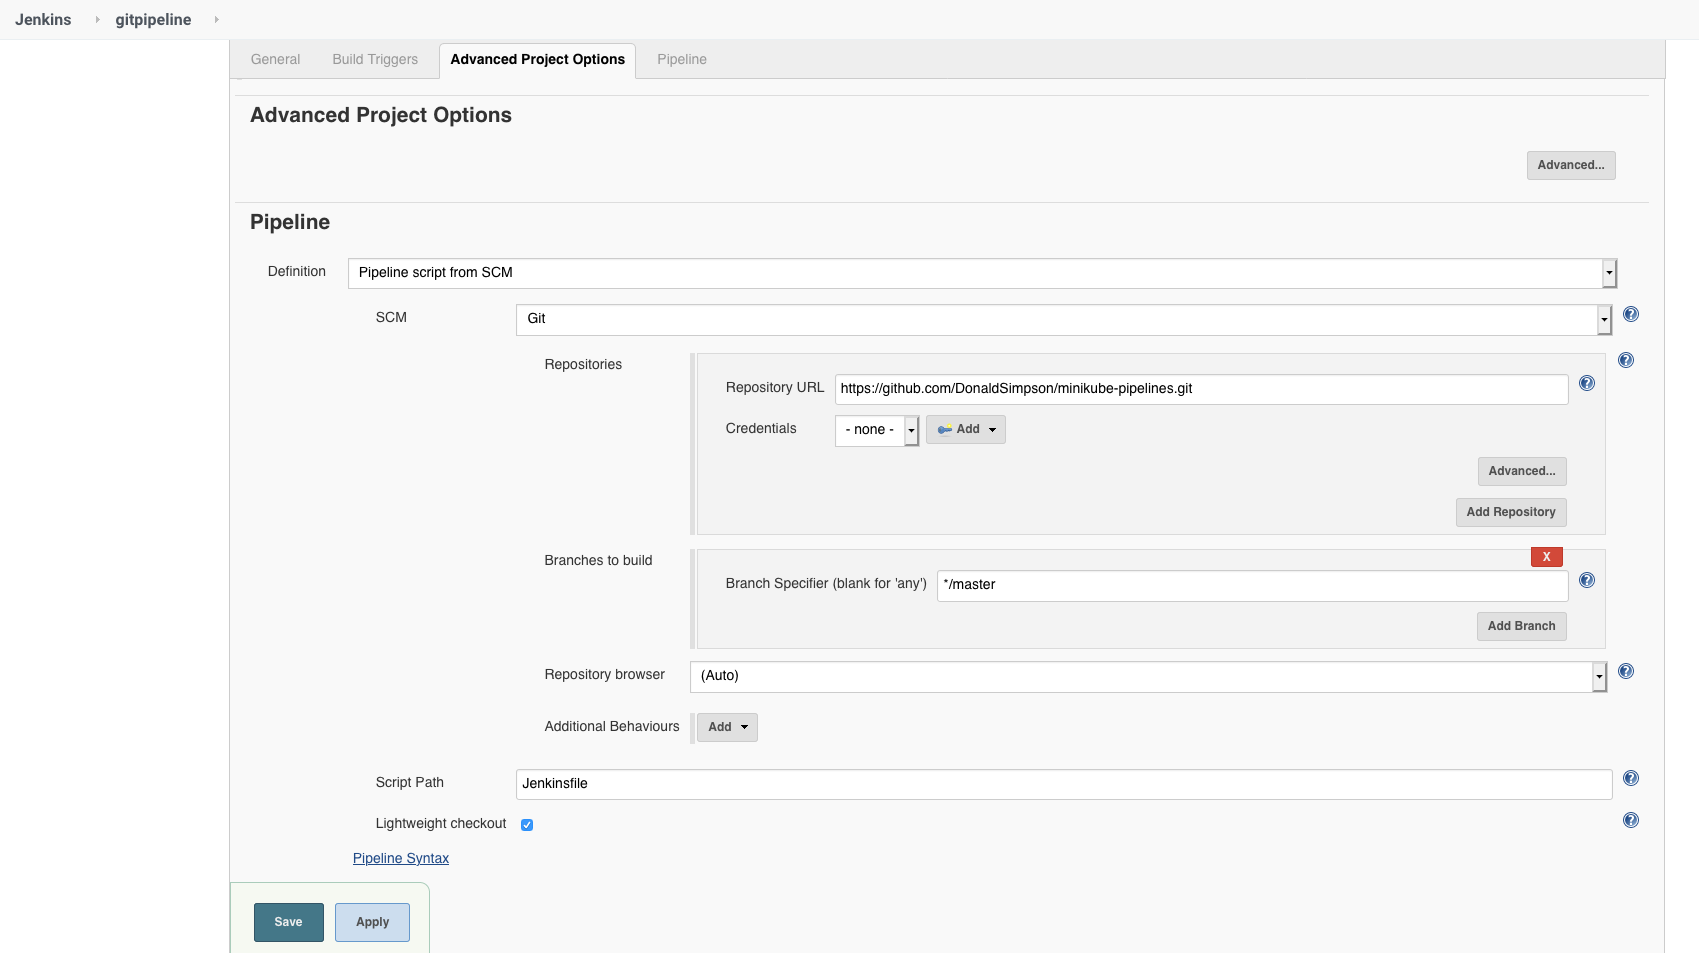
Create a new Jenkins Pipeline job and add the following settings as shown in the picture below…
In the job config page under “Pipeline”, for “Definition” select “Pipeline script from SCM” and enter the URL of this github project which contains my example pipeline code:
This file has been heavily commented to explain every part of the pipeline and shows what each step is doing. Taking a read through it should show you how pipelines work, how Jenkins is creating Docker Containers for the different Stages, and give you some ideas on how you could develop this simple example further.
Run it and take a look at the results
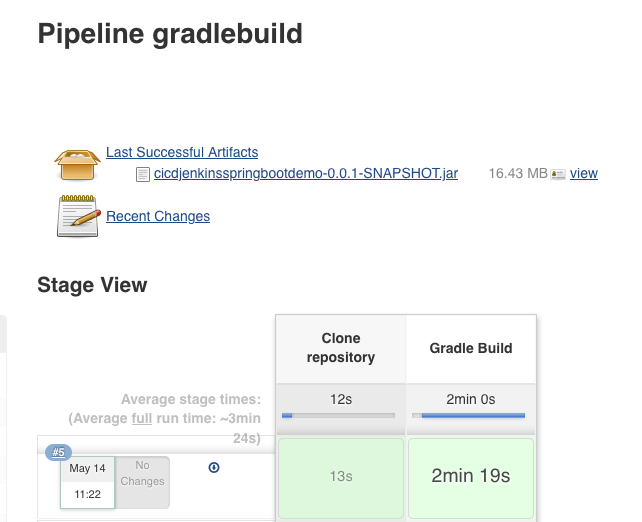
Save and run the job, and you should (eventually) see something like this:
The jobs Console Output will have a ton of info, showing everything from the container images being pulled, the git repo being cloned, the very verbose gradle build output and all the local files.
So in summary, what just happened?
Jenkins connected to Kubernetes via the Kubernetes plugin and its settings
A gradle Docker container was started and connected as a Jenkins JNLP Agent, running as another k8s pod
The gradle build stage was run inside that gradle container, using the source files checked out from git in the previous Stage
The newly built JAR file was archived so we could use it later if wanted
The pipeline ends, and k8s will clean up the containers
This pipeline could easily be expanded to run that new JAR file as an application as demonstrated here: https://github.com/AutomatedIT/springbootjenkinspipelinedemo/blob/master/Jenkinsfile#L5, or, you could build a new Docker image containing this version of the JAR file and start that up and test it and so on. You could also automate this so that whenever the source code is changed a build is triggered that does all of this automatically and records the result… hello CI/CD!
What next?
From the above demo you can hopefully see how easy it is to create an end to end pipeline that will automatically provision Jenkins Agents running on Kubernetes for you.
You can use this functionality to quickly and safely develop pipeline processes like the one we have examined, that run across multiple Agents, using each for a particular function/step in your workflow, leaving the provisioning and housekeeping work to the underlying Kubernetes cluster. With this, you can build or pull docker images, run them, test them, start them up as other Jenkins JNLP Agents and so on, all “as code” and all fully automated.
And after all that… ?
Being able to fire up Docker containers and use them as Jenkins Agents running on a Kubernetes platform is extremely powerful in itself, but you can go a step further and start using this setup to build, deploy and manage Kubernetes resources directly, too – from Jenkins Pipelines running on the same Kubernetes Cluster – or even from one Kubernetes to another.
We’ve seen during setup that we can use kubectl to manage the k8s cluster and its components – we can also do that from within containers and stages in our pipelines, wherever they are.
and contains an example pipeline and supporting files to build, lint, security scan, push to registry, deploy to Kubernetes, run, test and clean up the example “doncoin” application via a Jenkins pipeline running on Kubernetes.
It also includes outlines and suggestions for expanding things even further, in to a more mature and production-ready setup, introducing things like Jenkins shared libraries, linting and testing, automating vulnerability scanning within the pipeline, and so on.
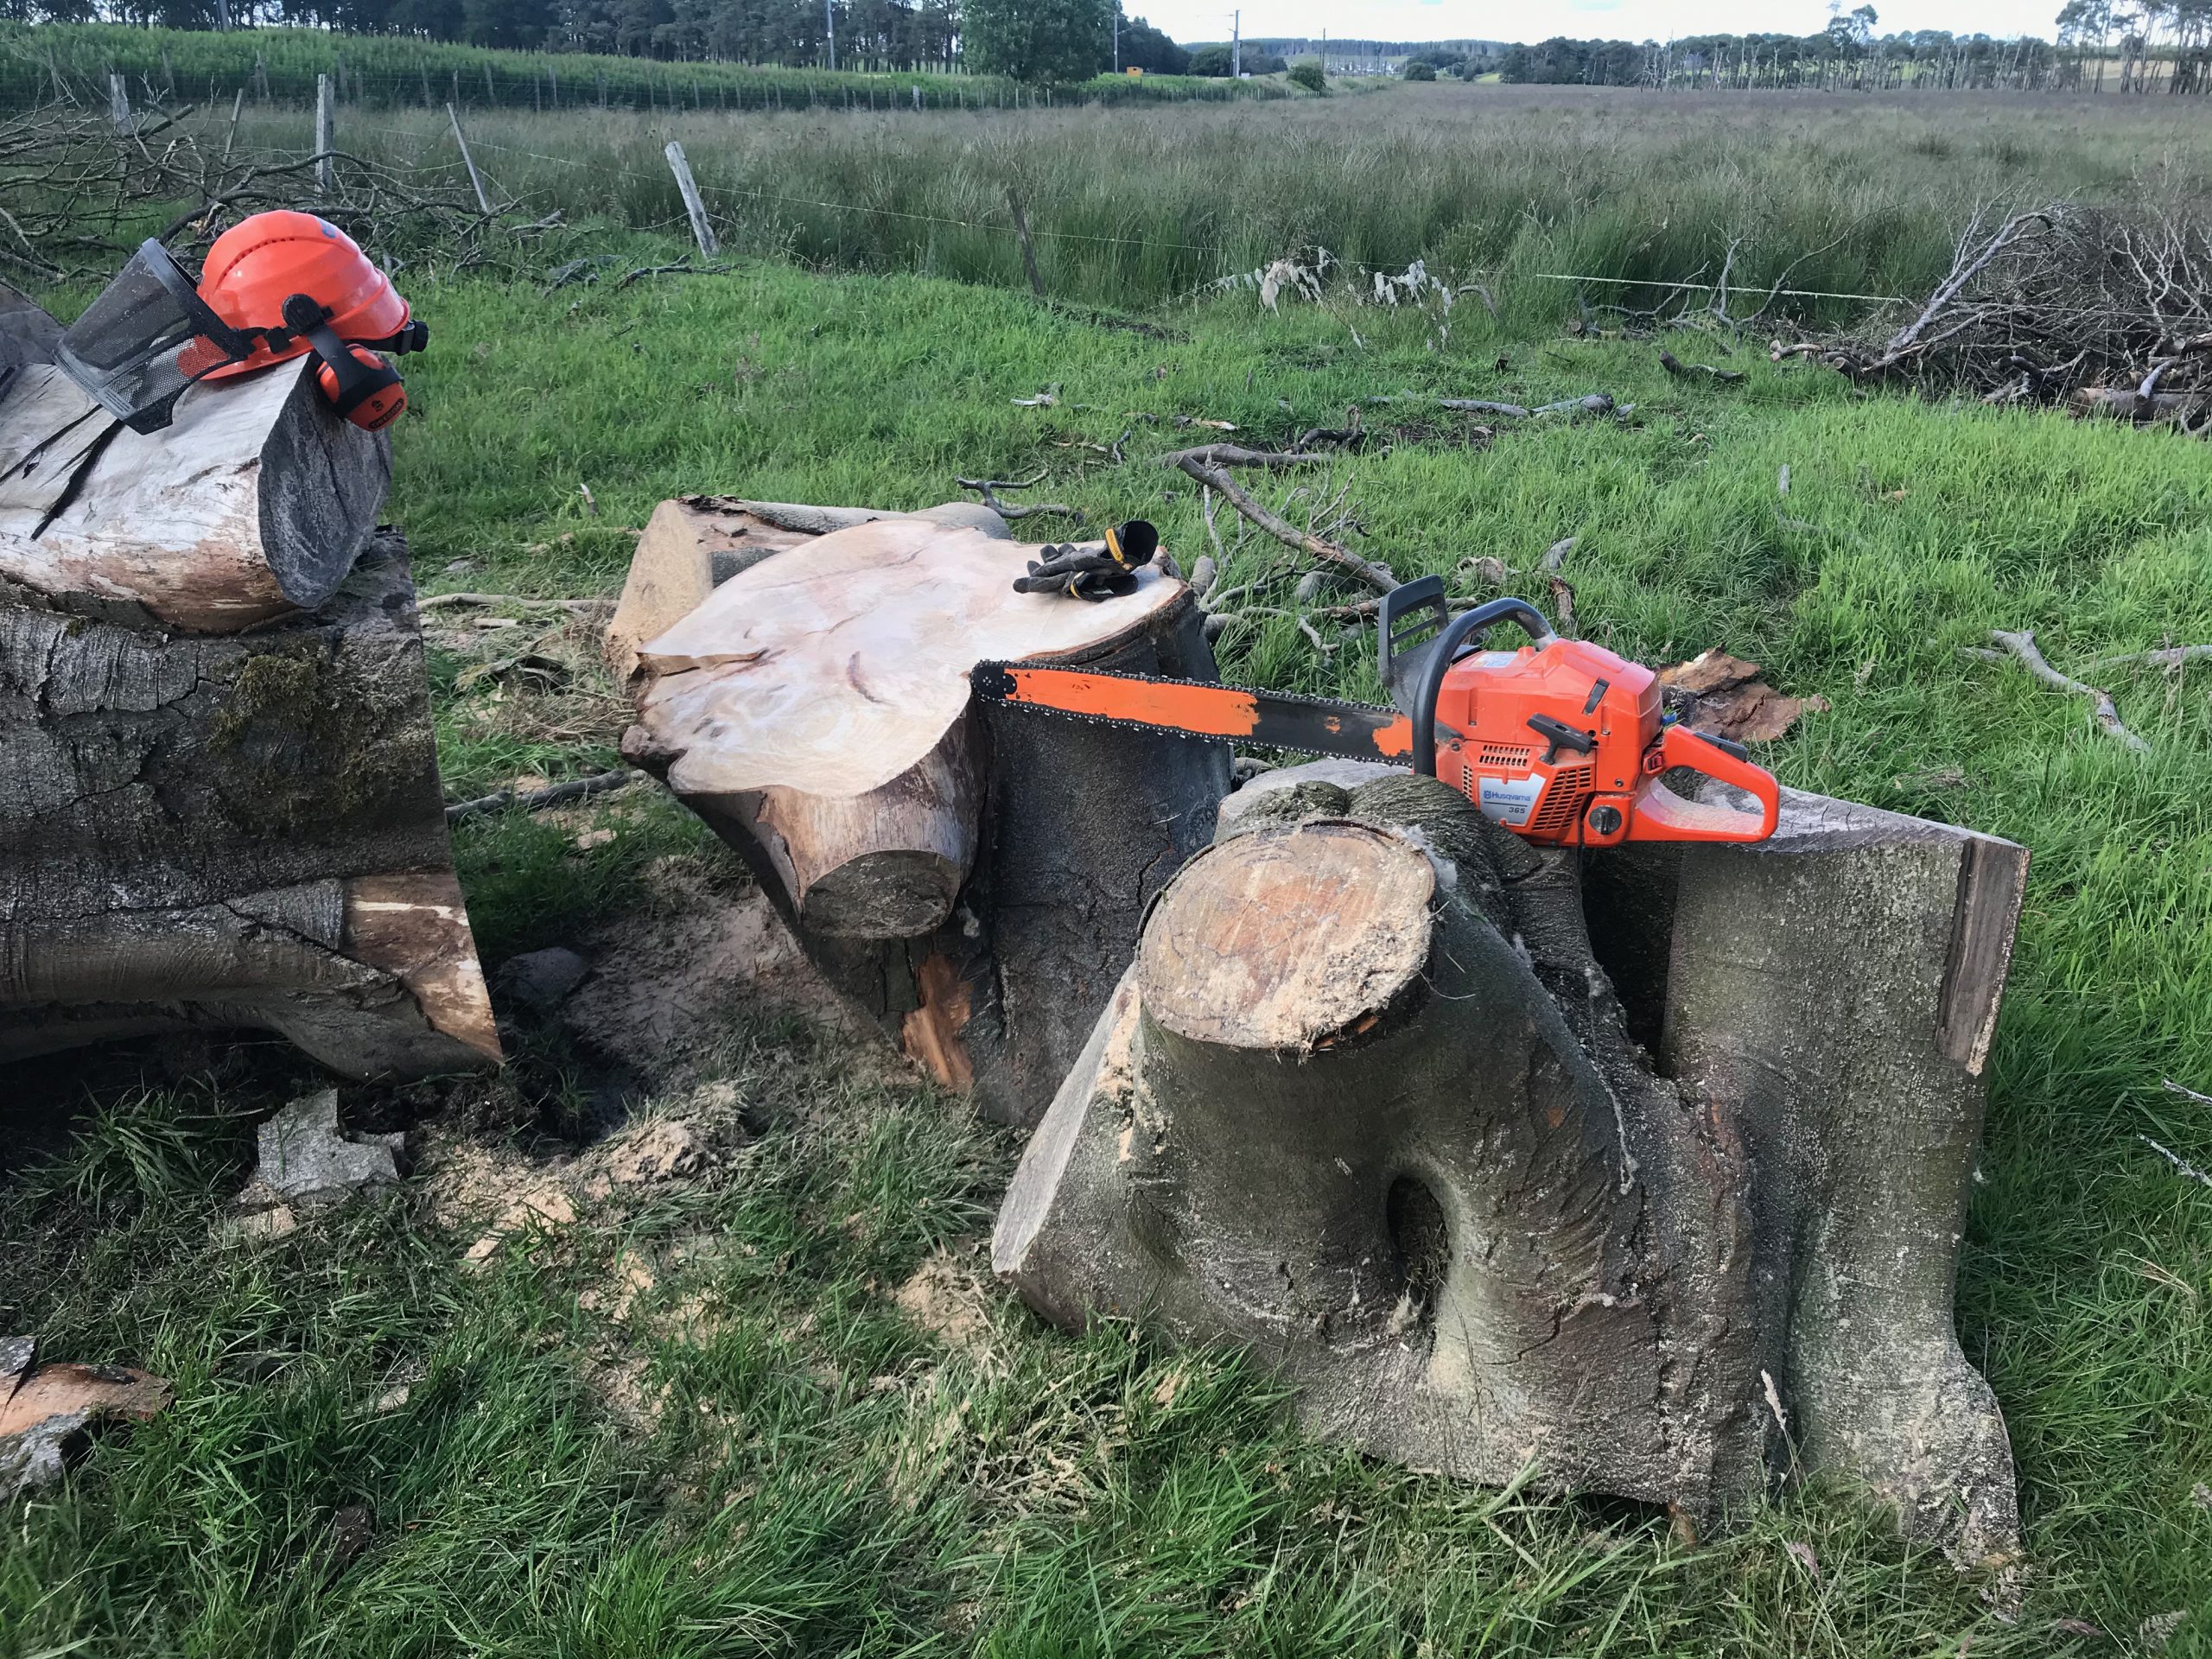
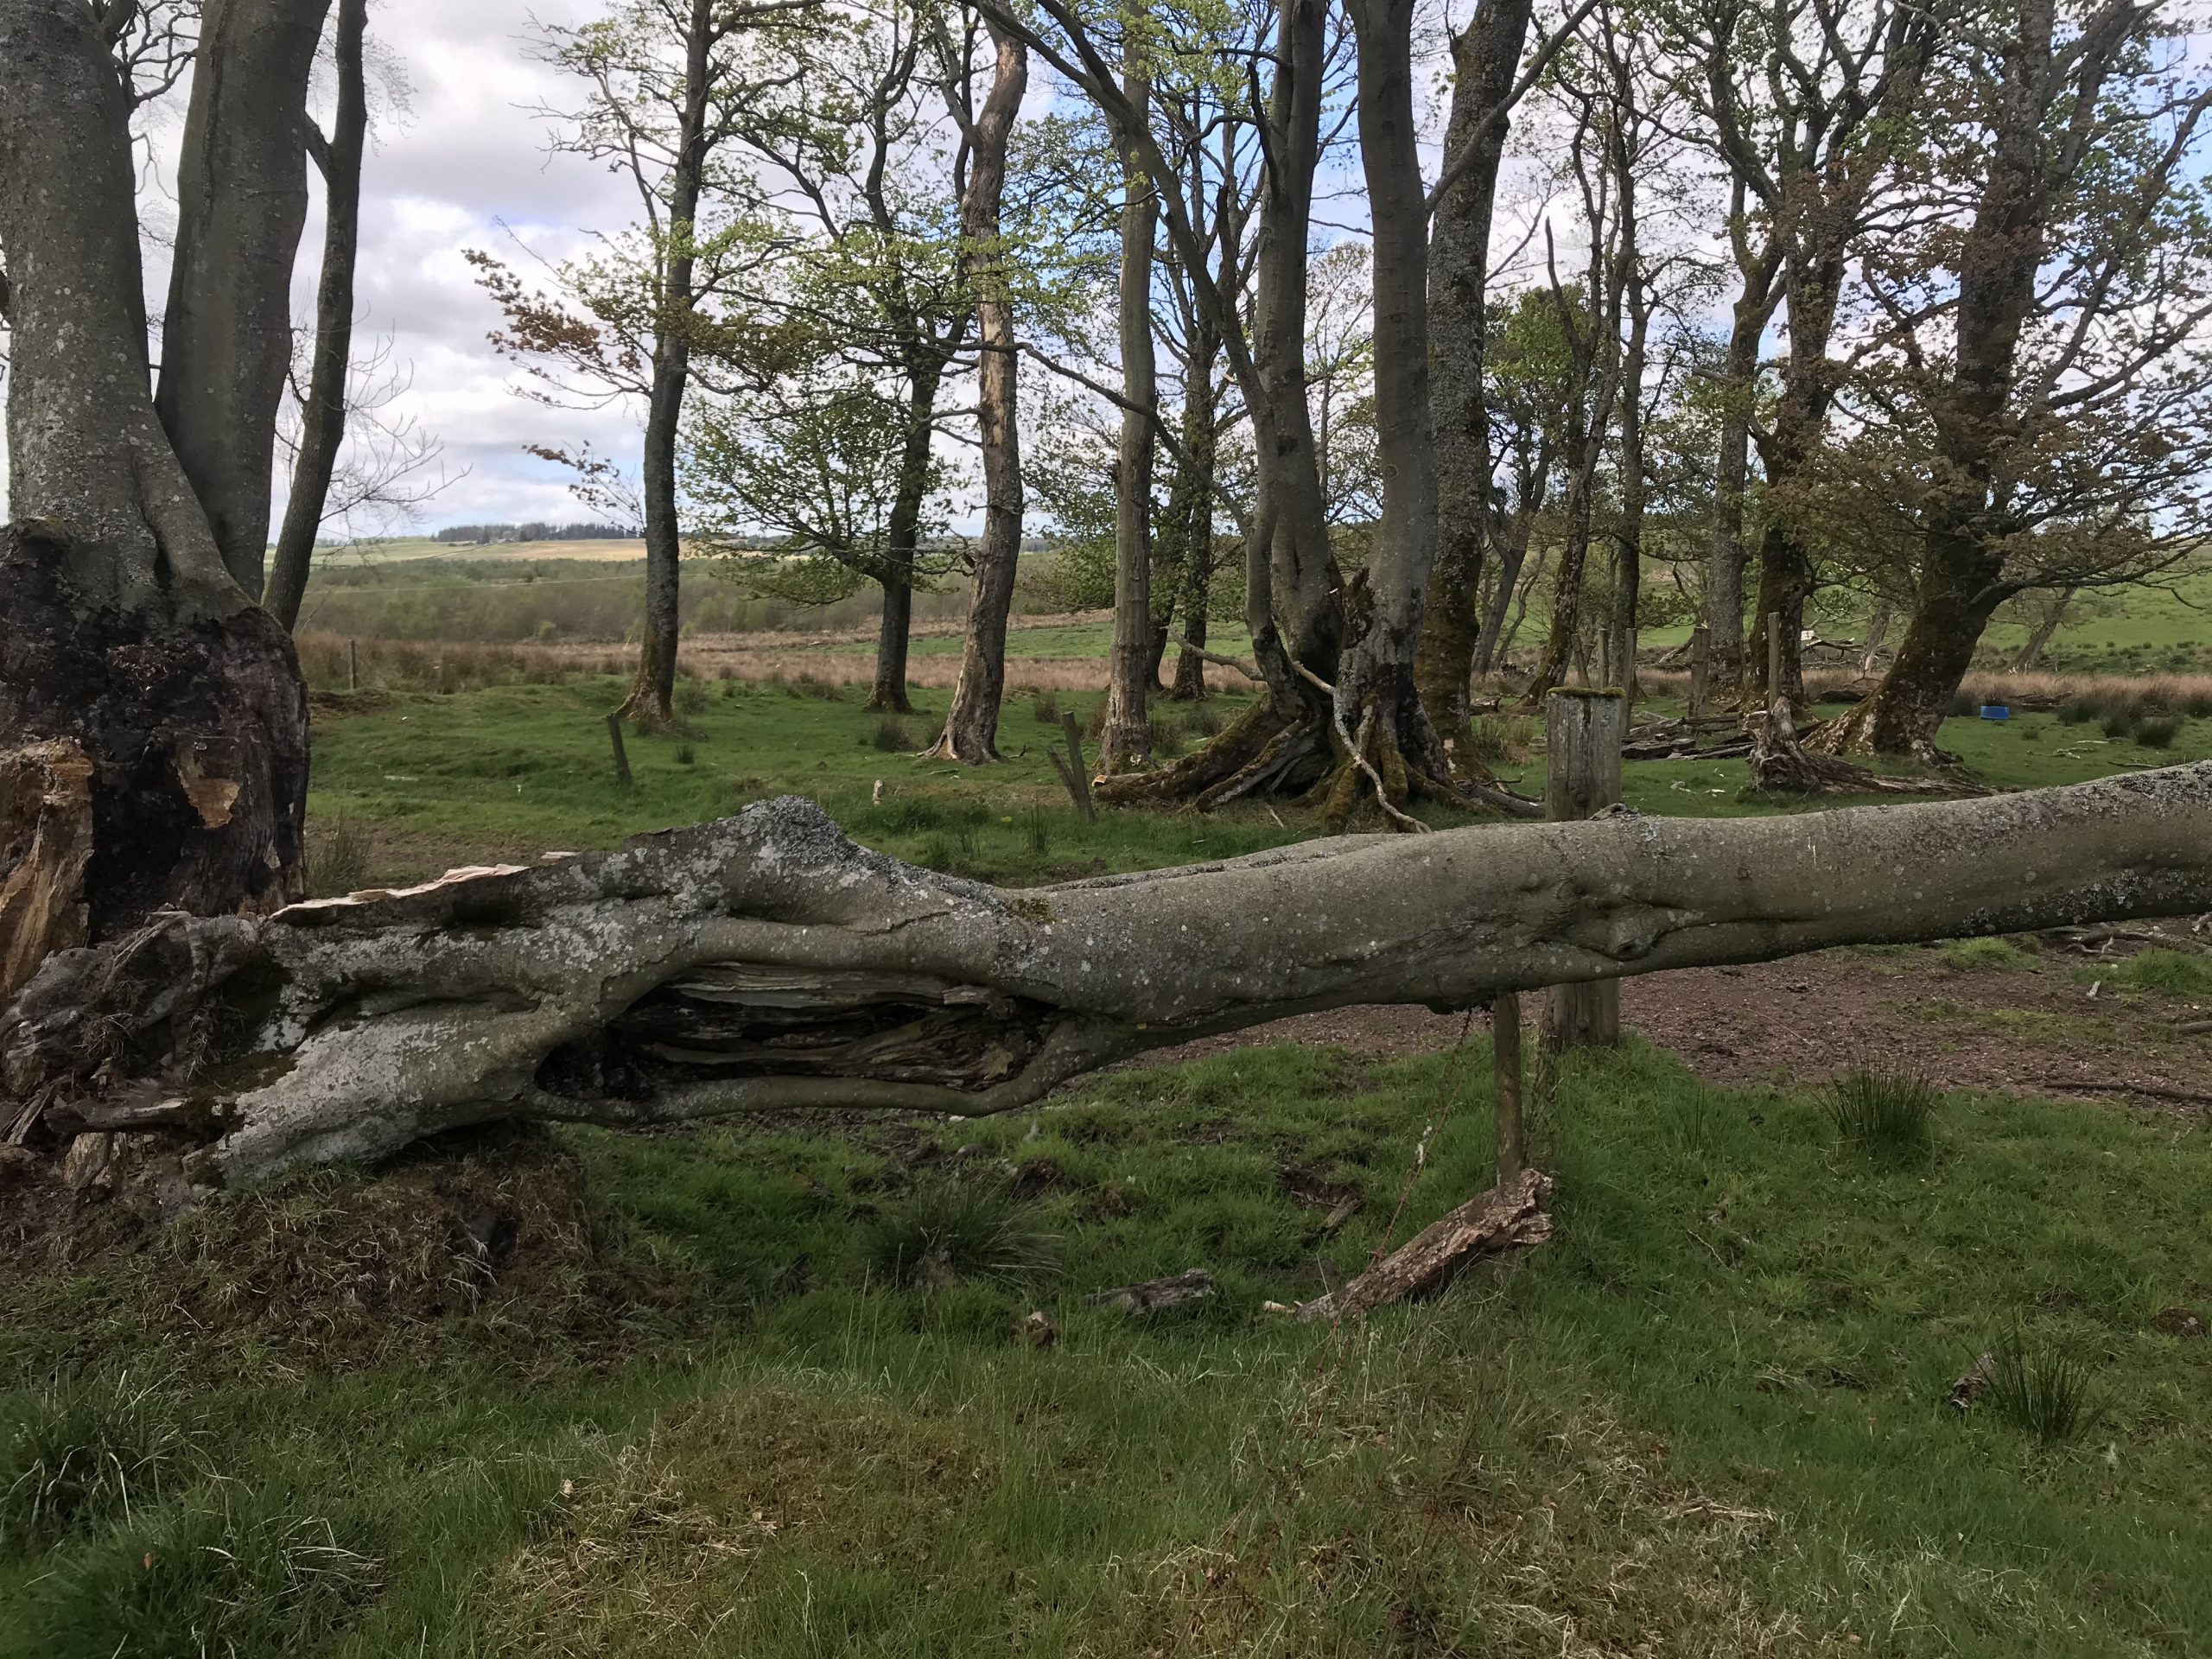
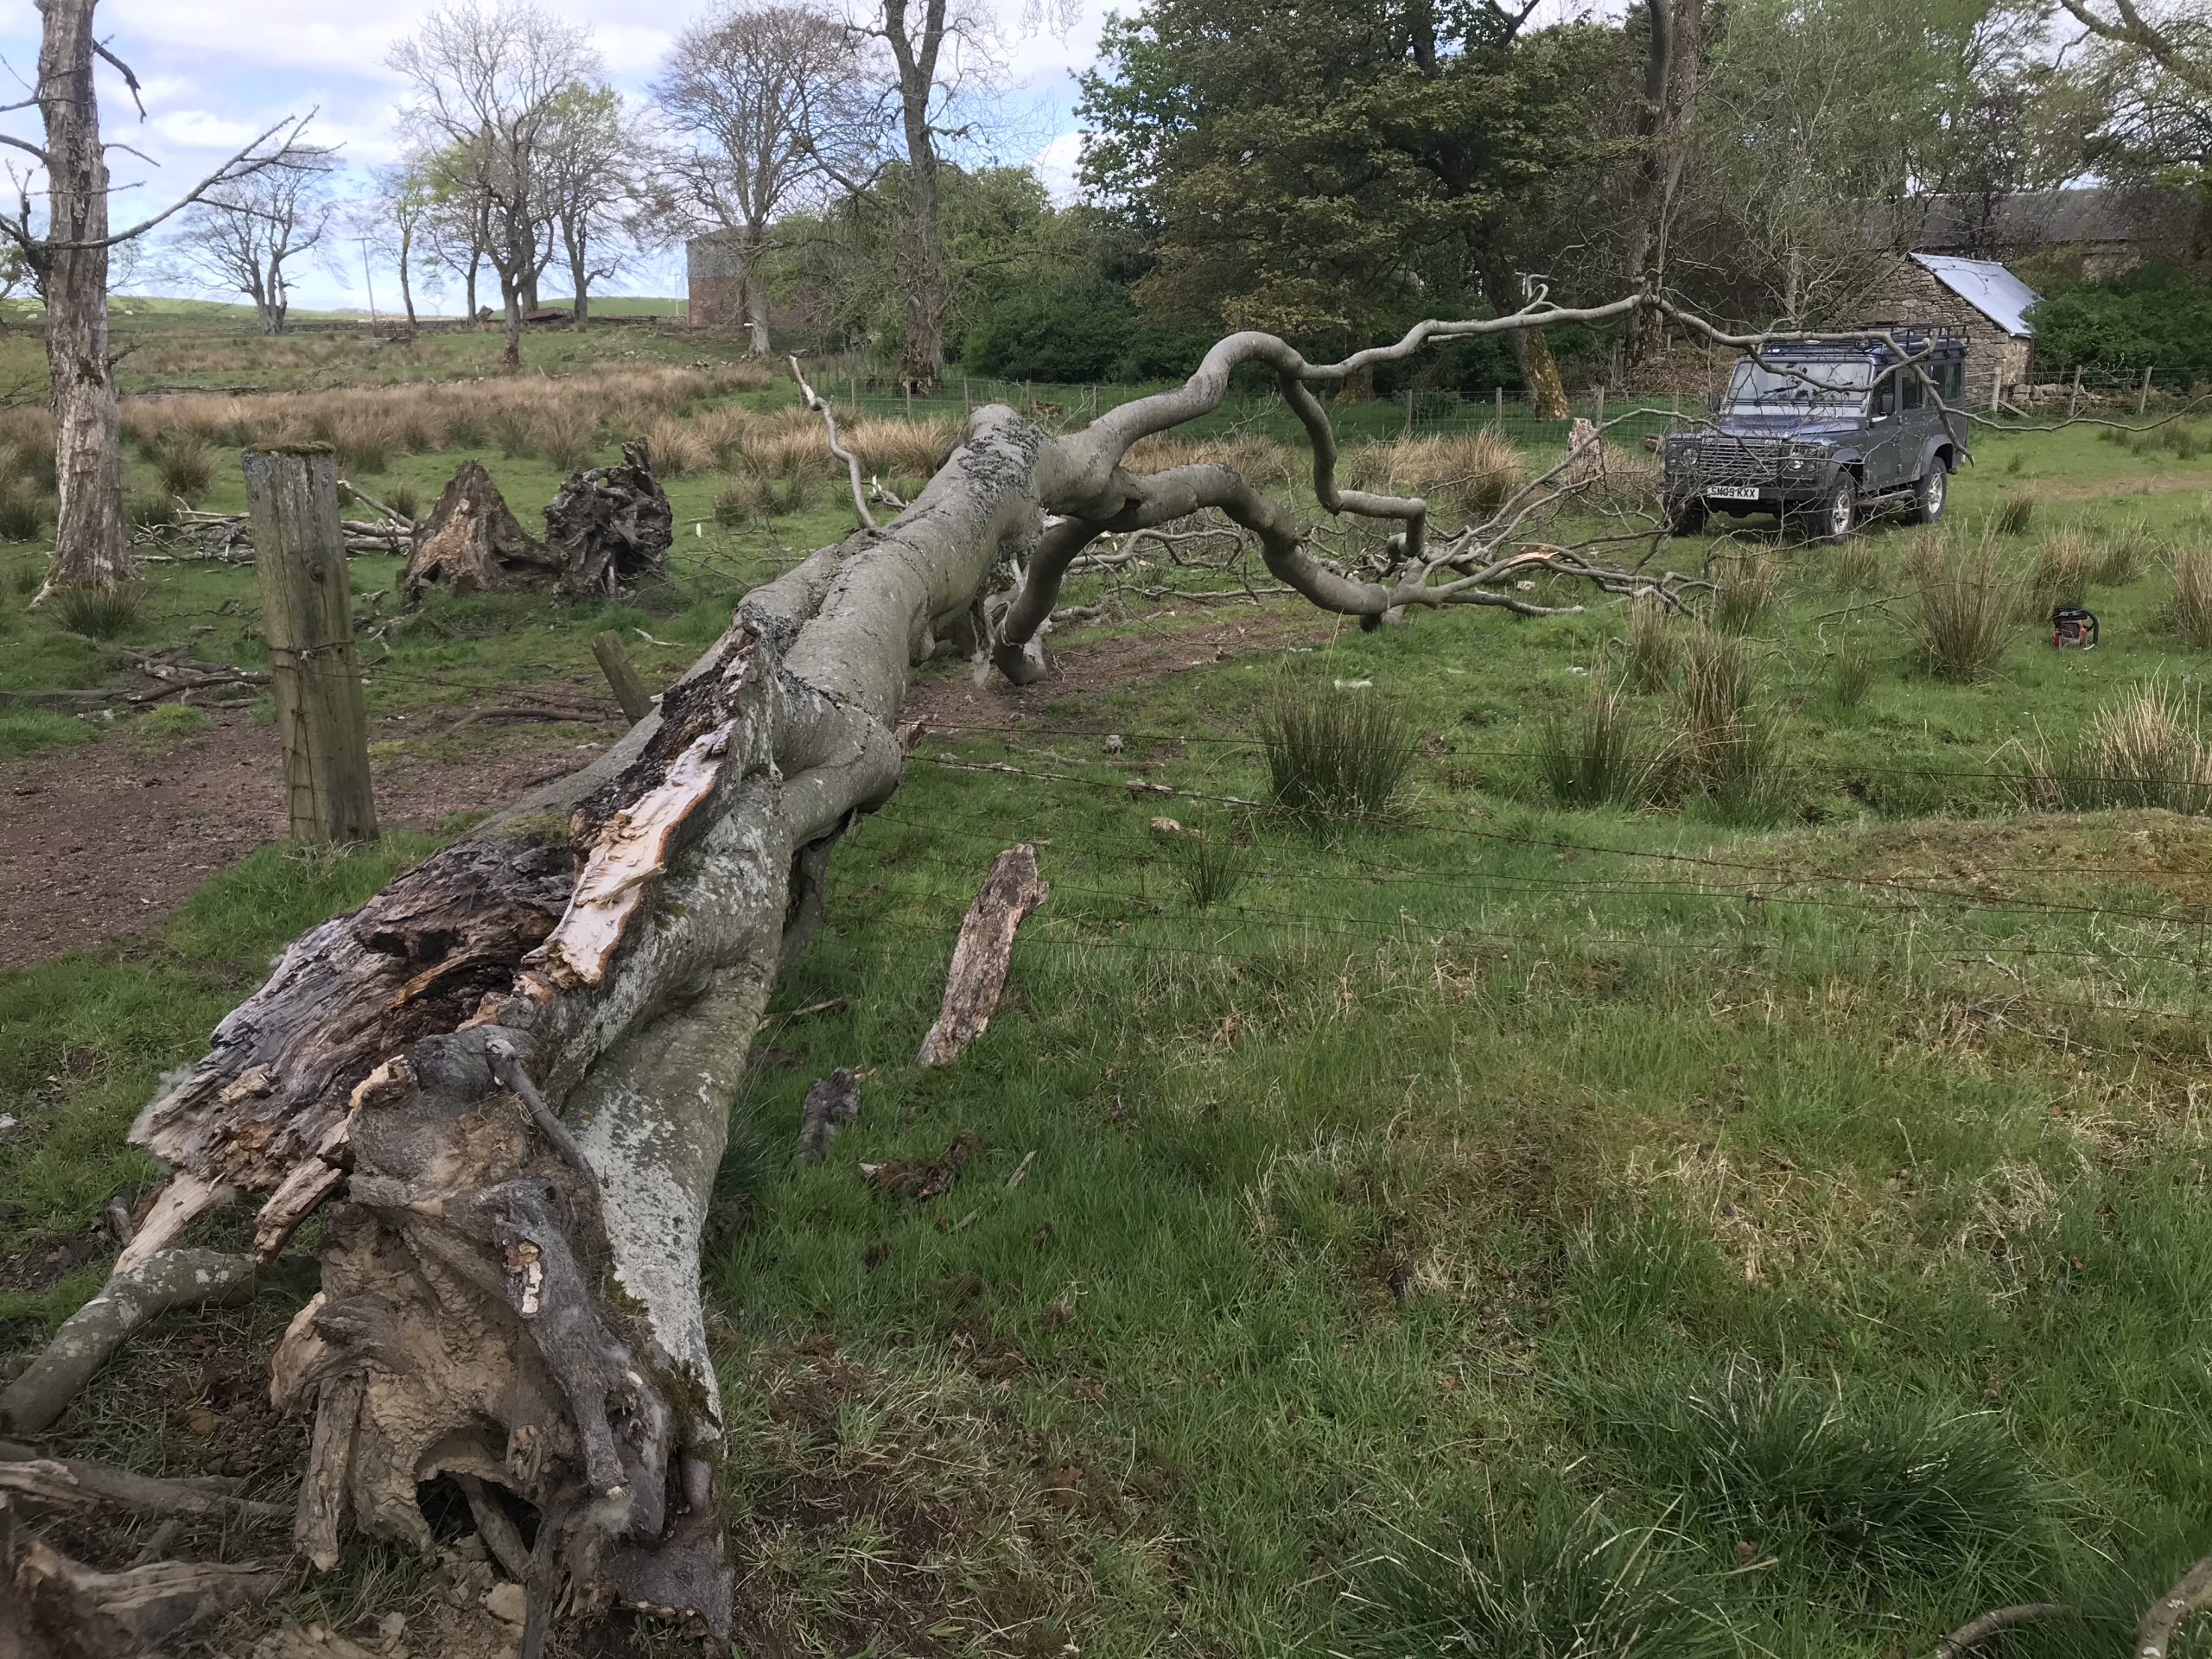
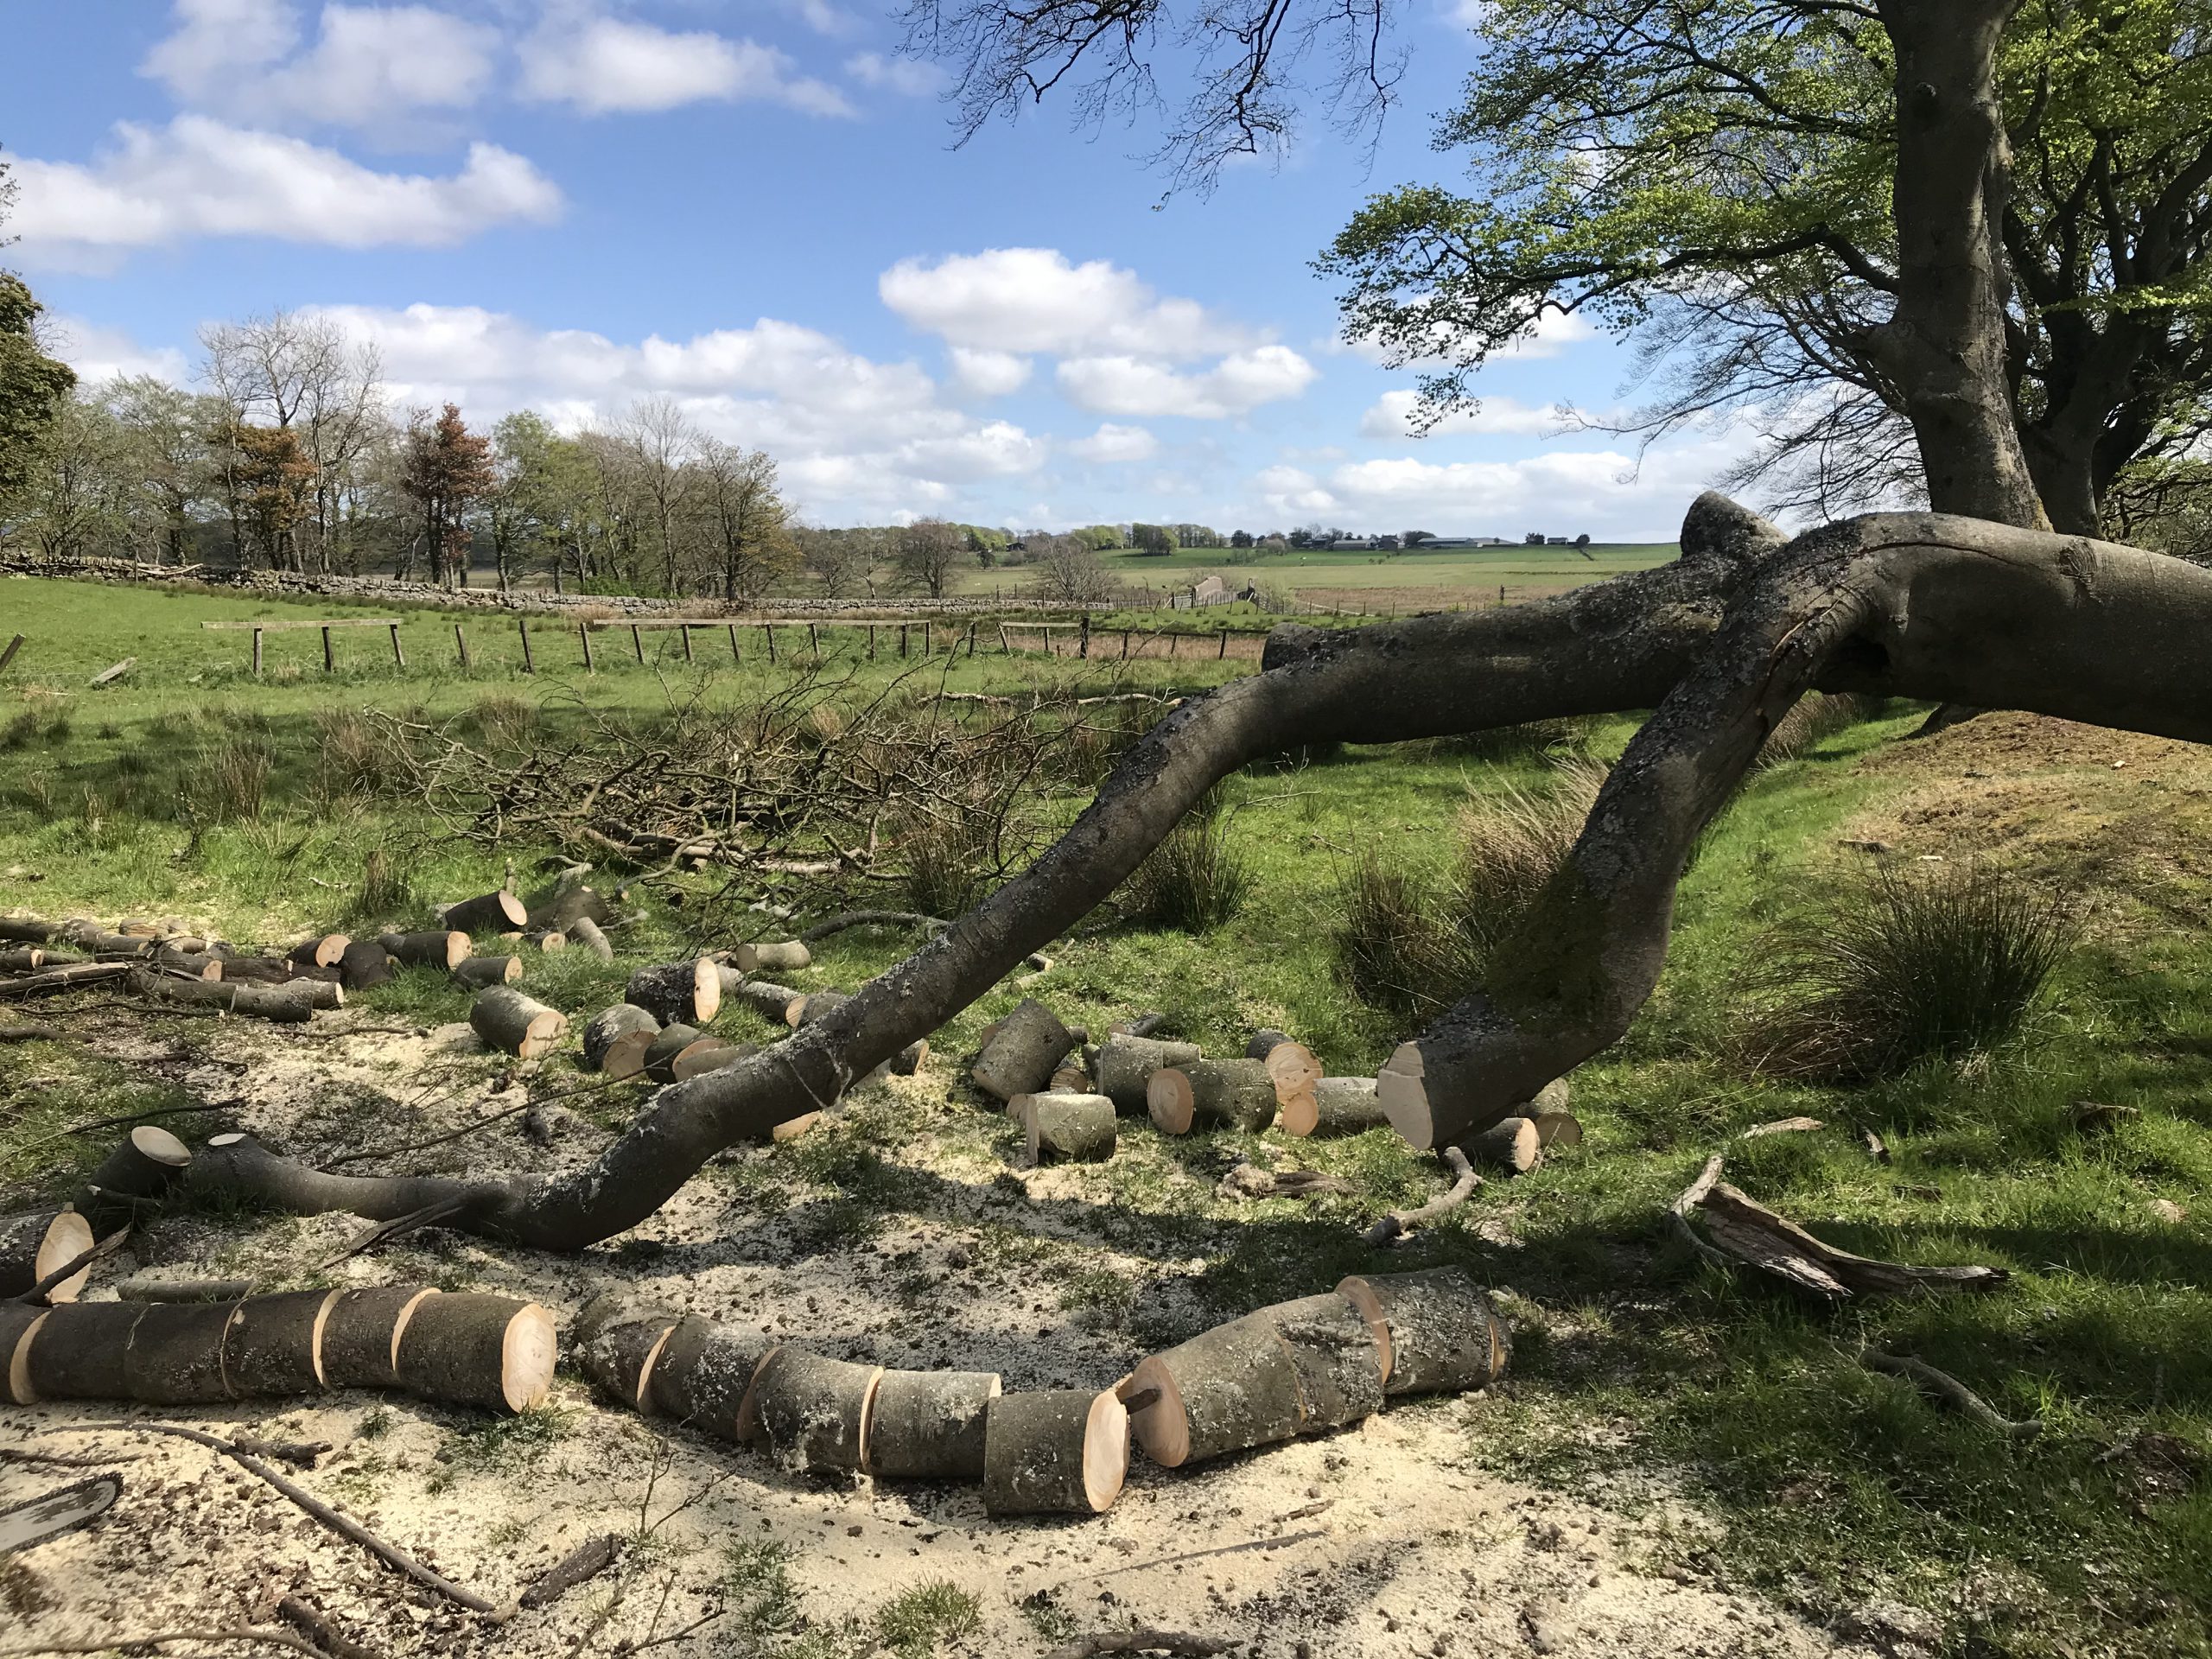
Some pics of a fallen beech tree being chopped up for firewood and milling.
One half of this tree had fallen on a neighbours track, and I spent a sunny afternoon self-isolating with it and a couple of chainsaws.
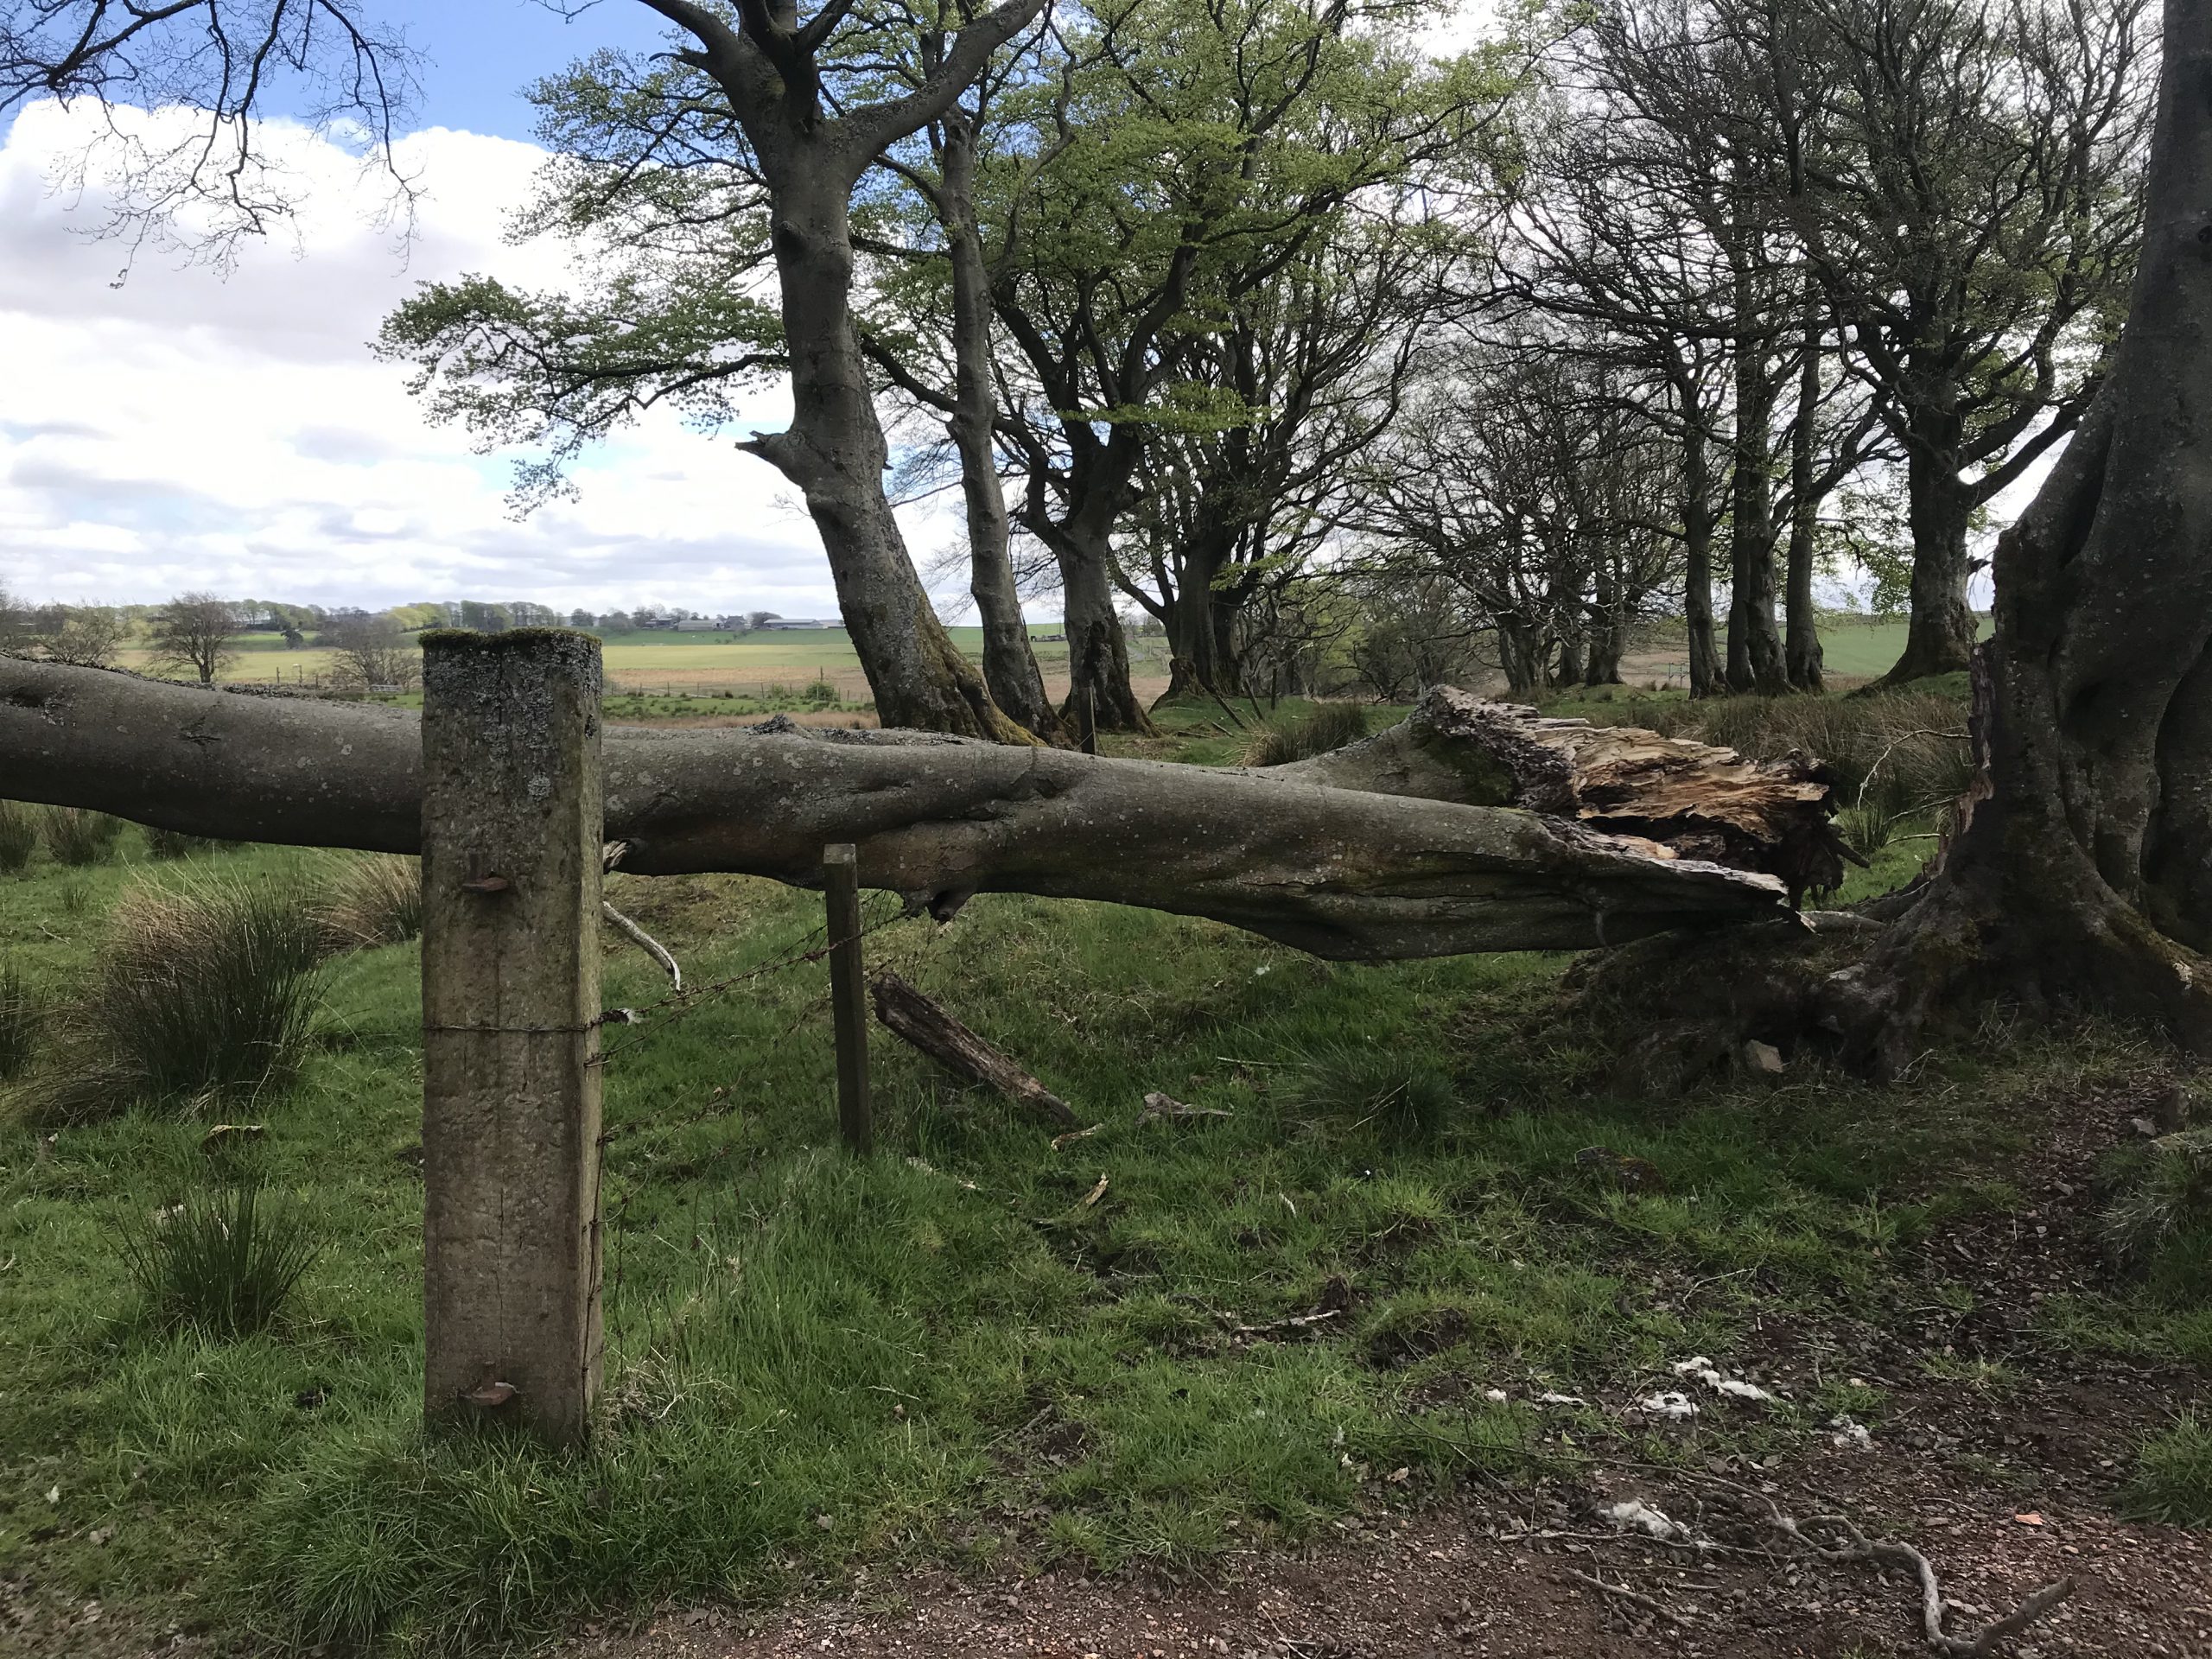
The “before” pics… it looks like a branch in these shots, but it was quite a lot of wood.
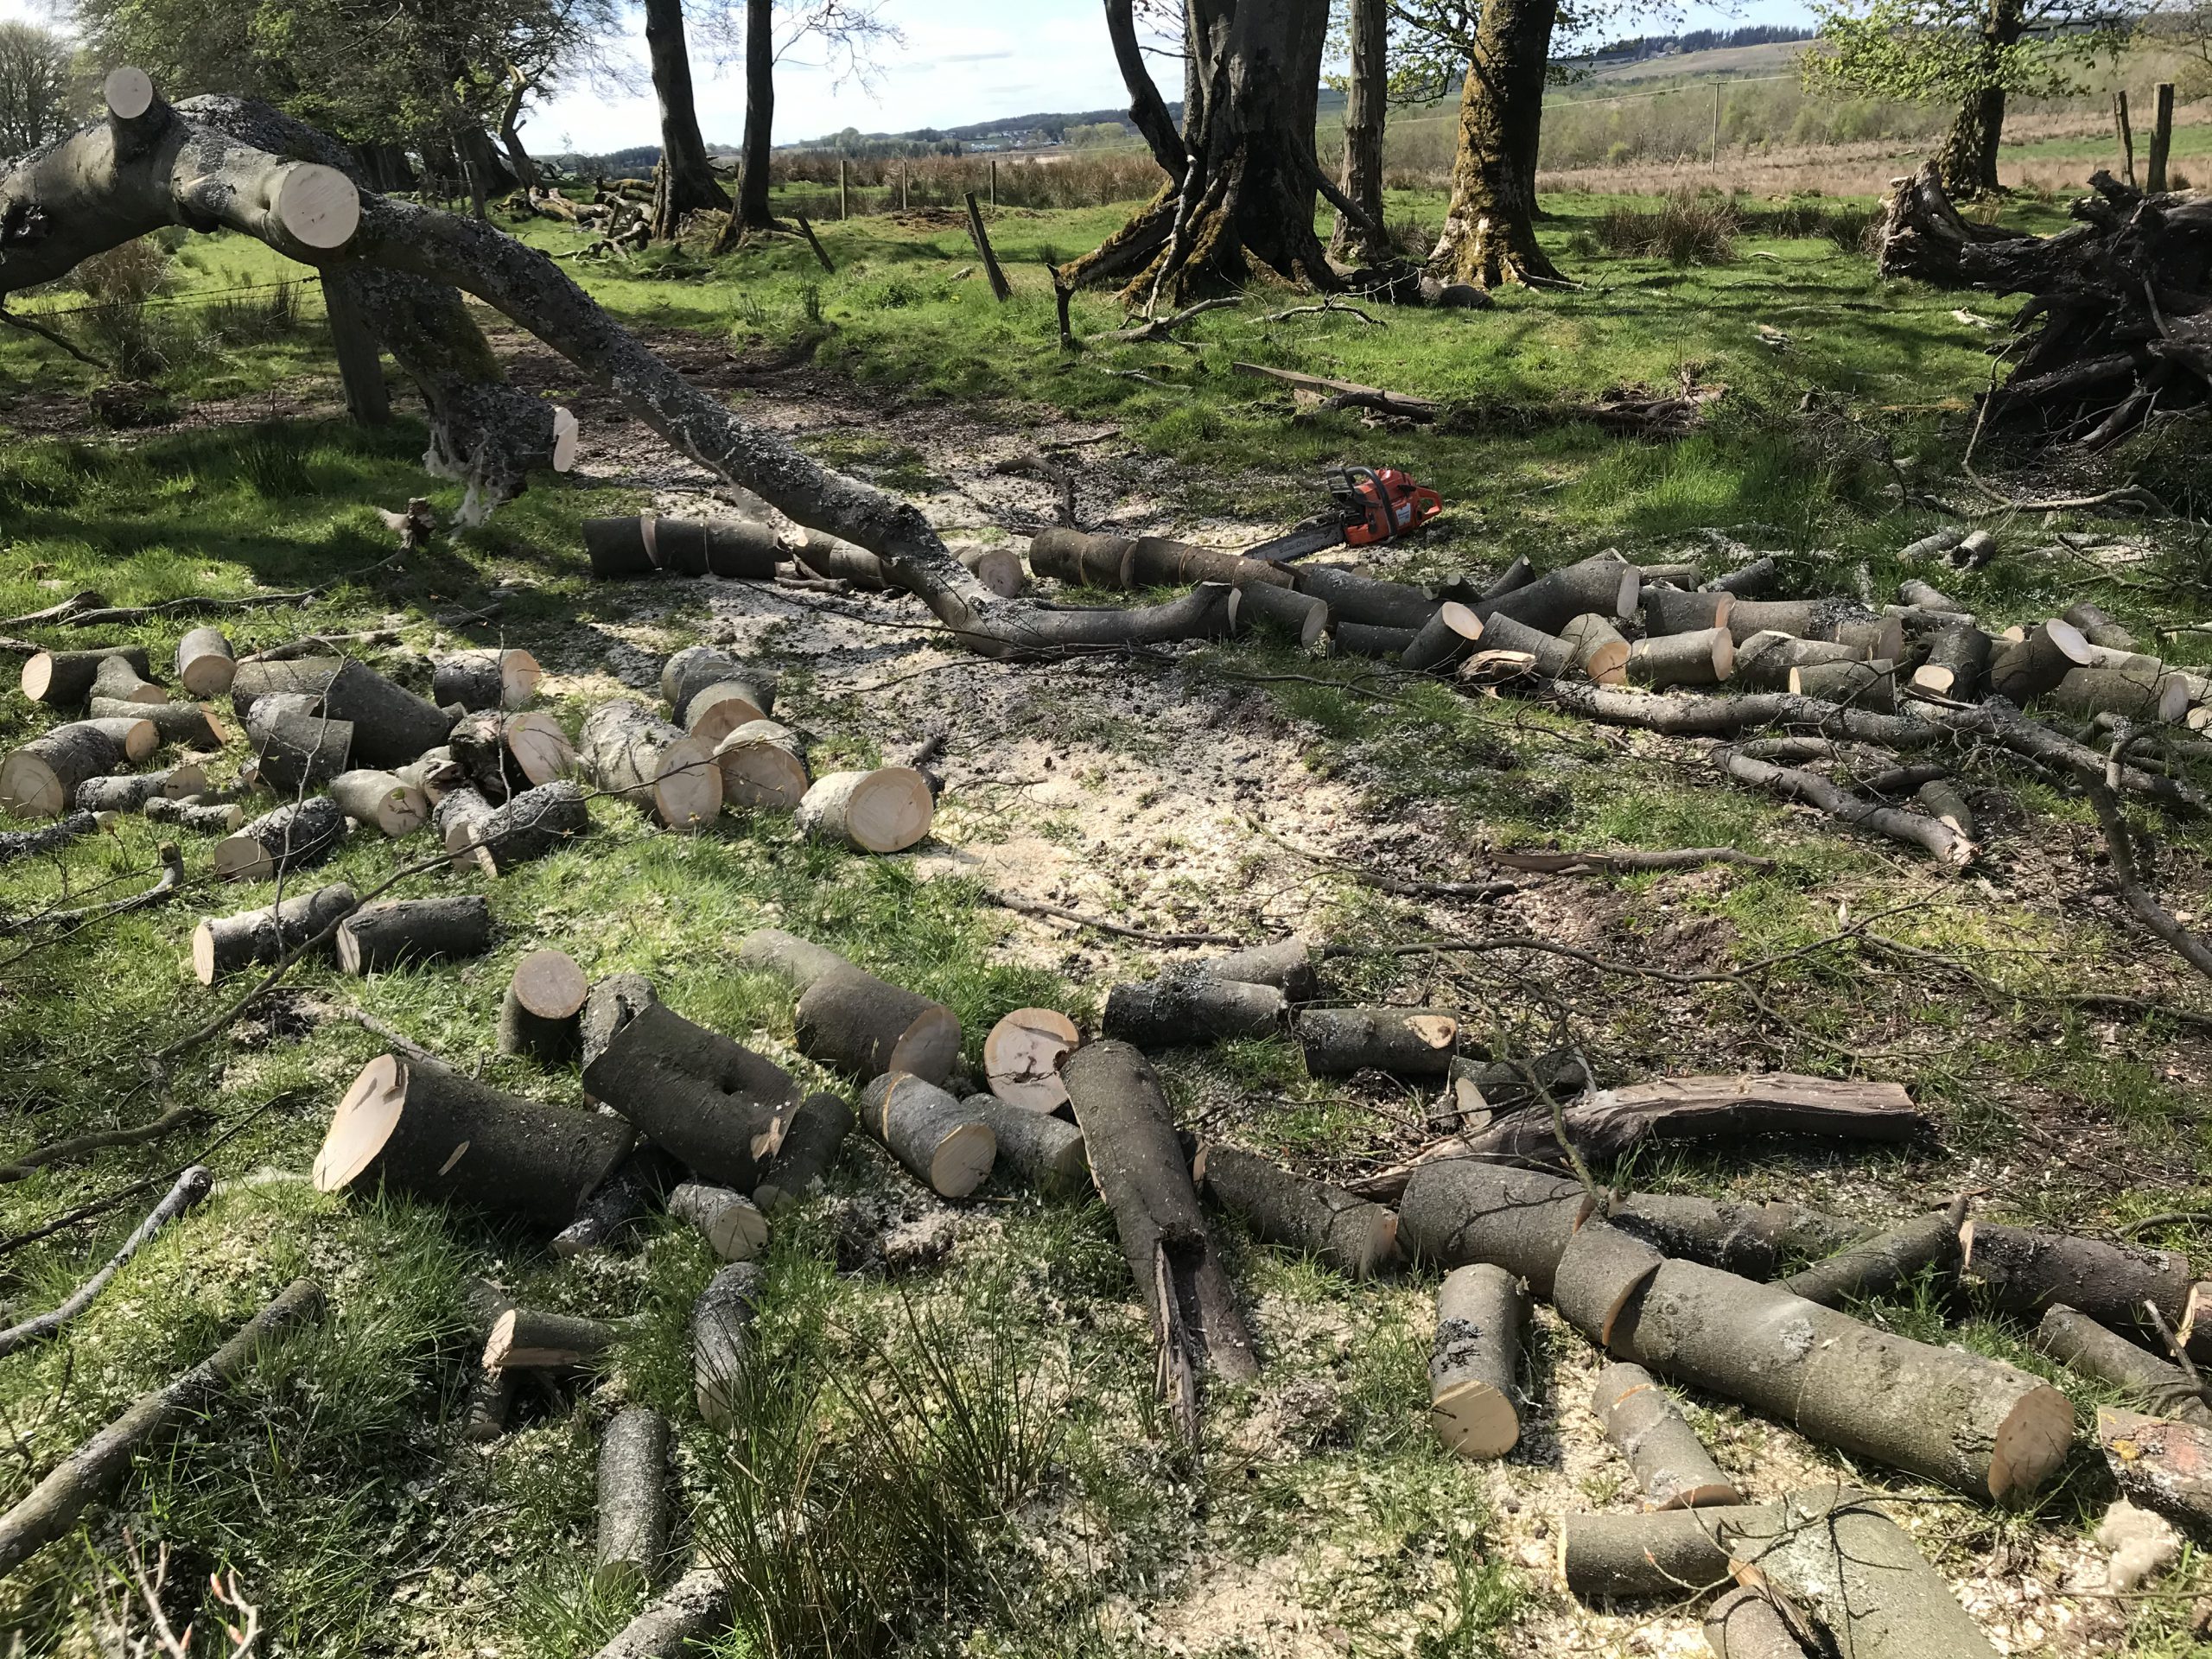
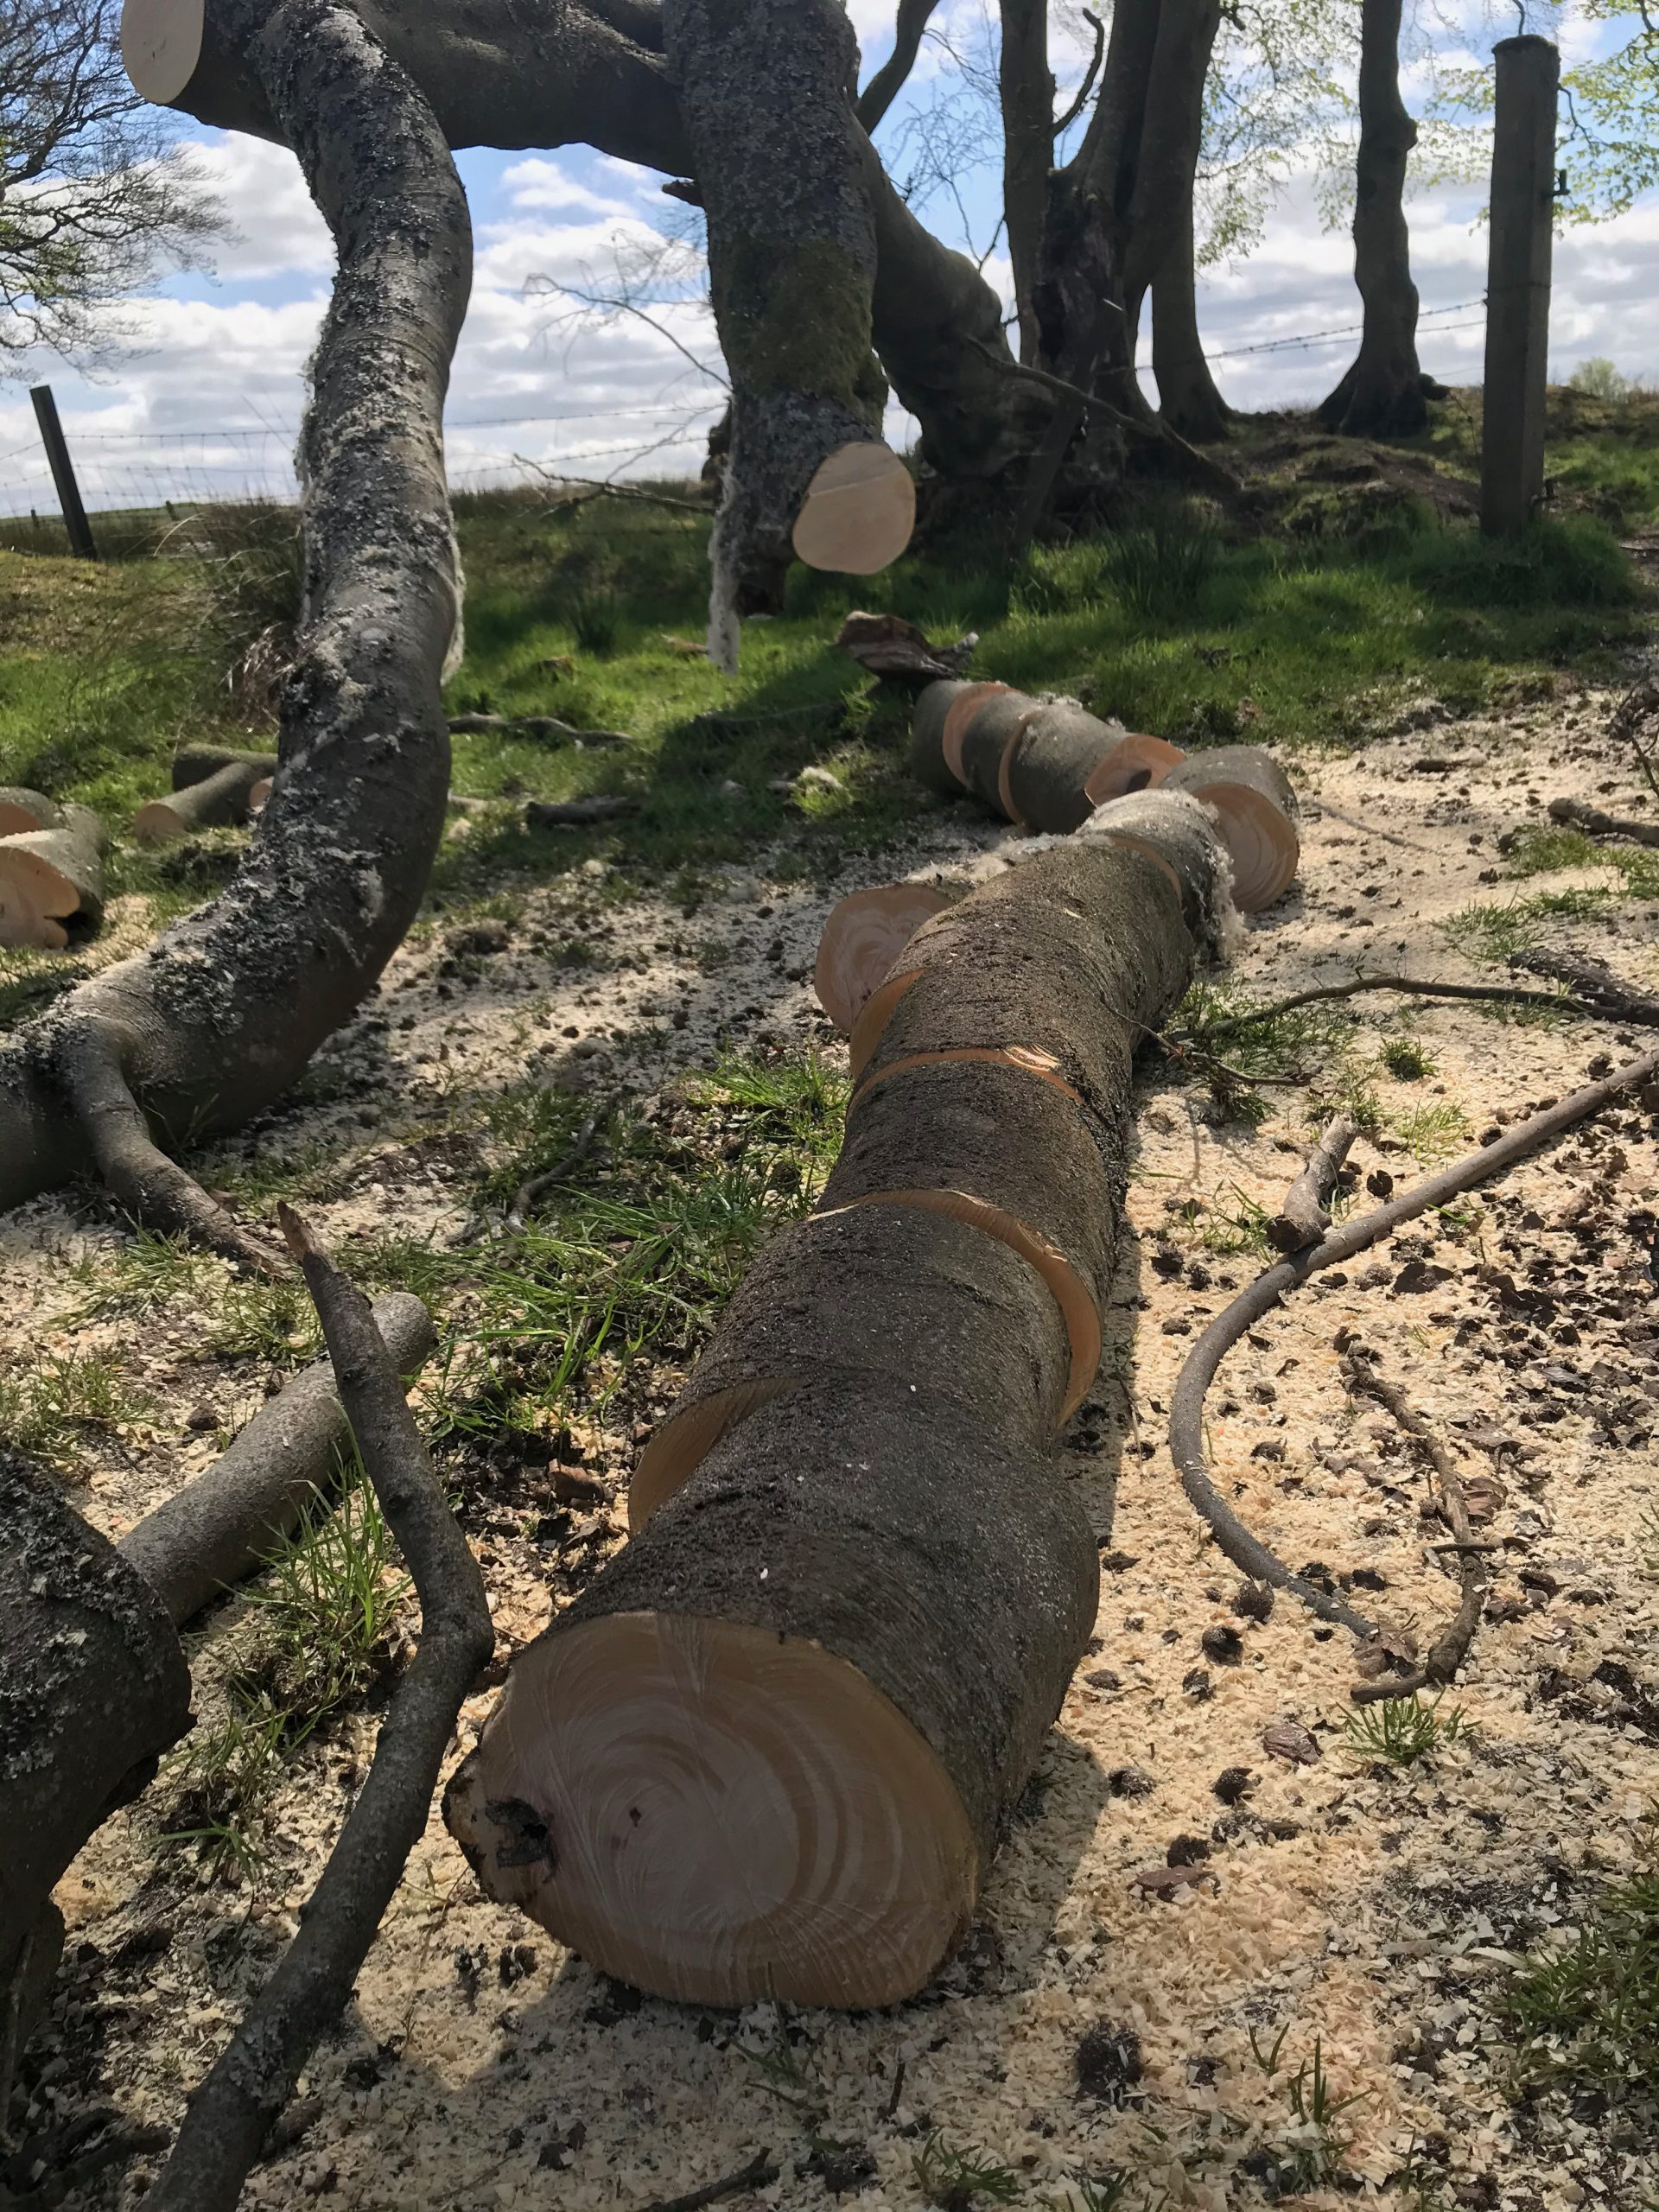
After some limbing and bucking and a mild case of sunburn:
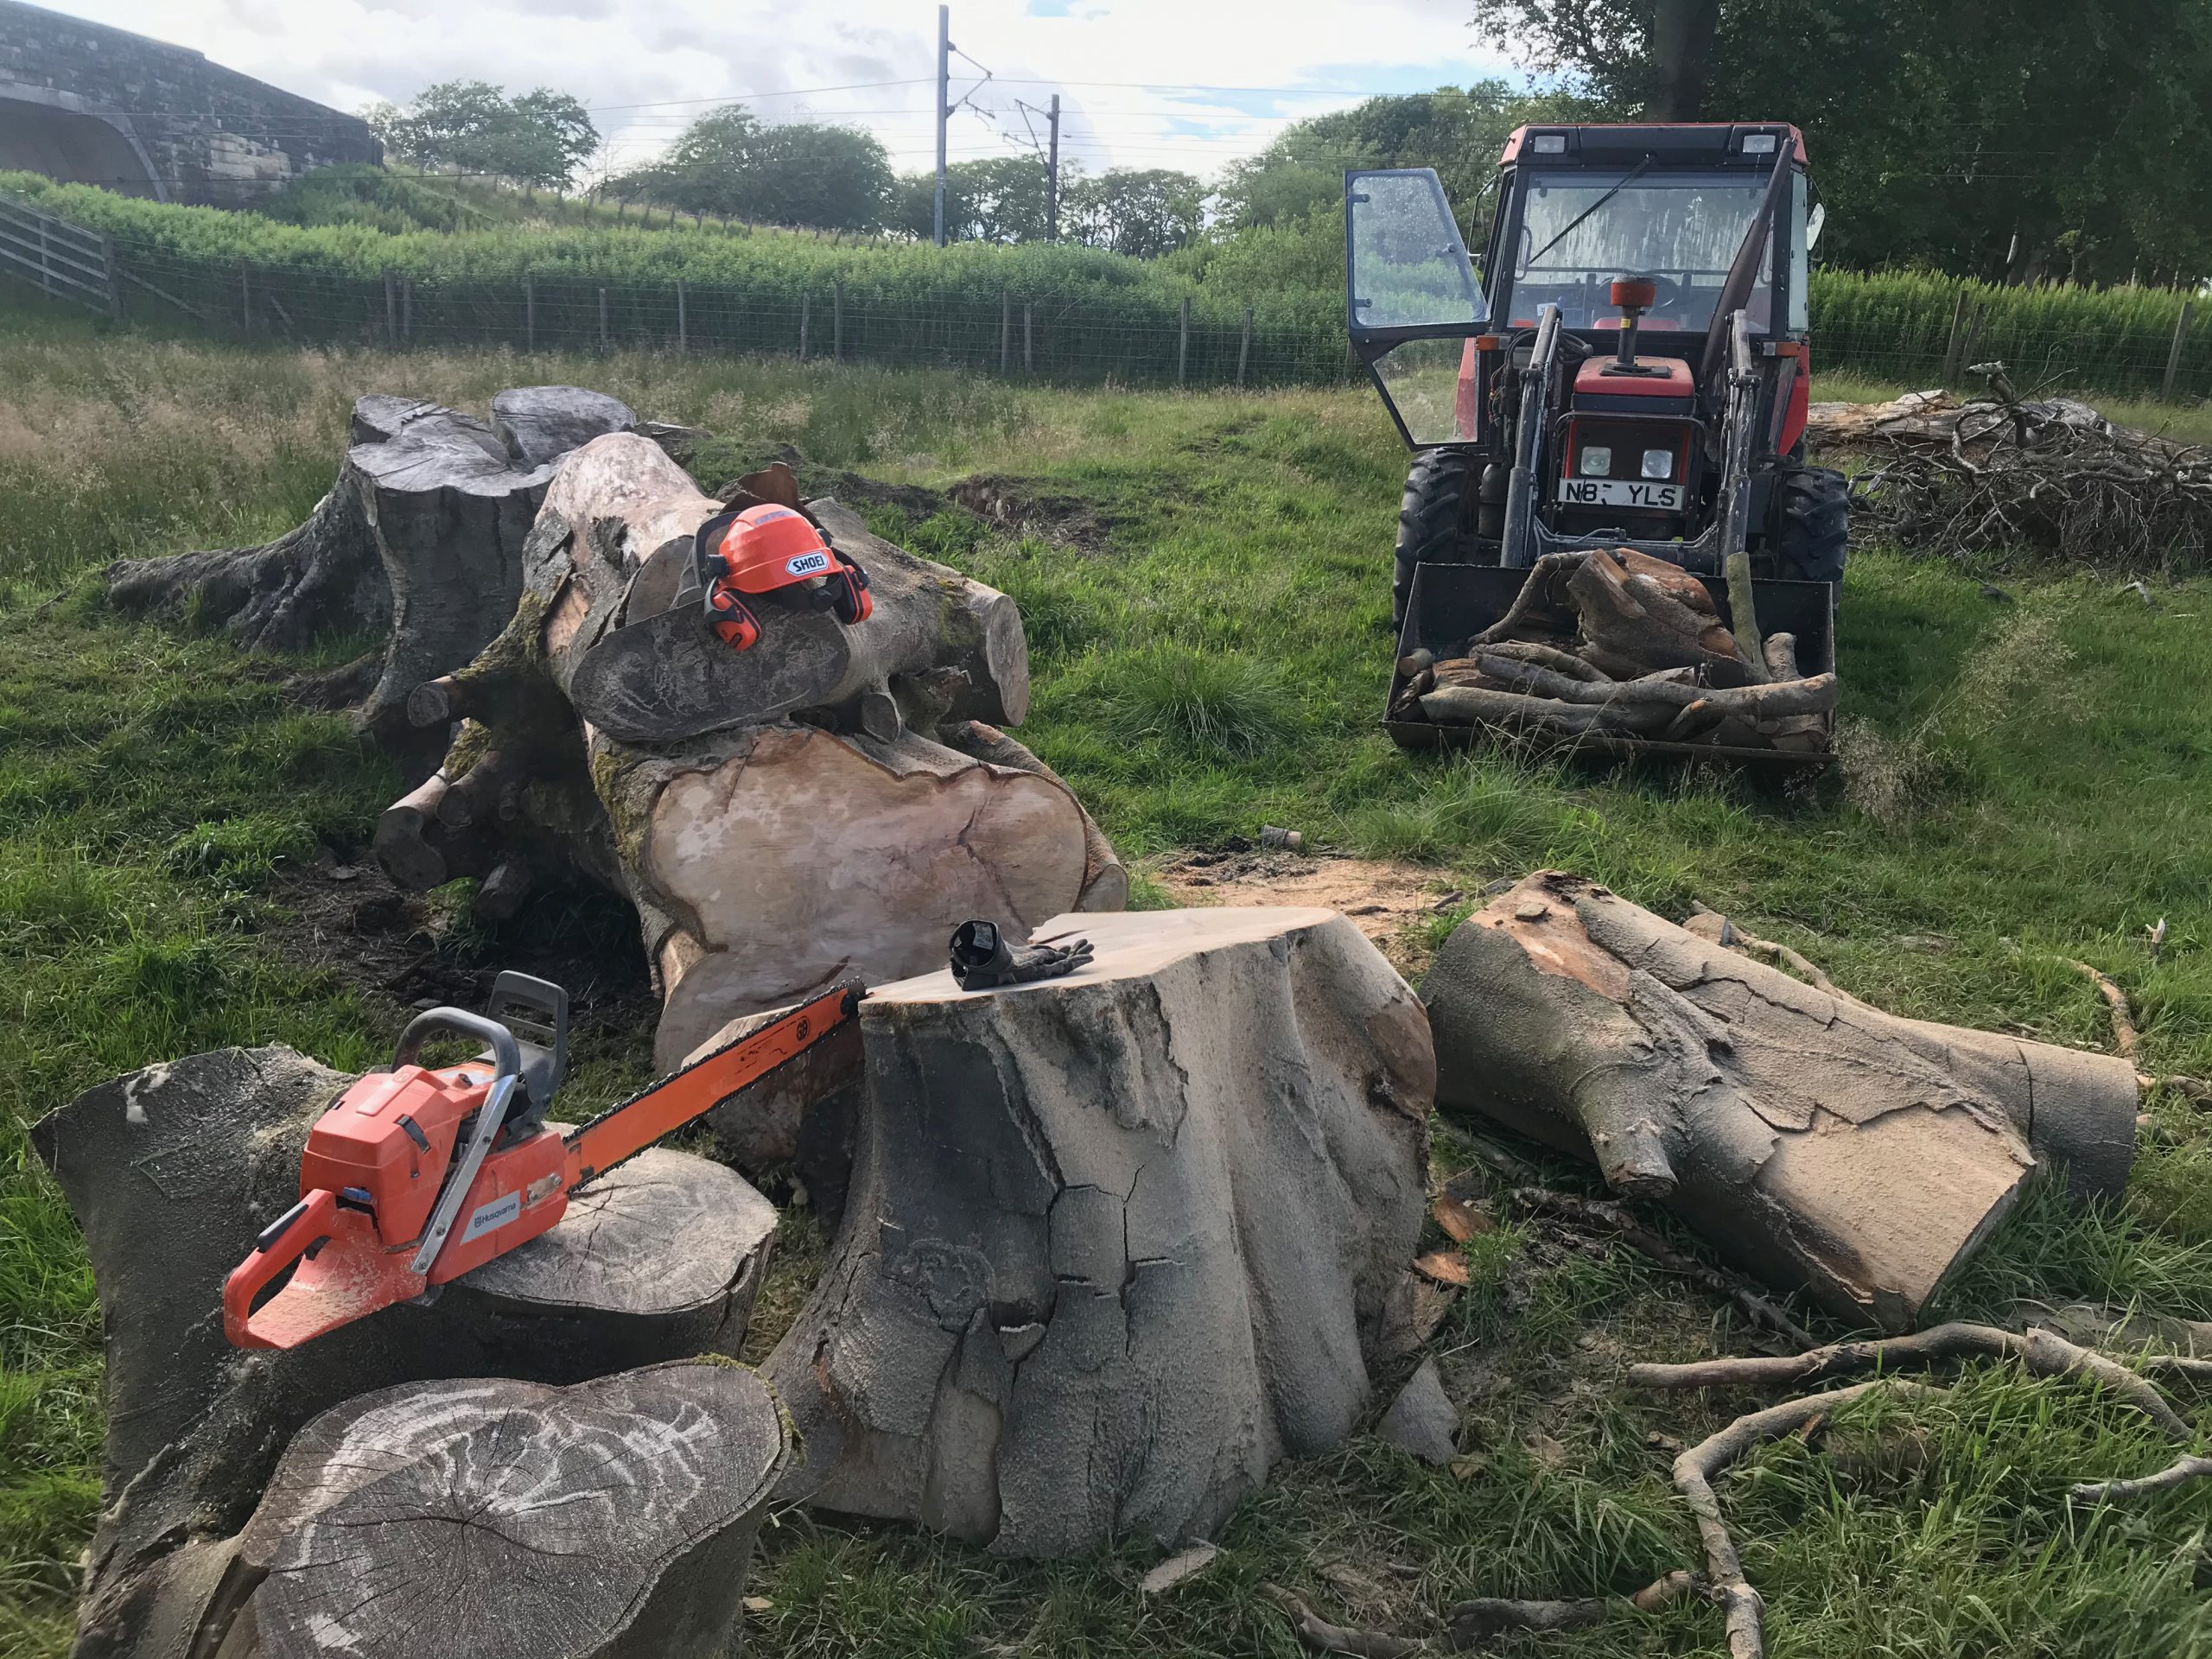
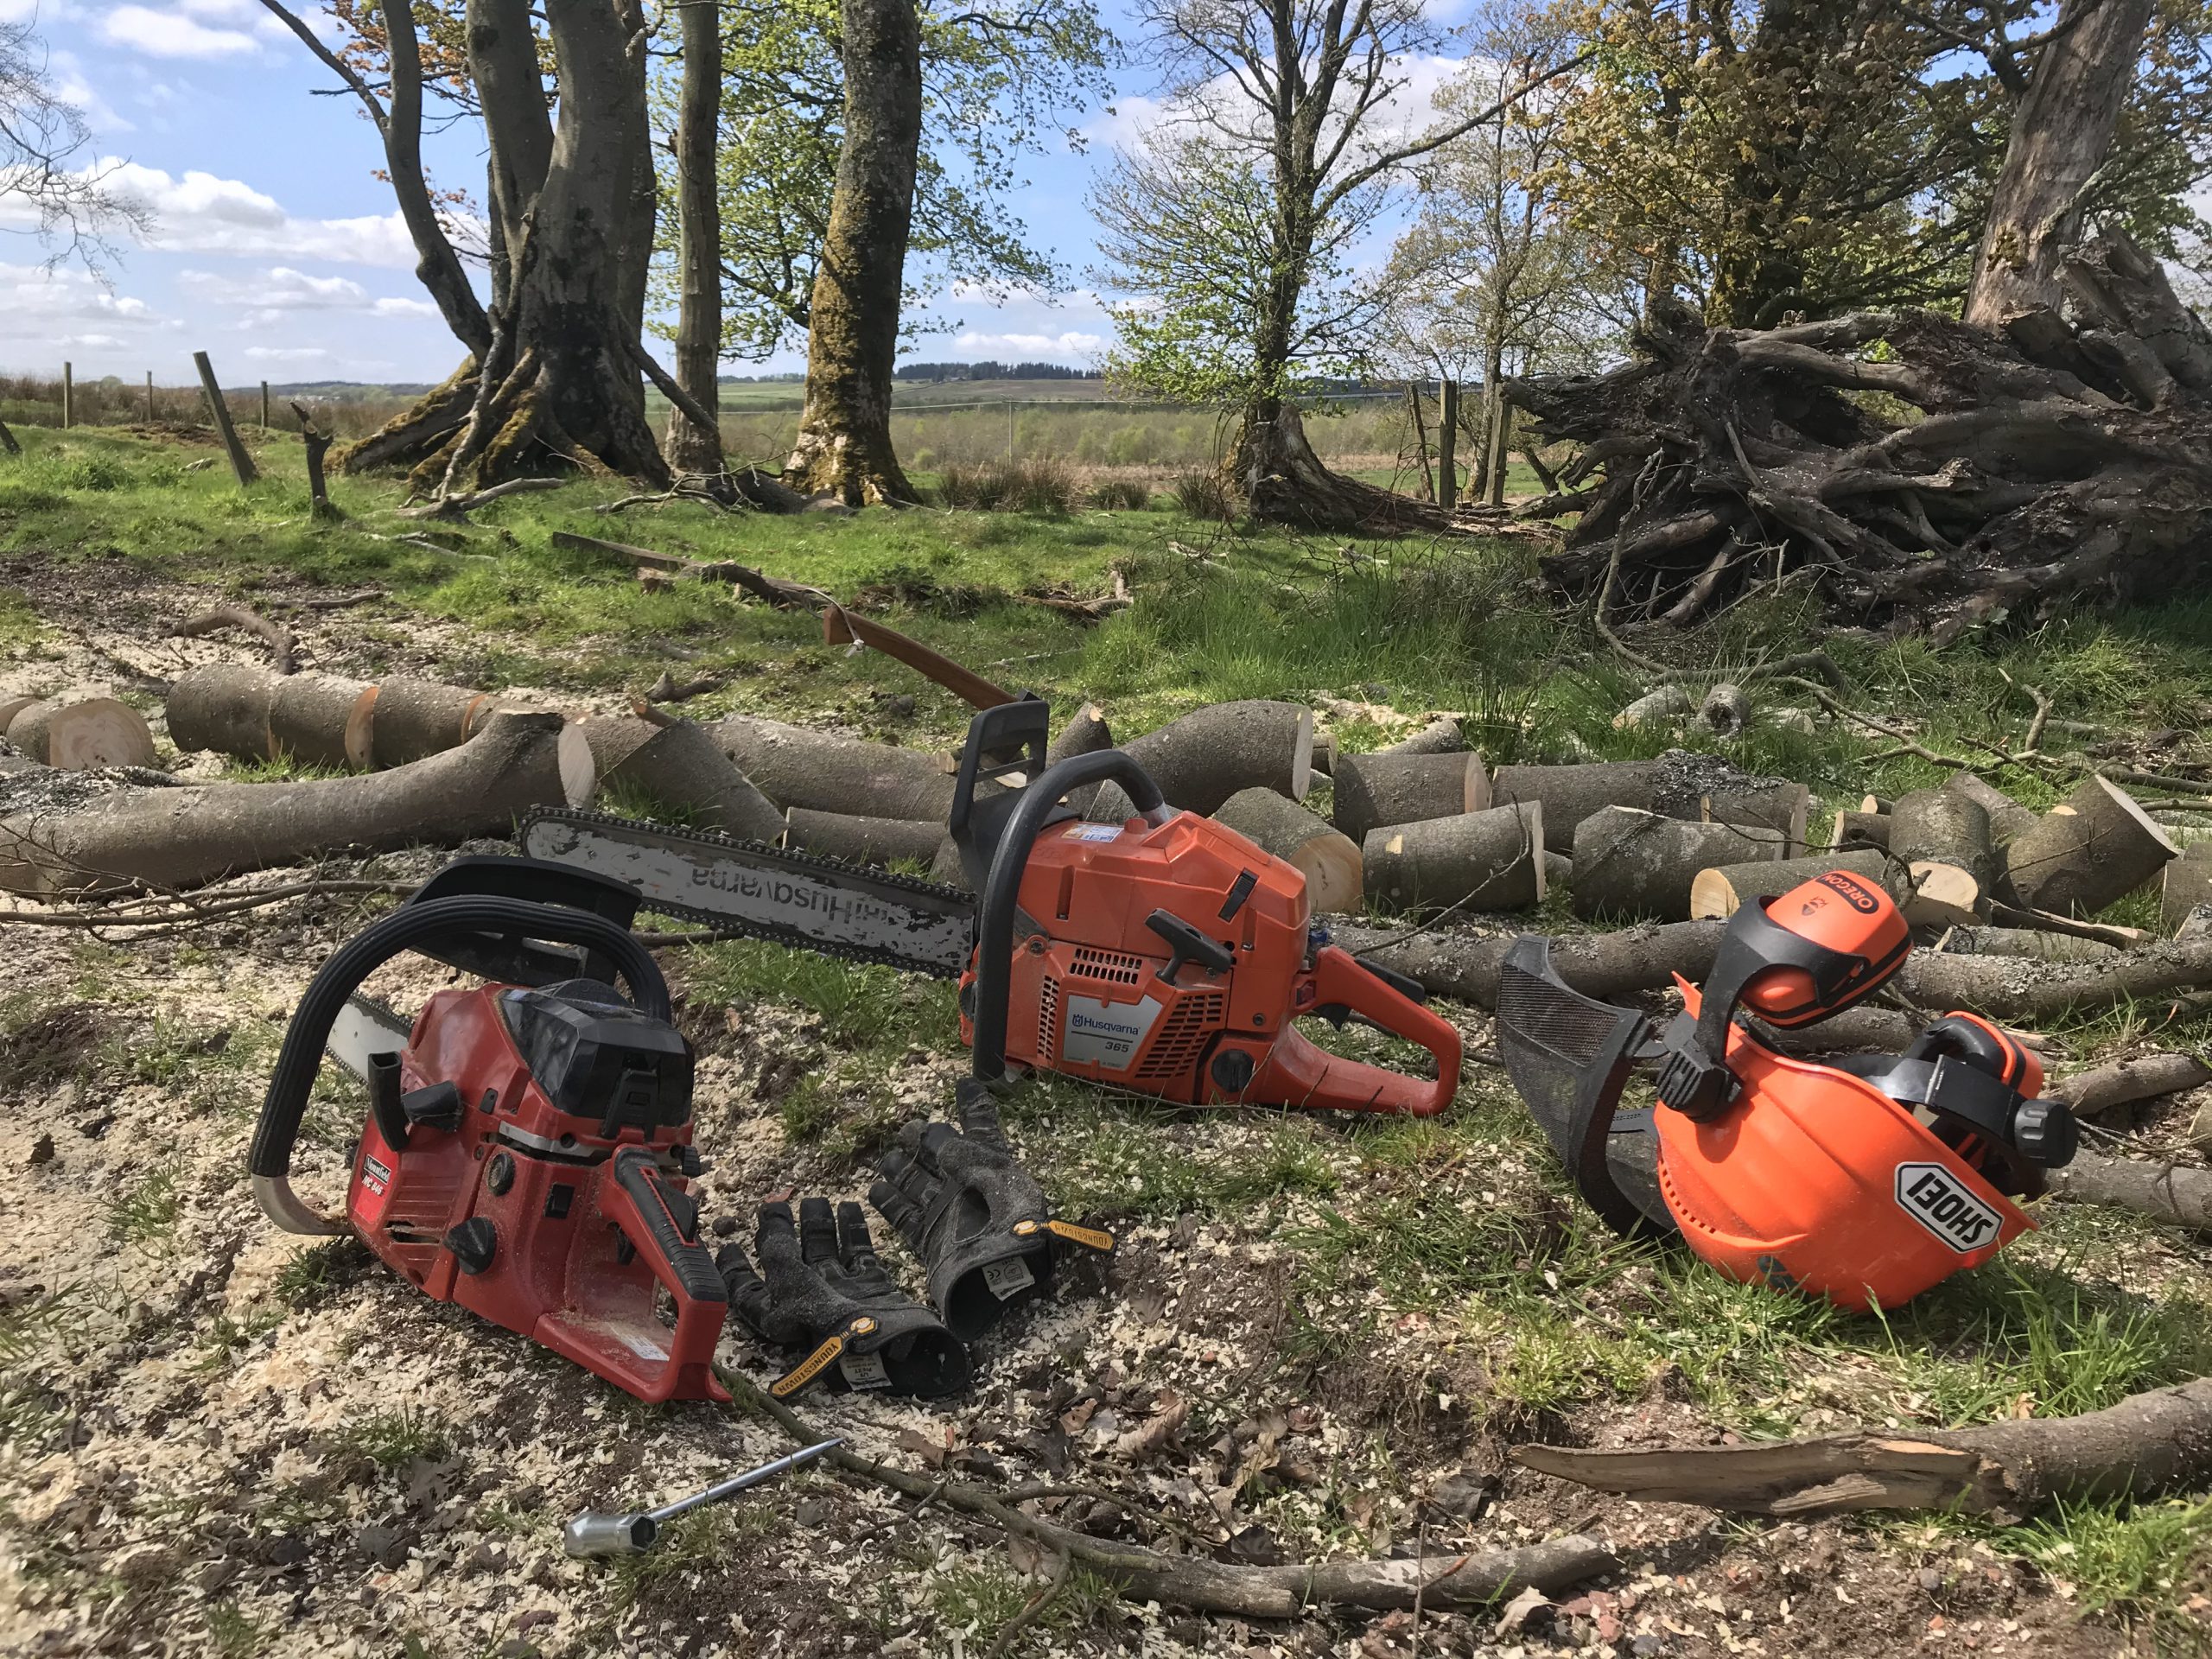
Gear – the Husqvarna 365 with its 20″ bar on and a recent chain from chainsawbars did almost all of the work no problem. My old Mountfield was having an off-day.
Root cause analysis – the lower 4 foot was rotten through. The other half of the tree is still standing and looks to be ok though.
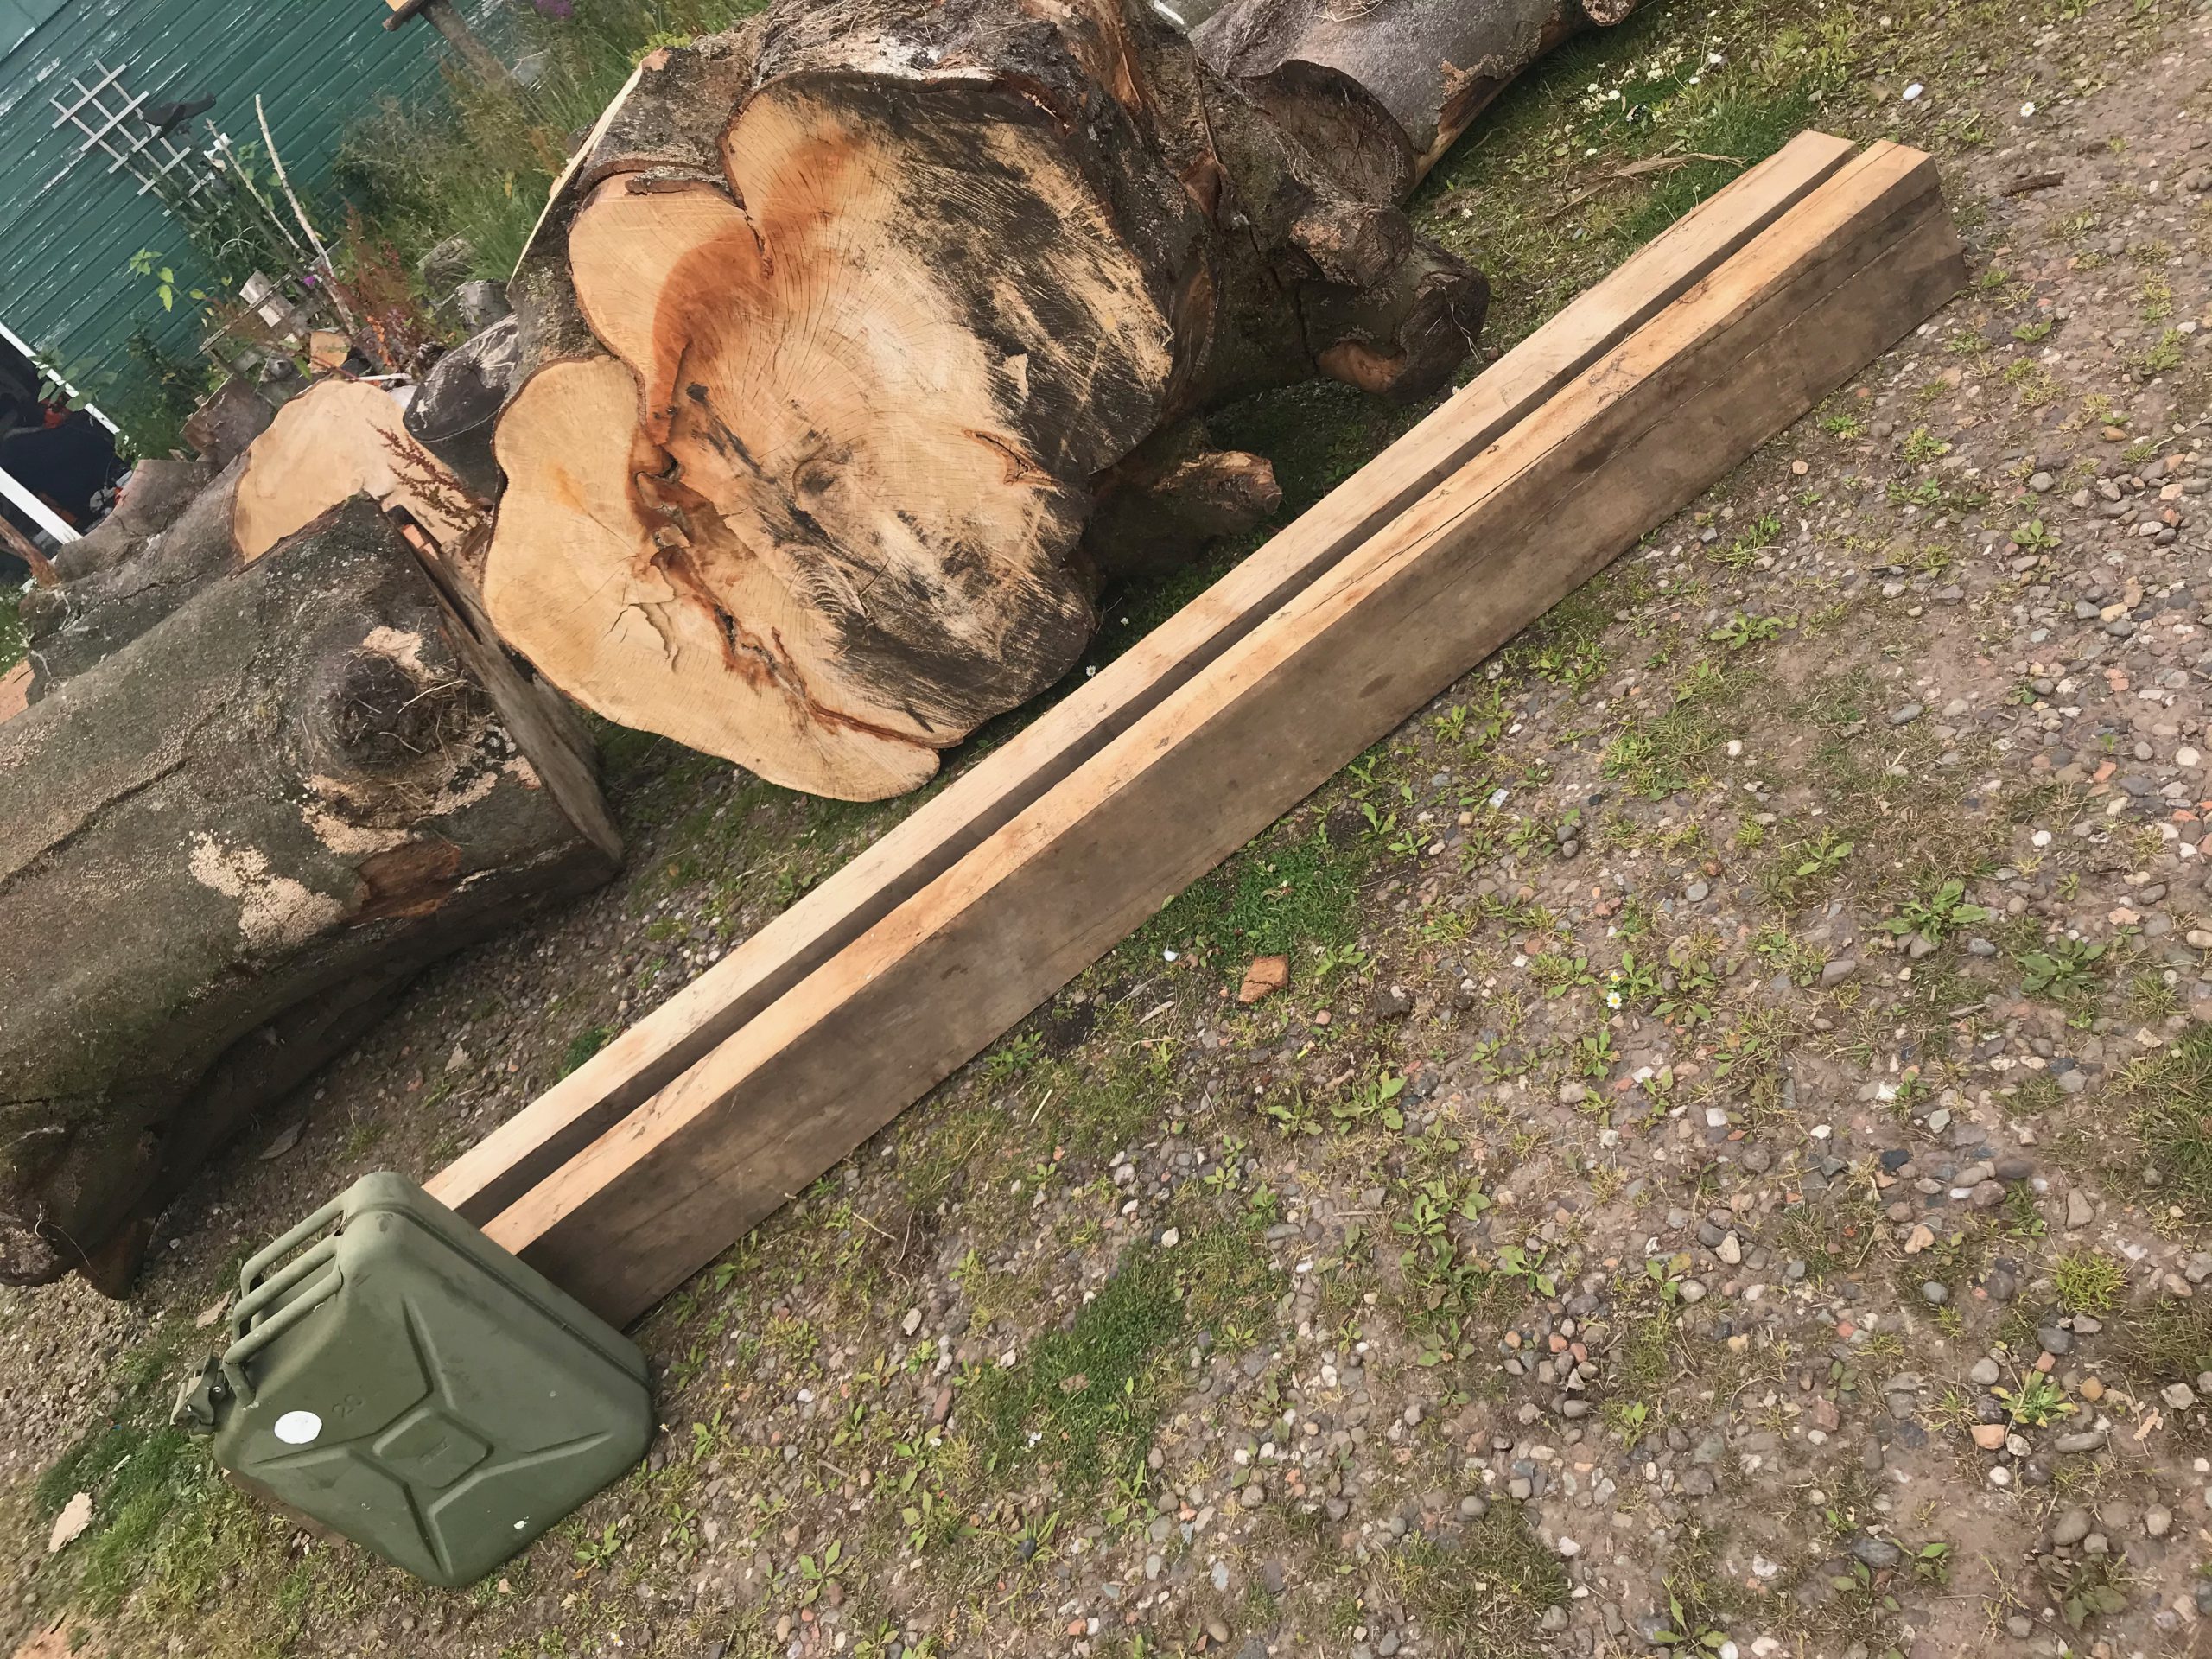
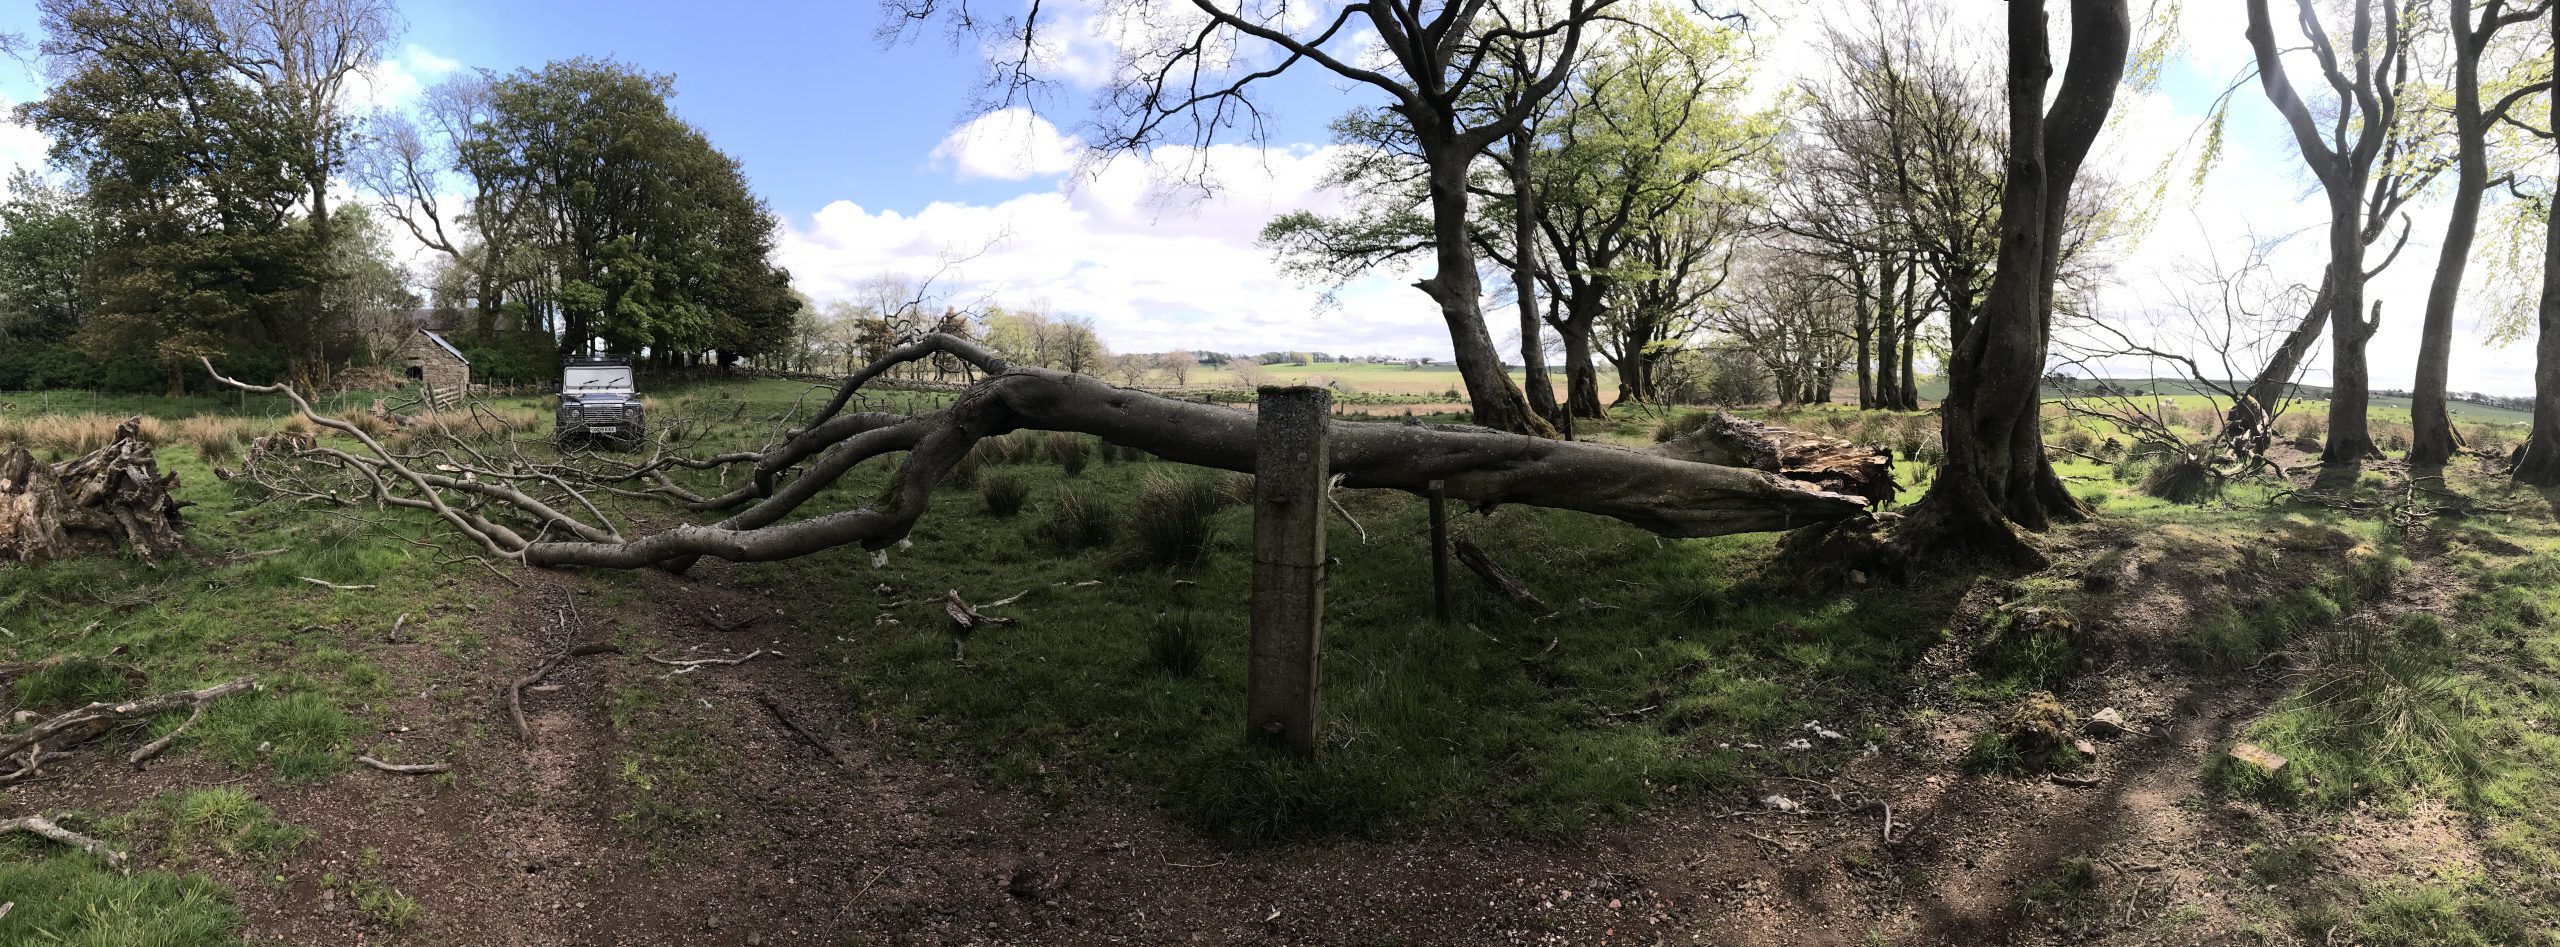
The good bits – I left these nice and straight looking 6 and 4 foot sections in place to bring home with the tractor later. The ends have been sealed and I plan to mill them in to 2″ planks and maybe some thicker slabs
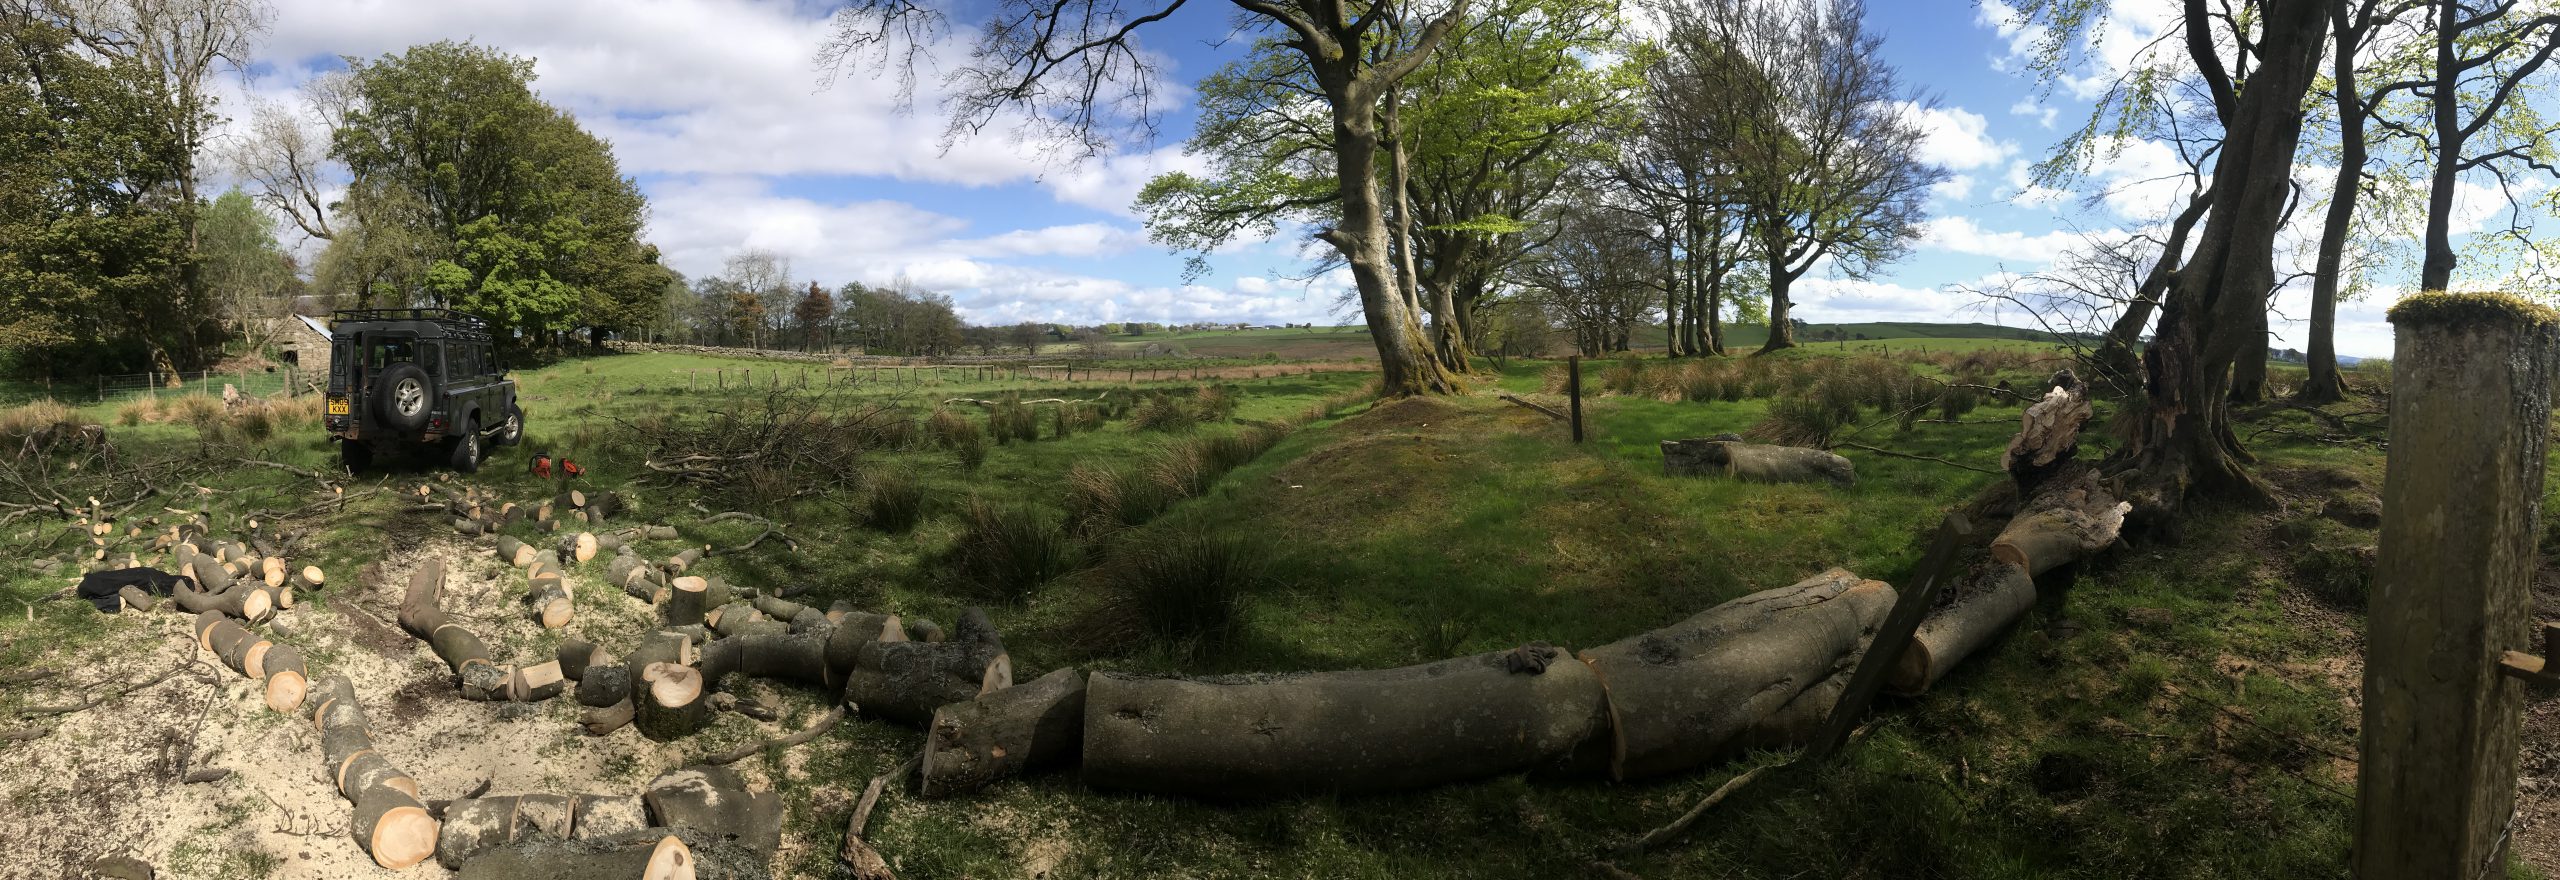
The (panoramic) aftermath
And a truck full (ok, not quite, it was a long afternoon) of firewood that was delivered to a neighbour
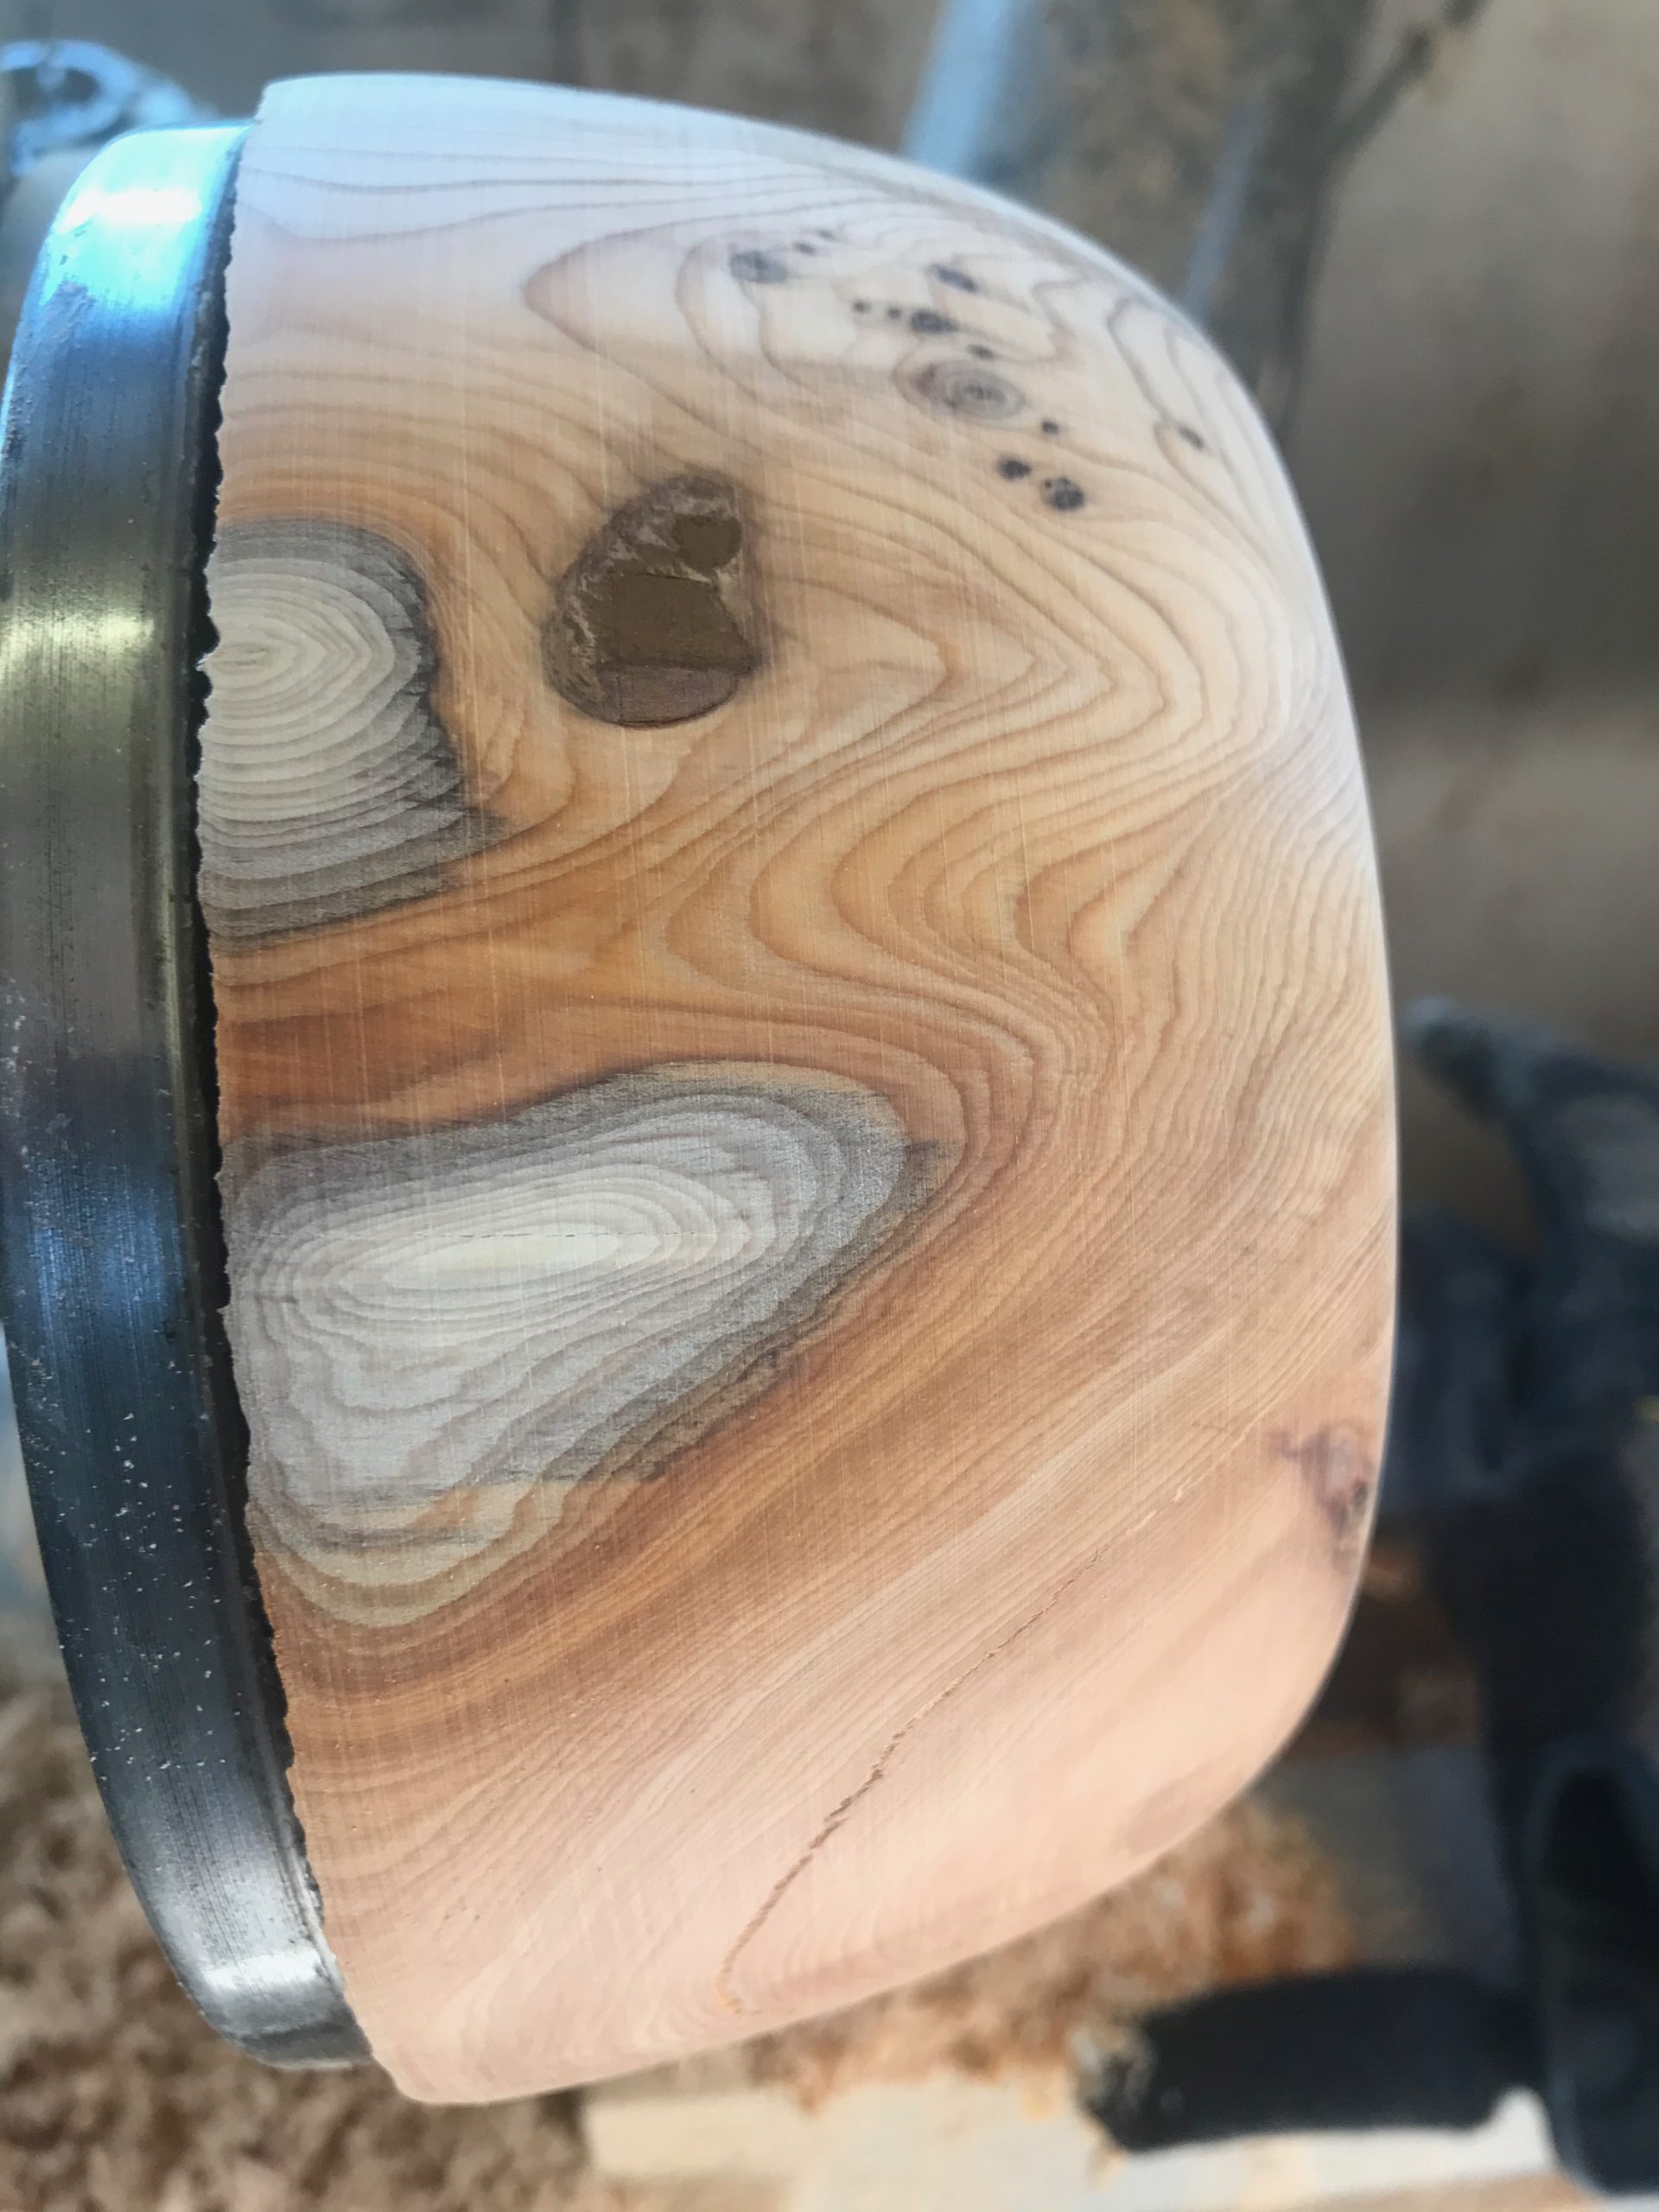
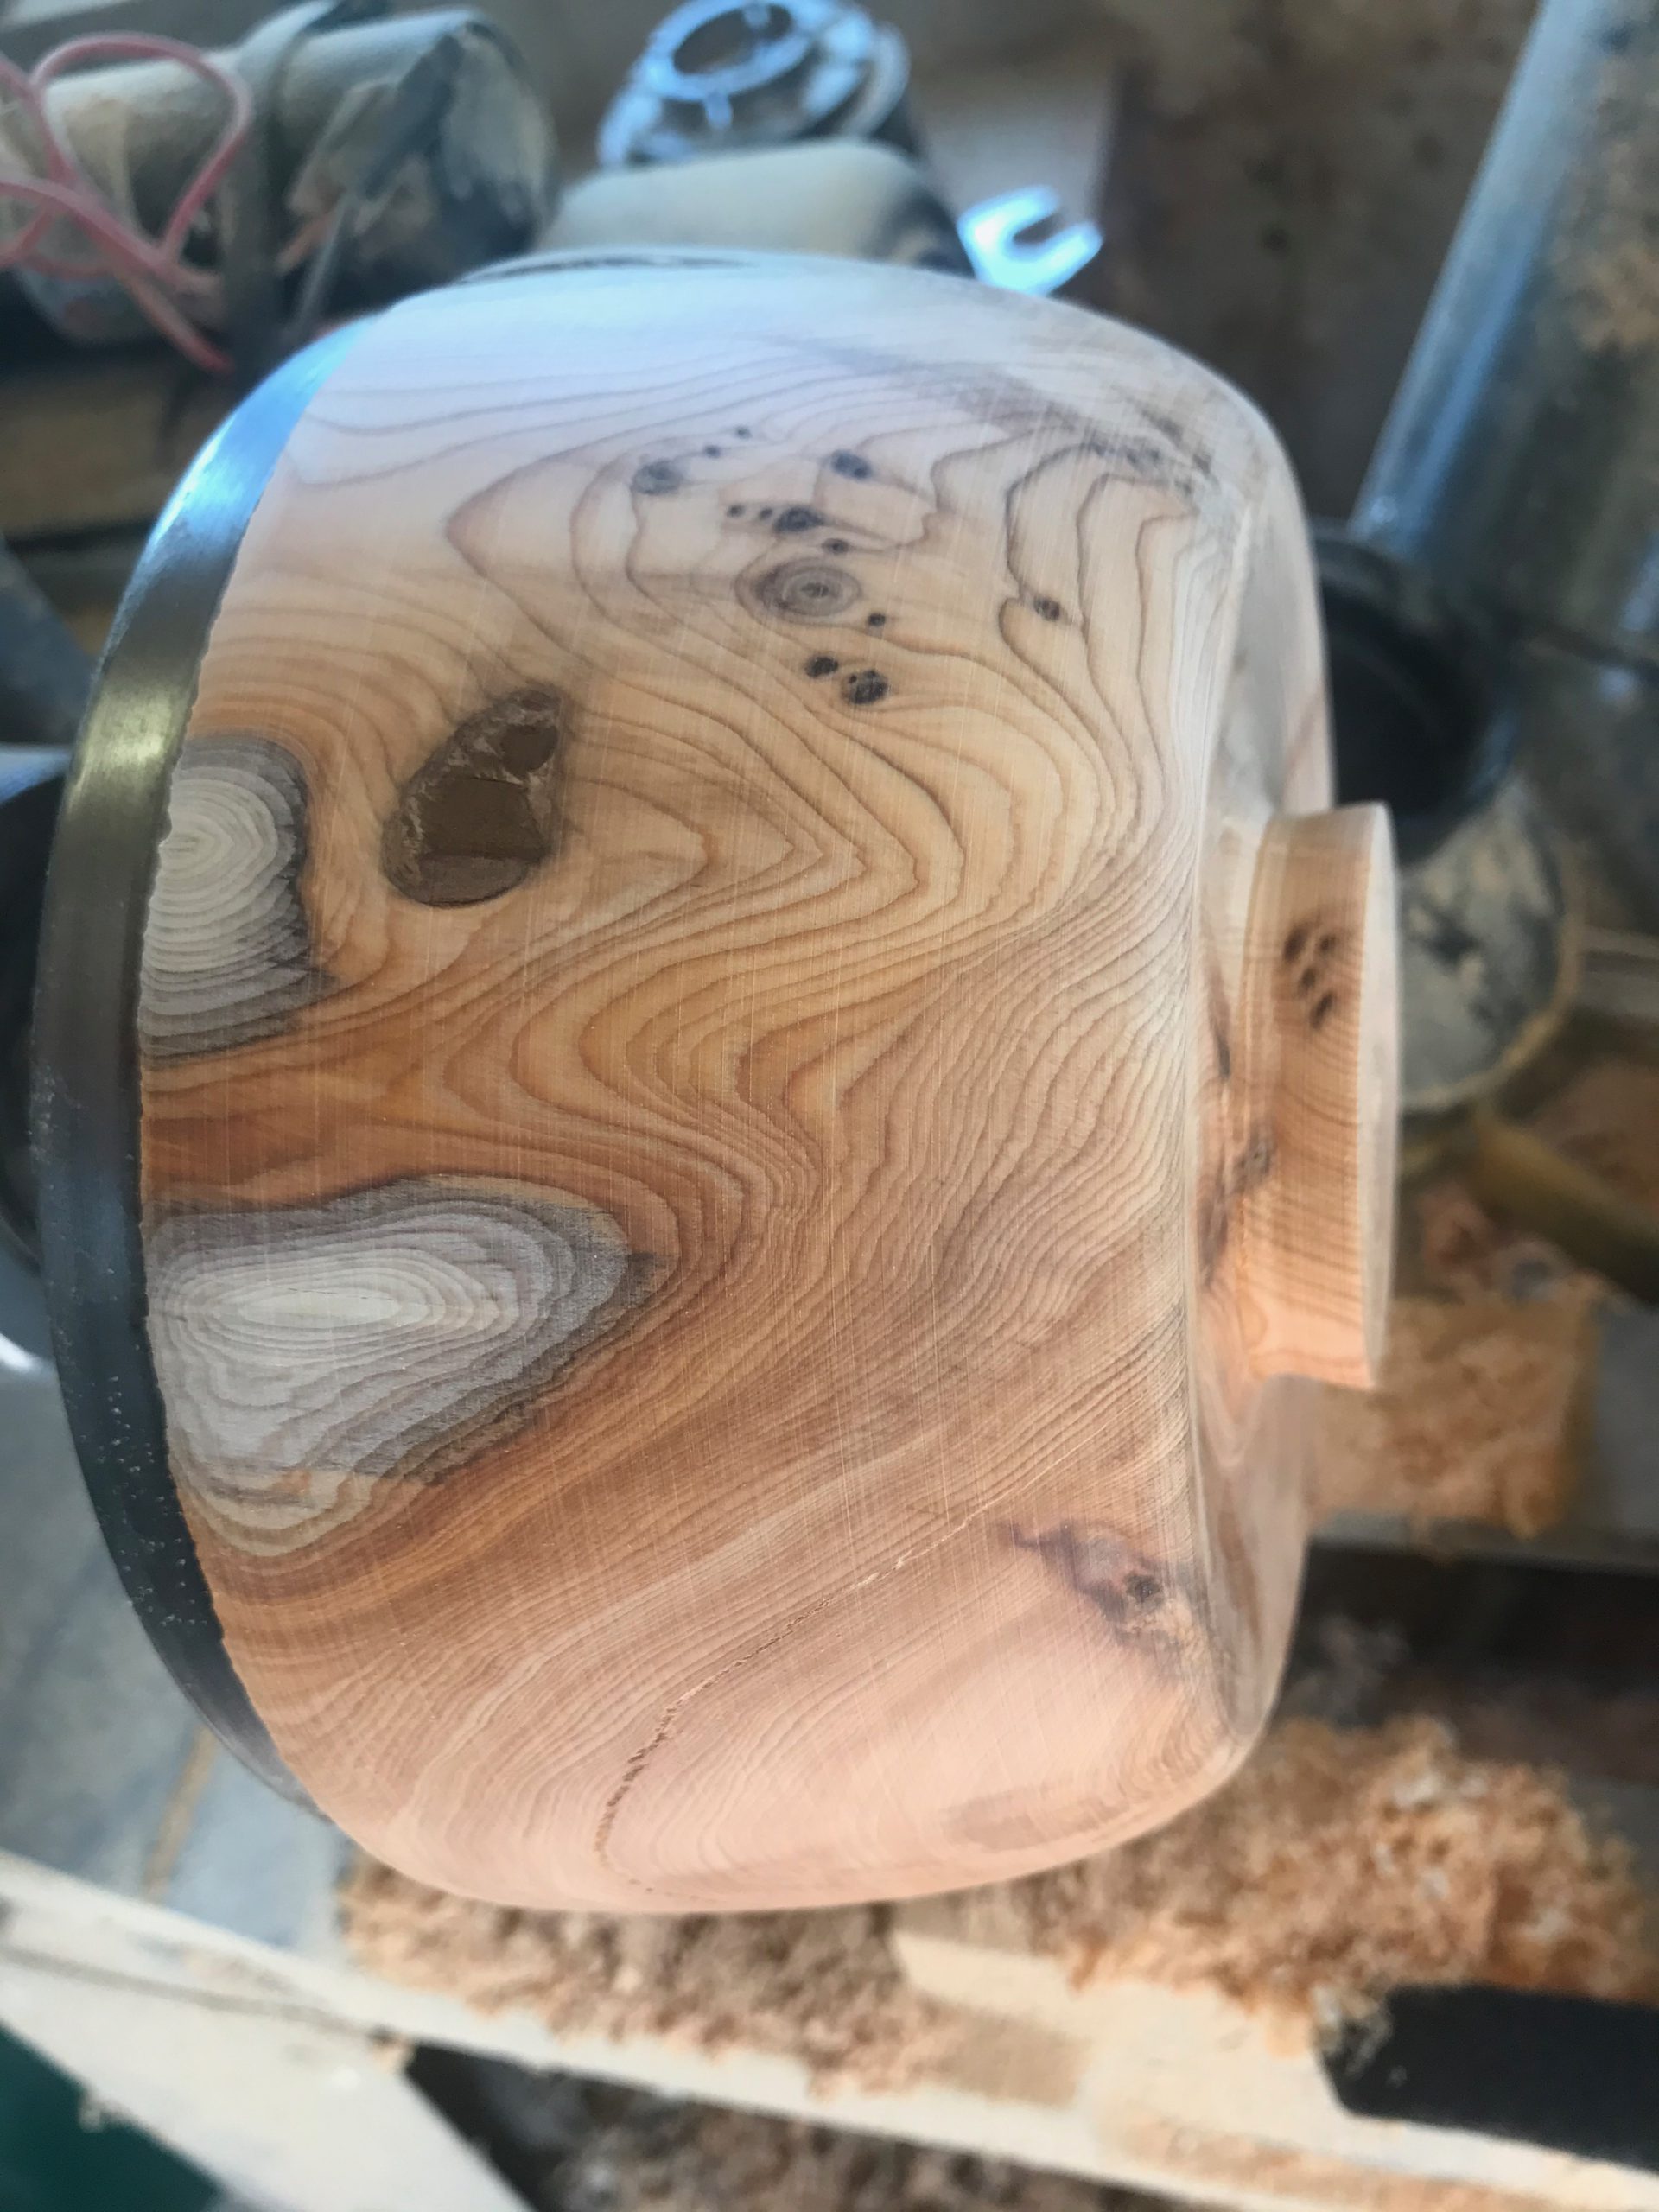
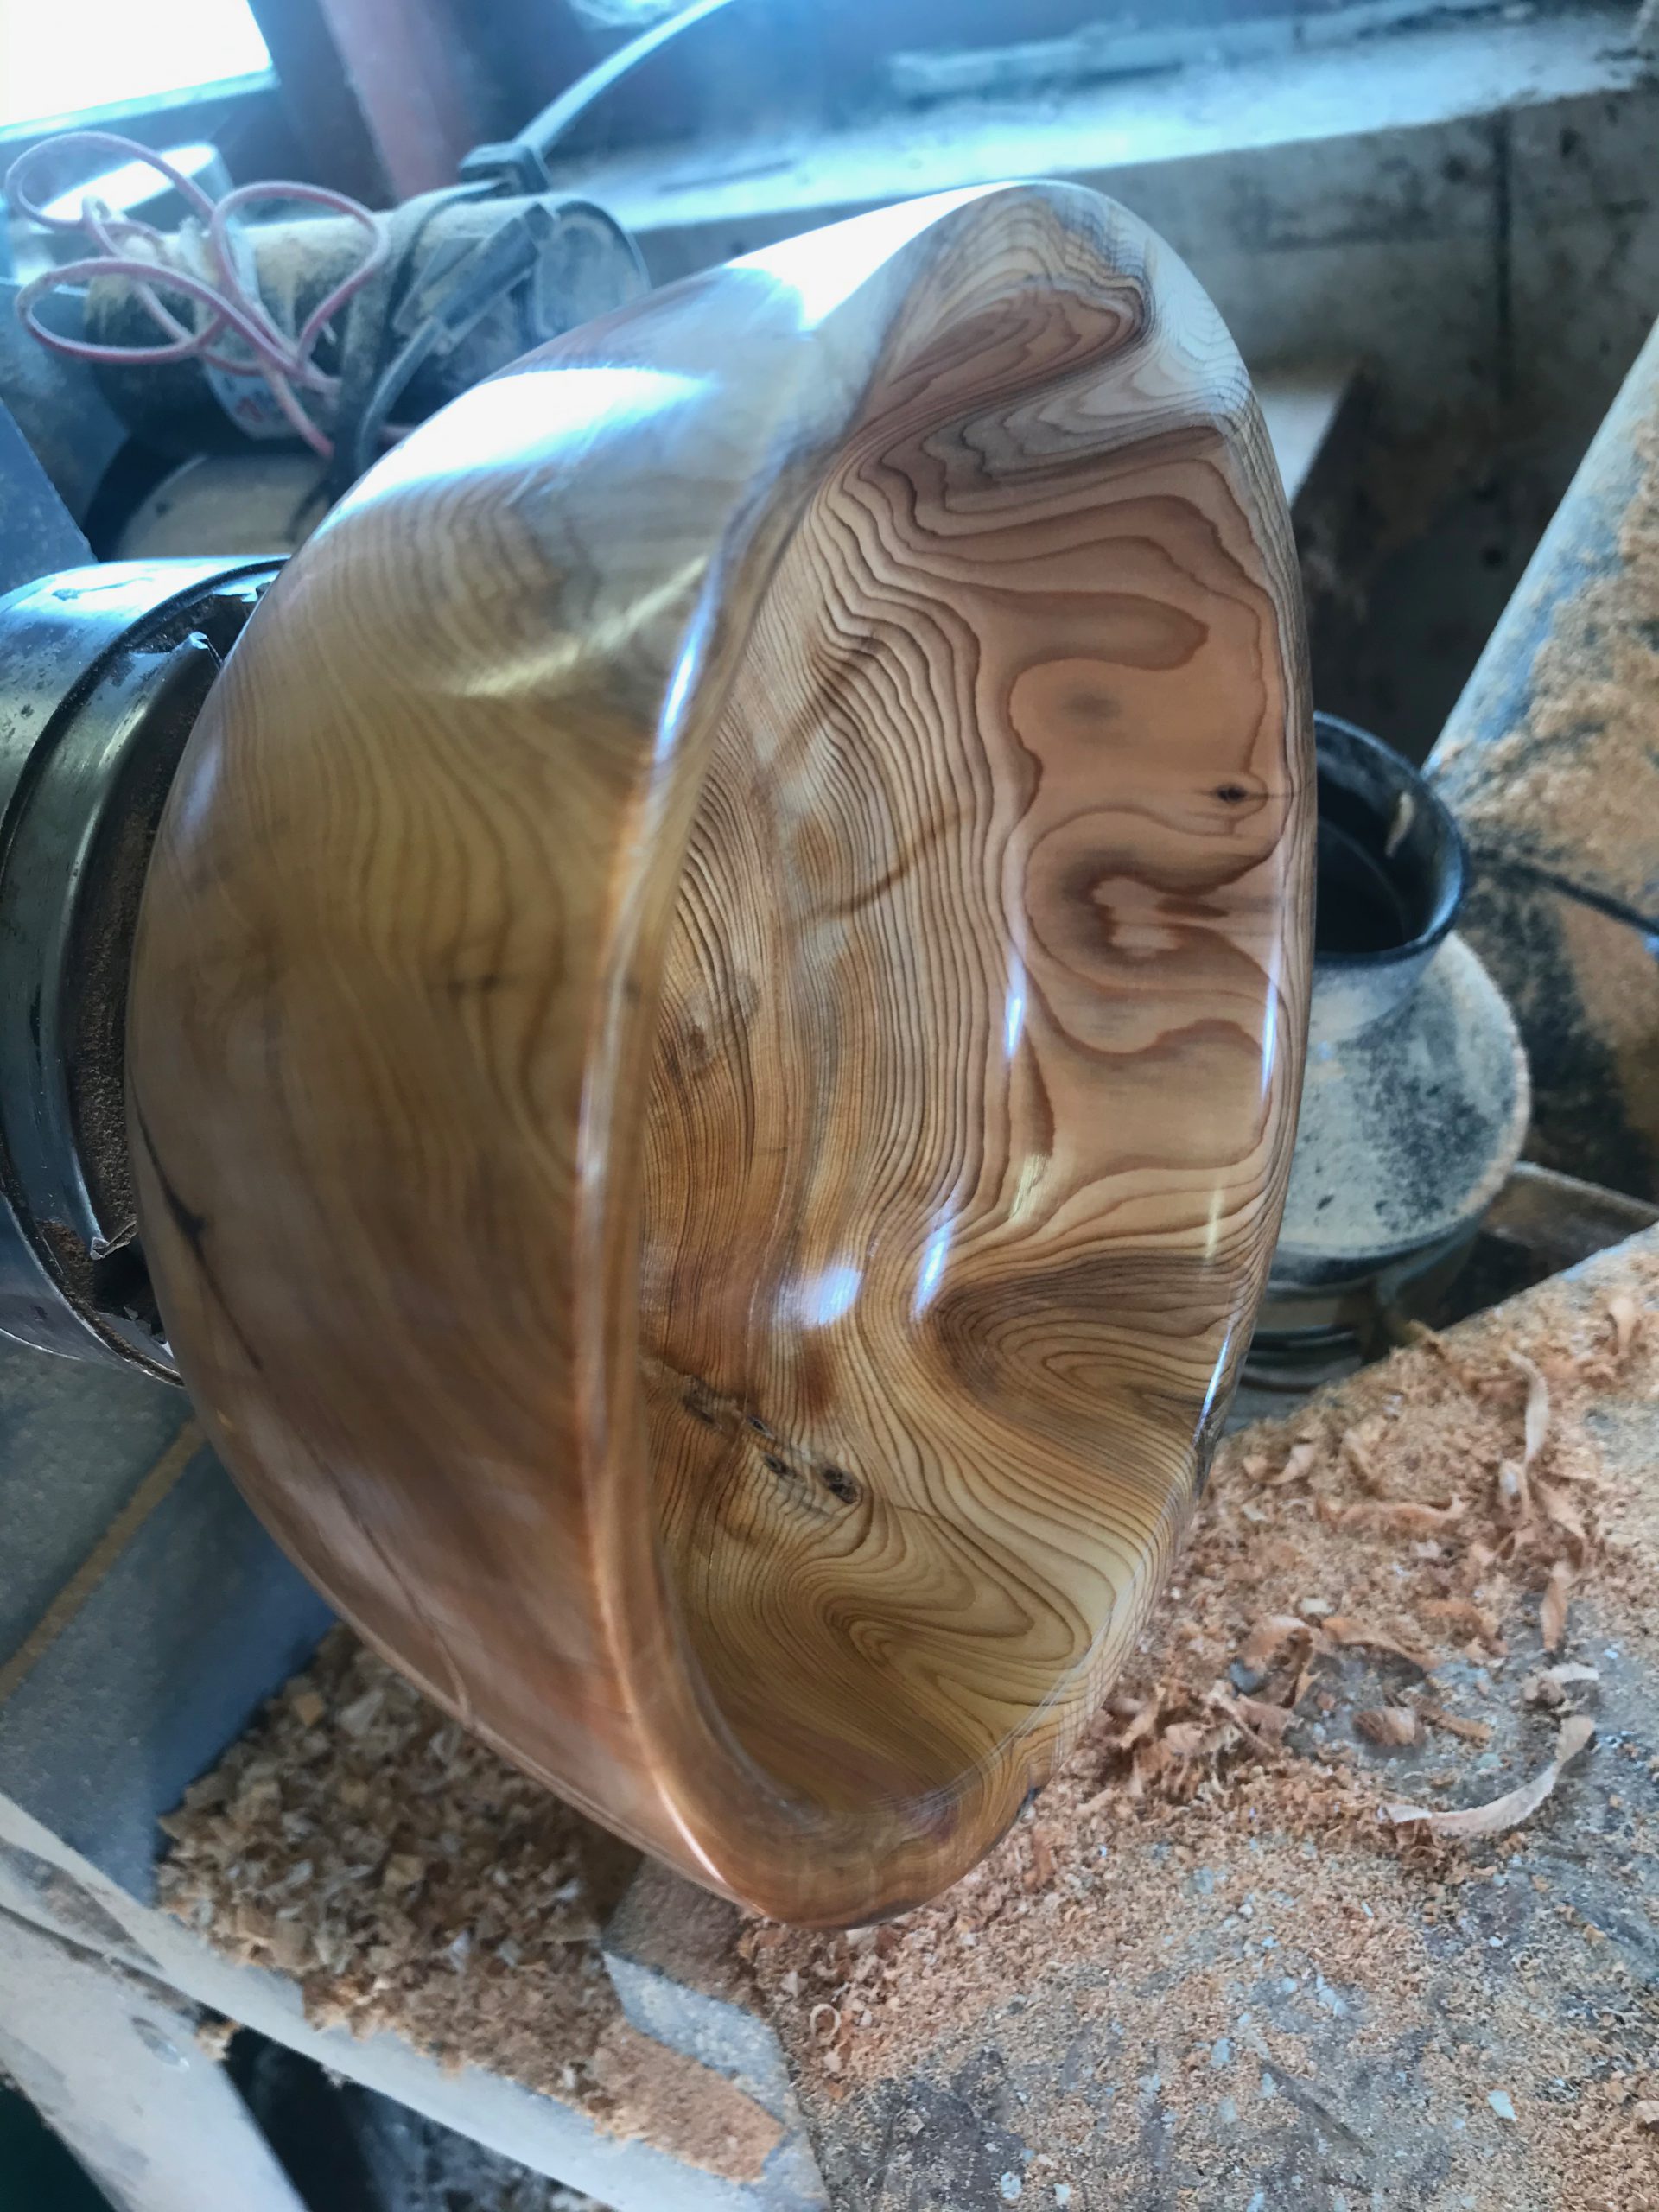
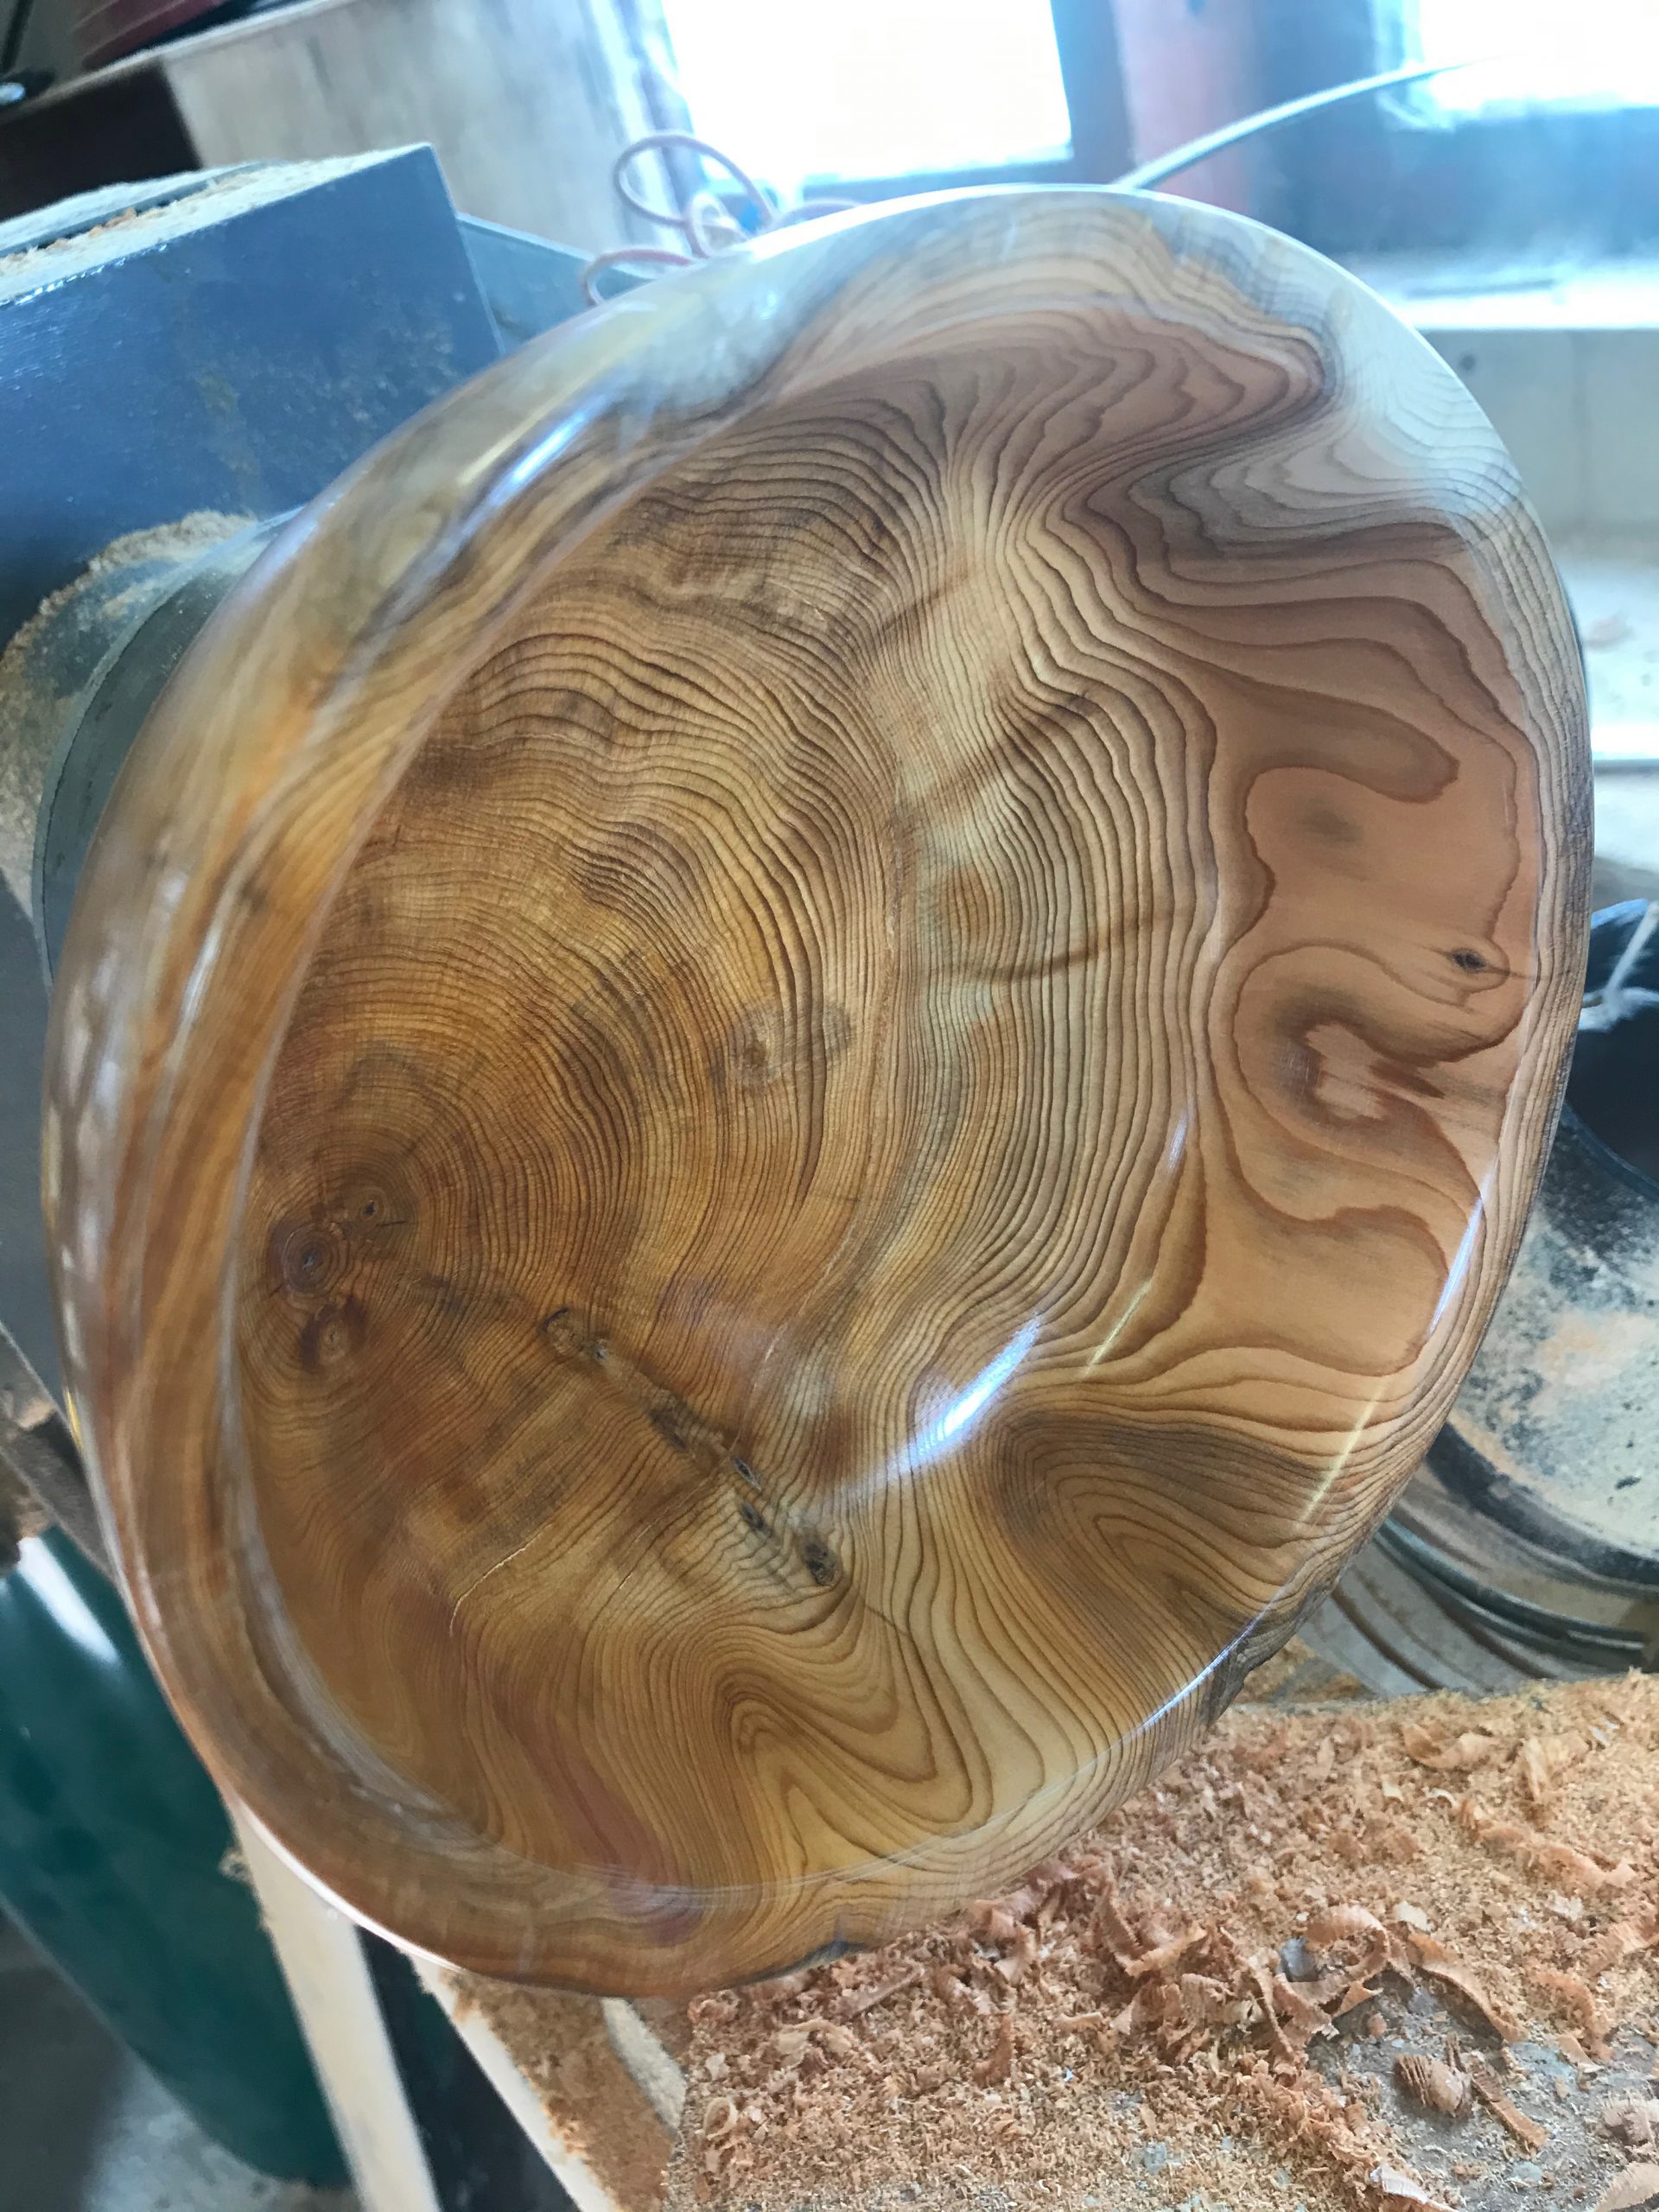
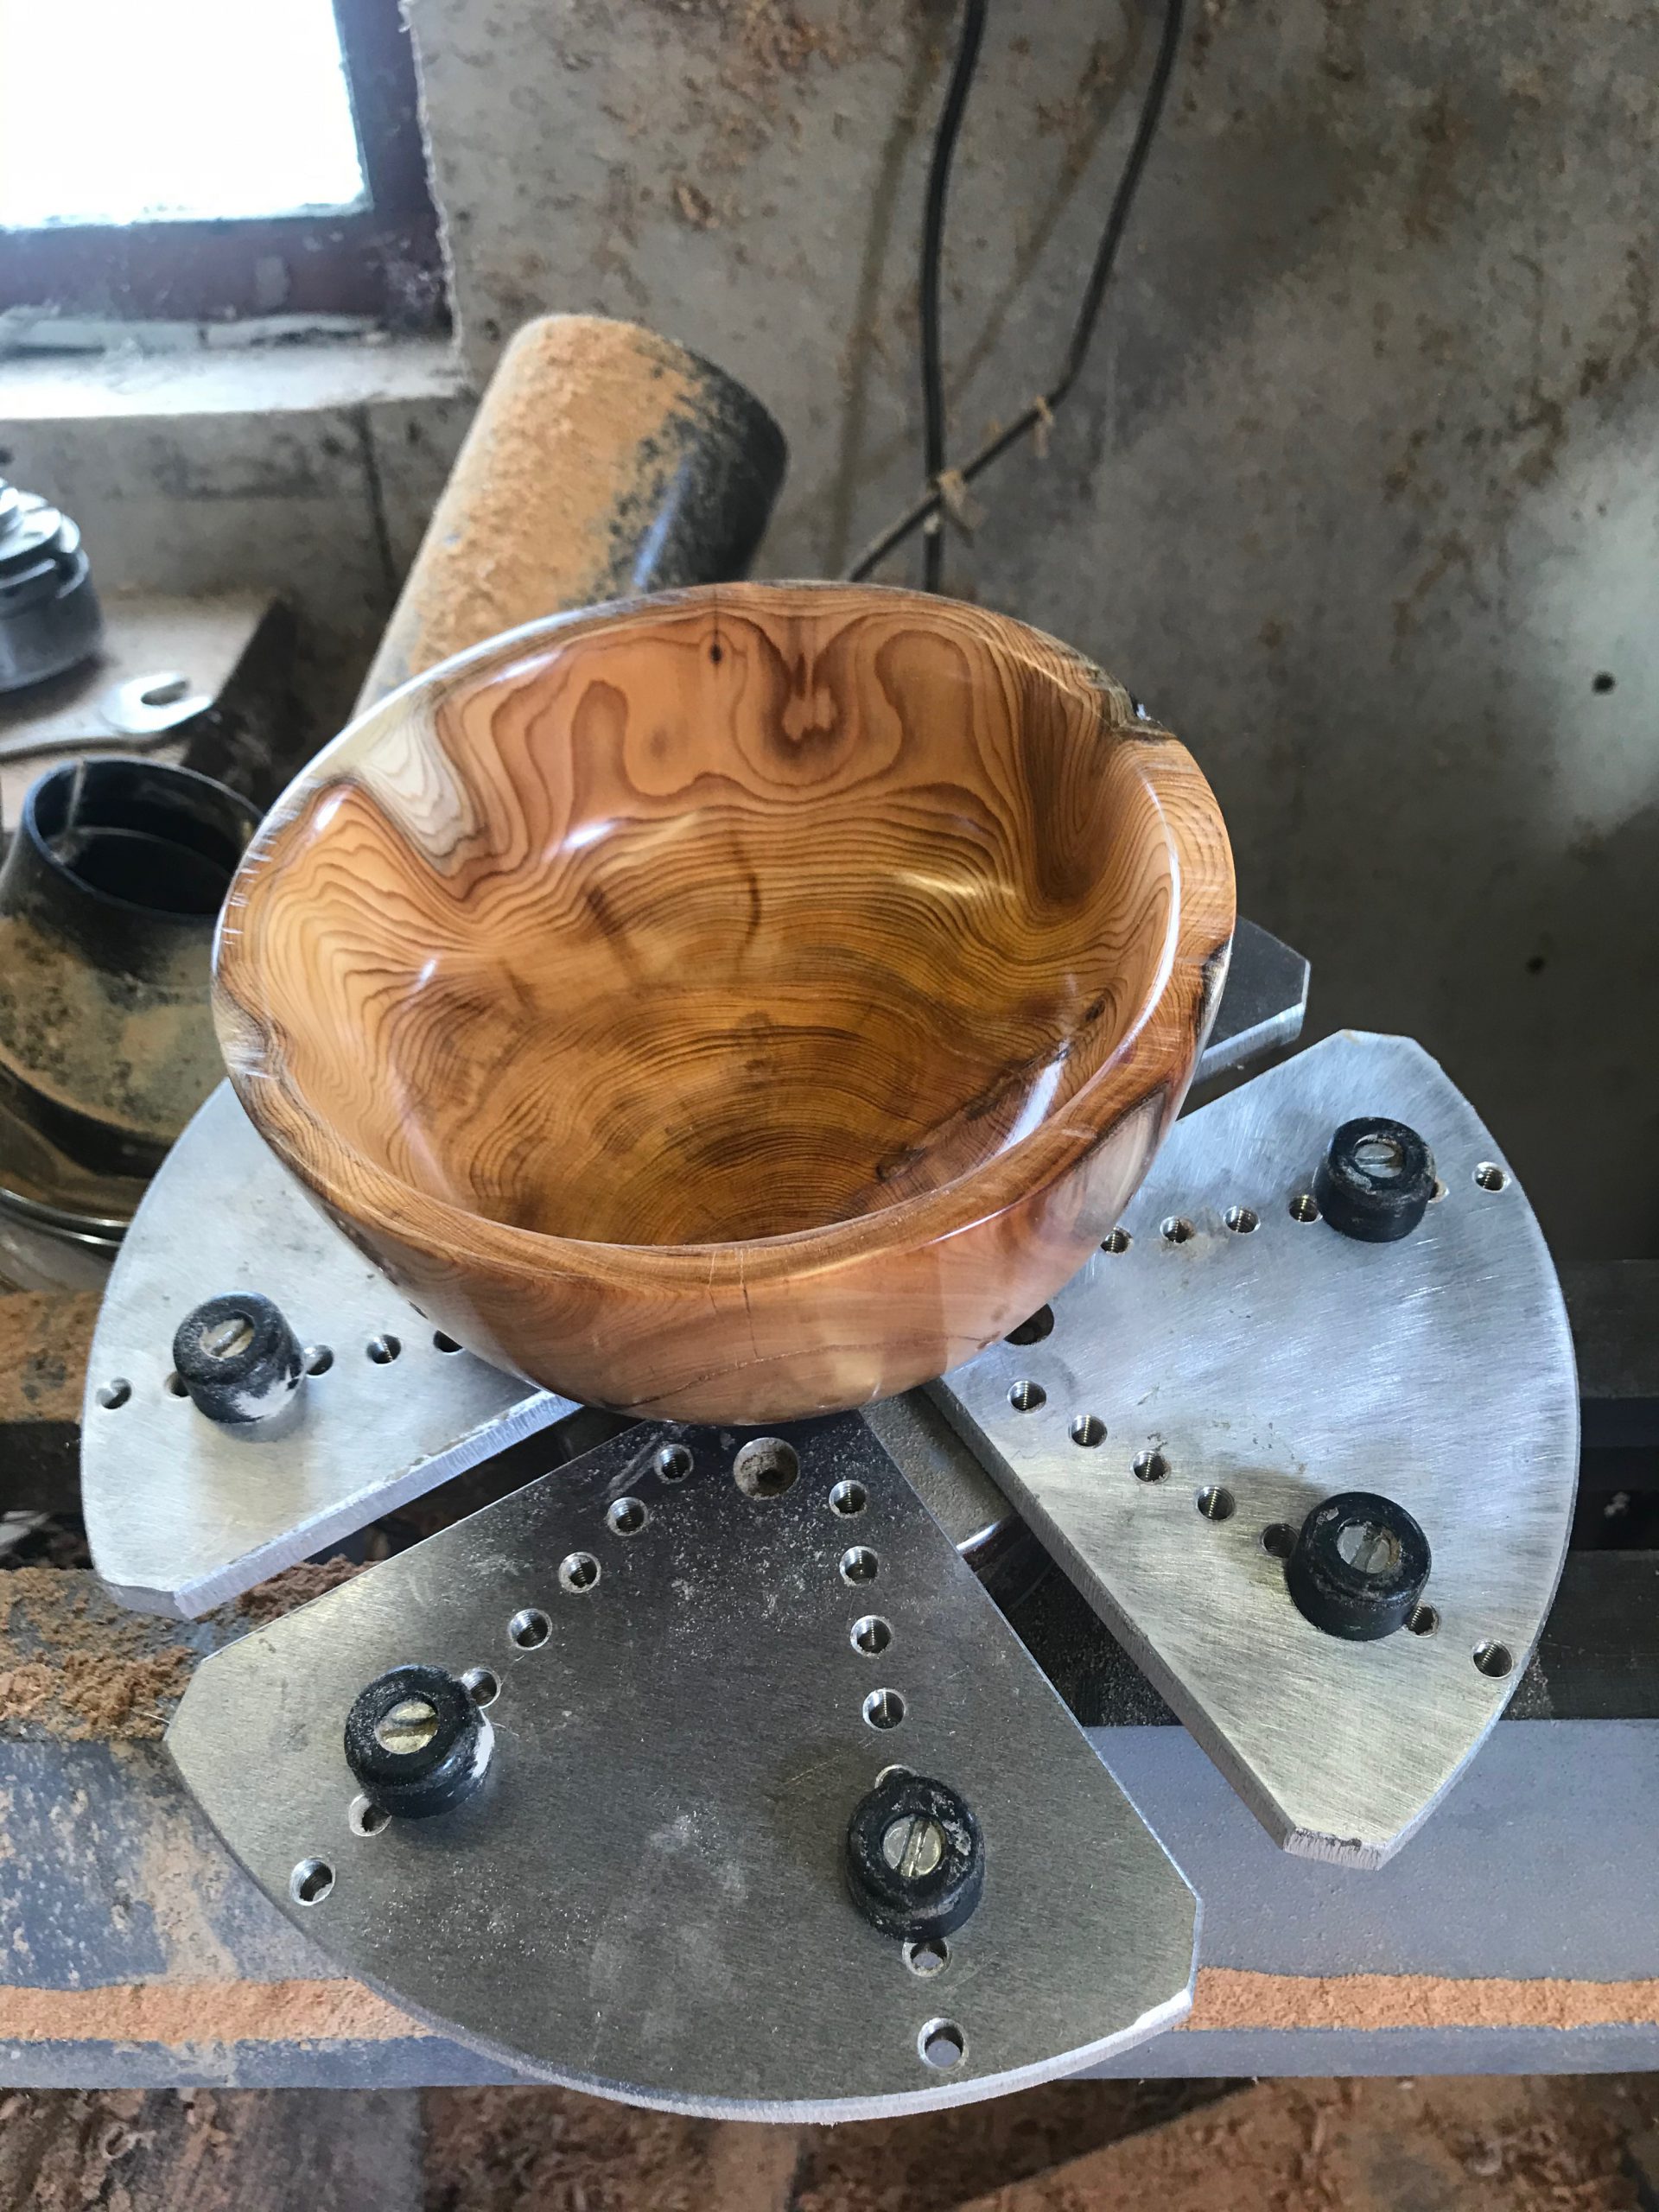
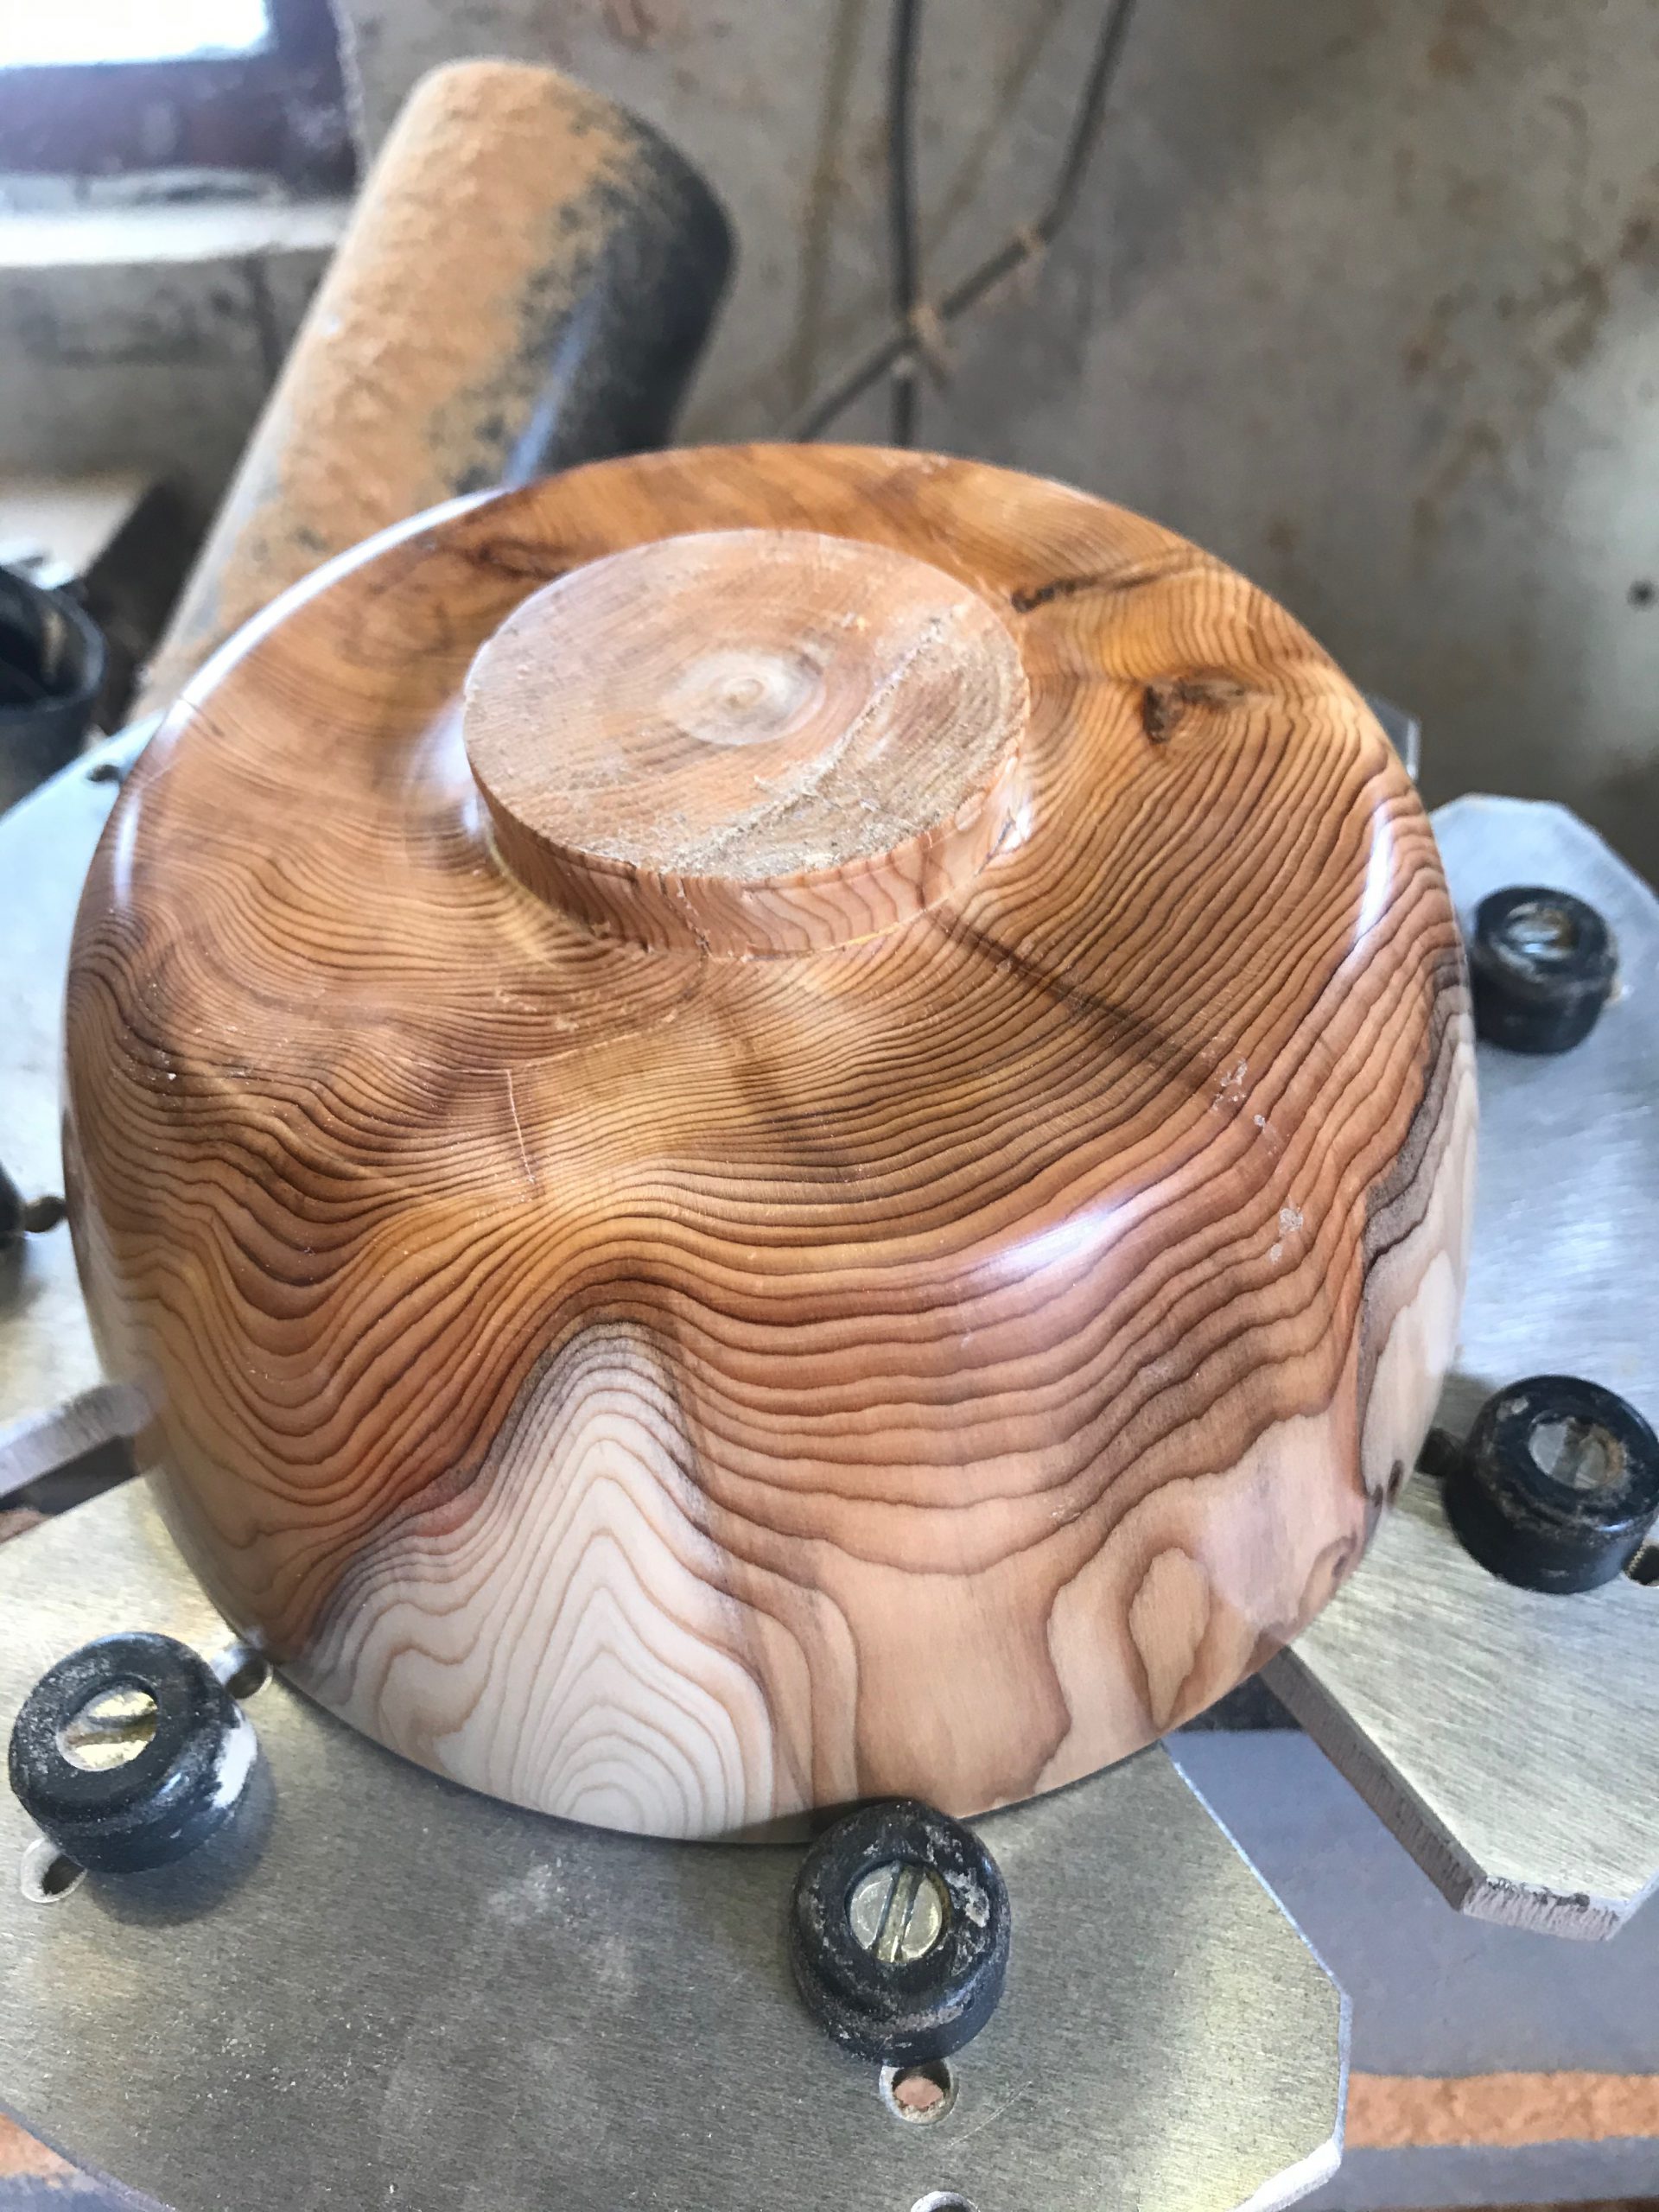
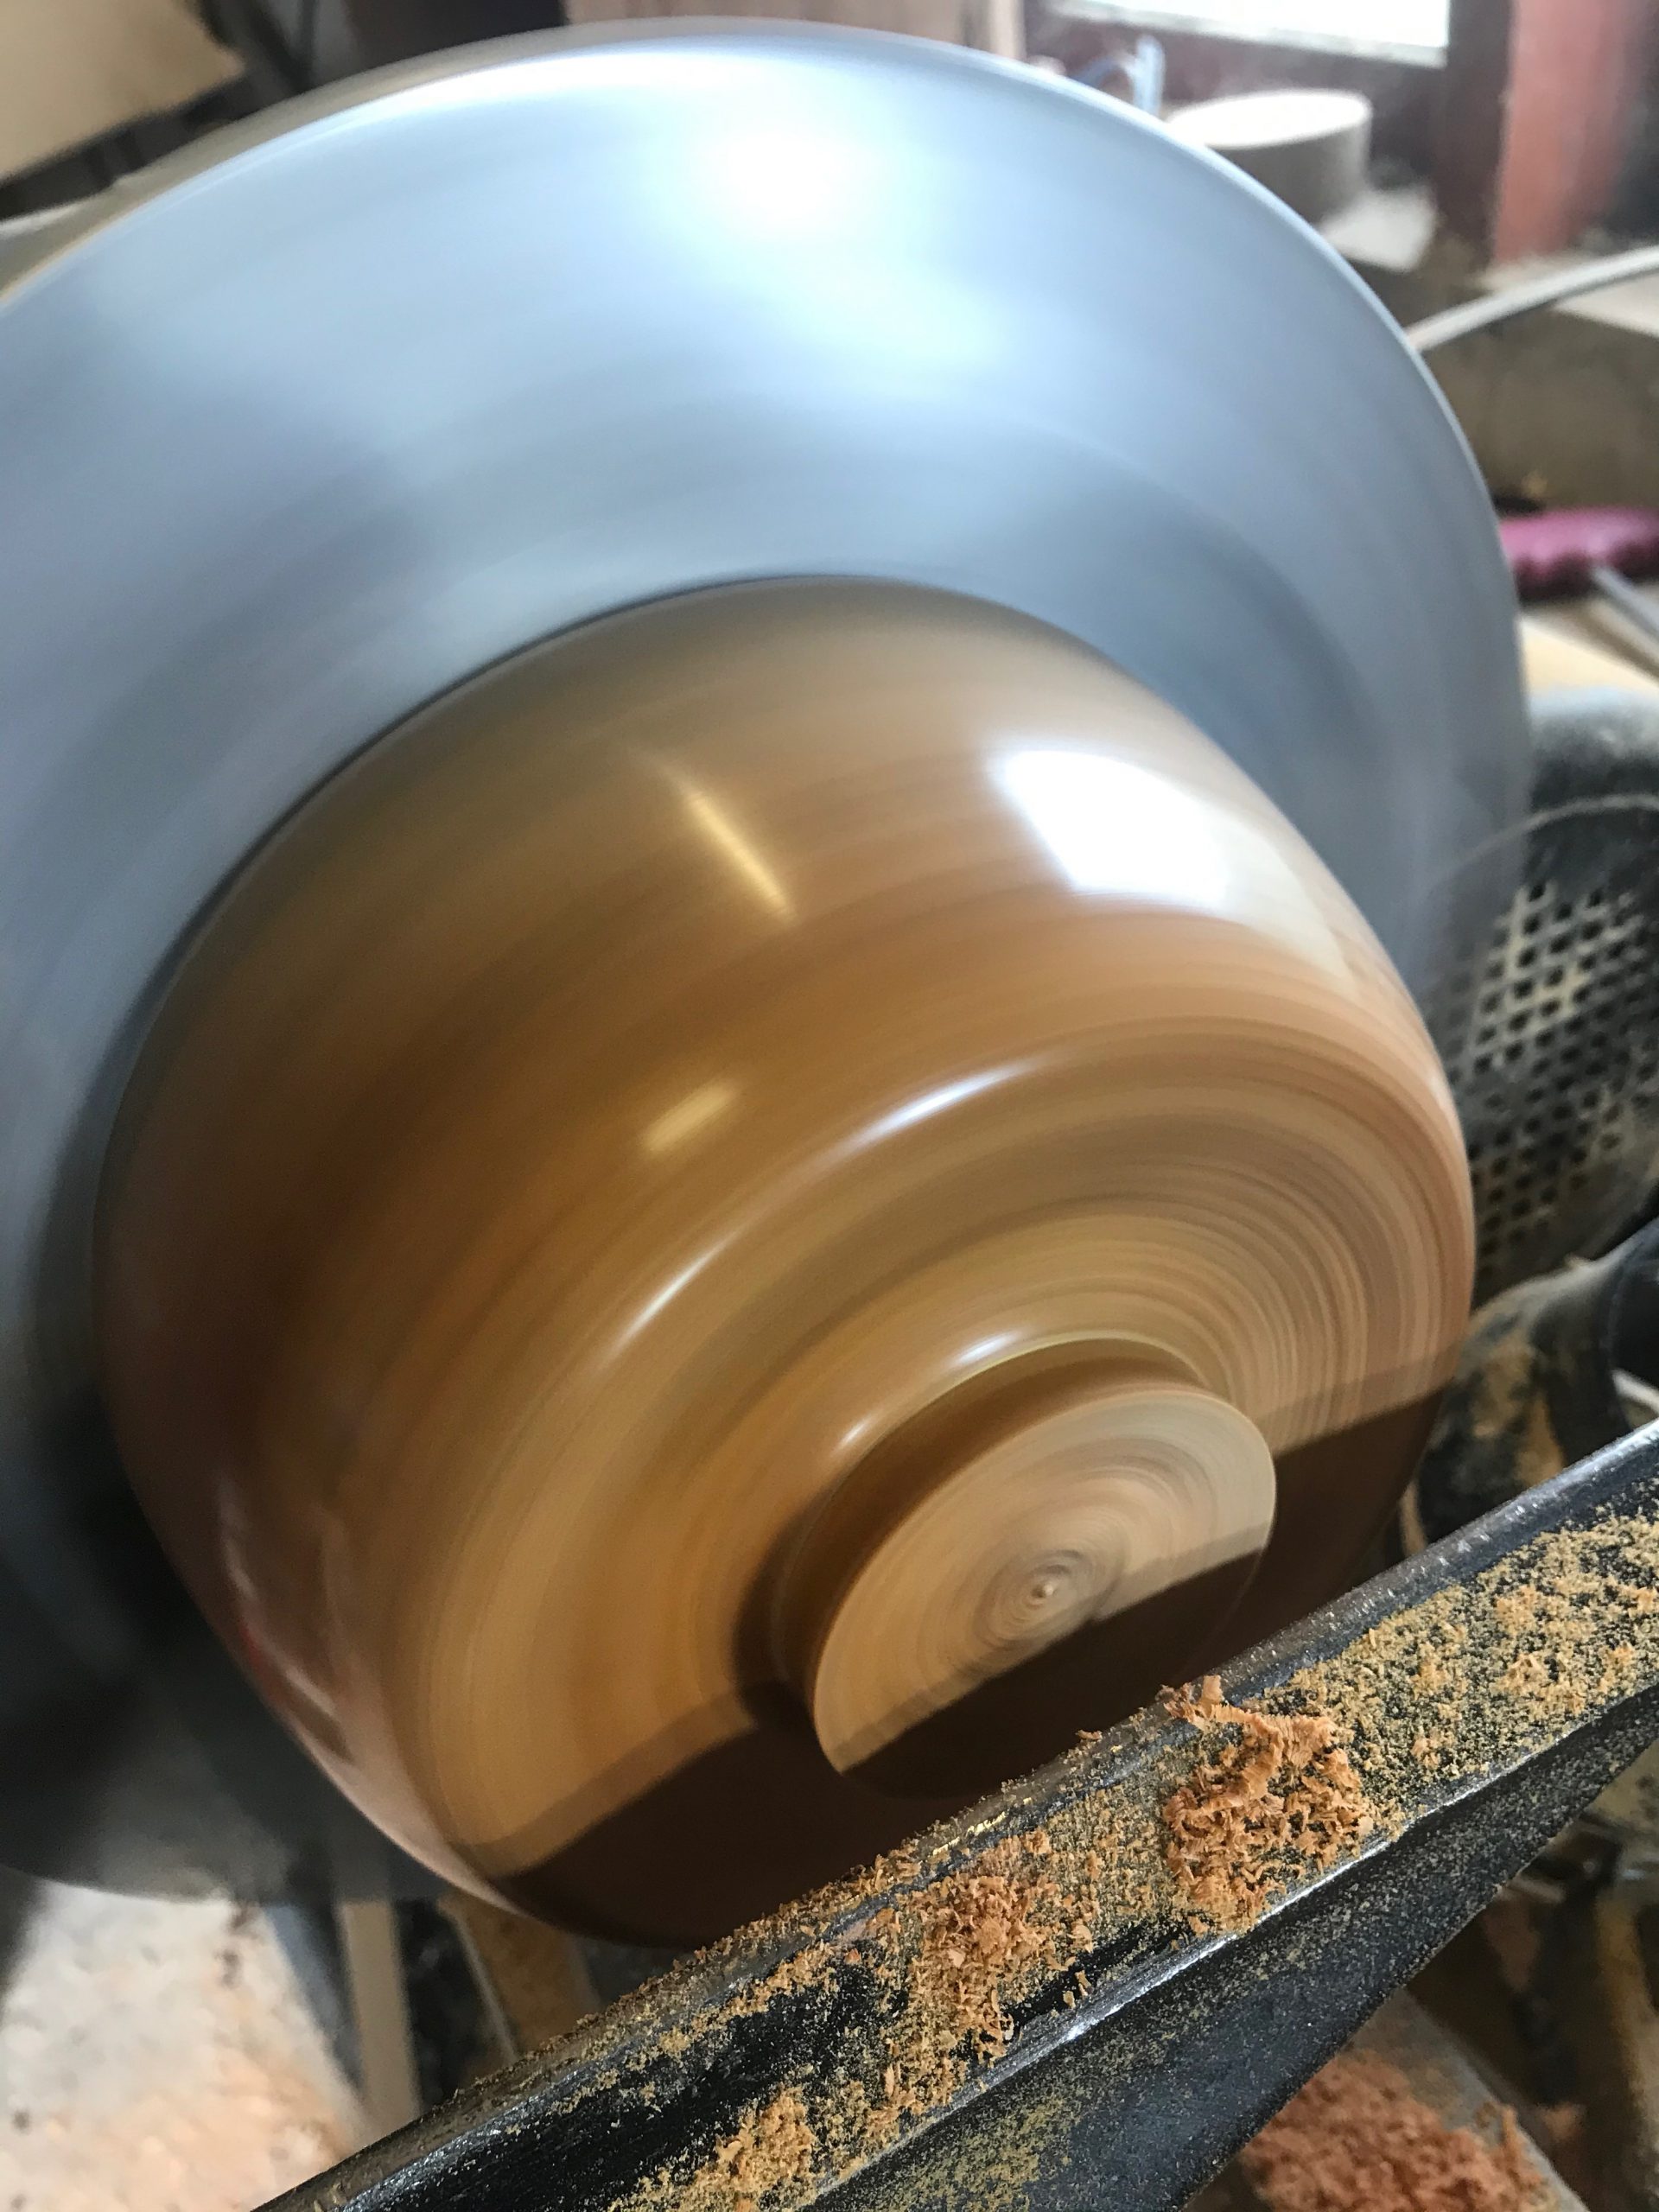
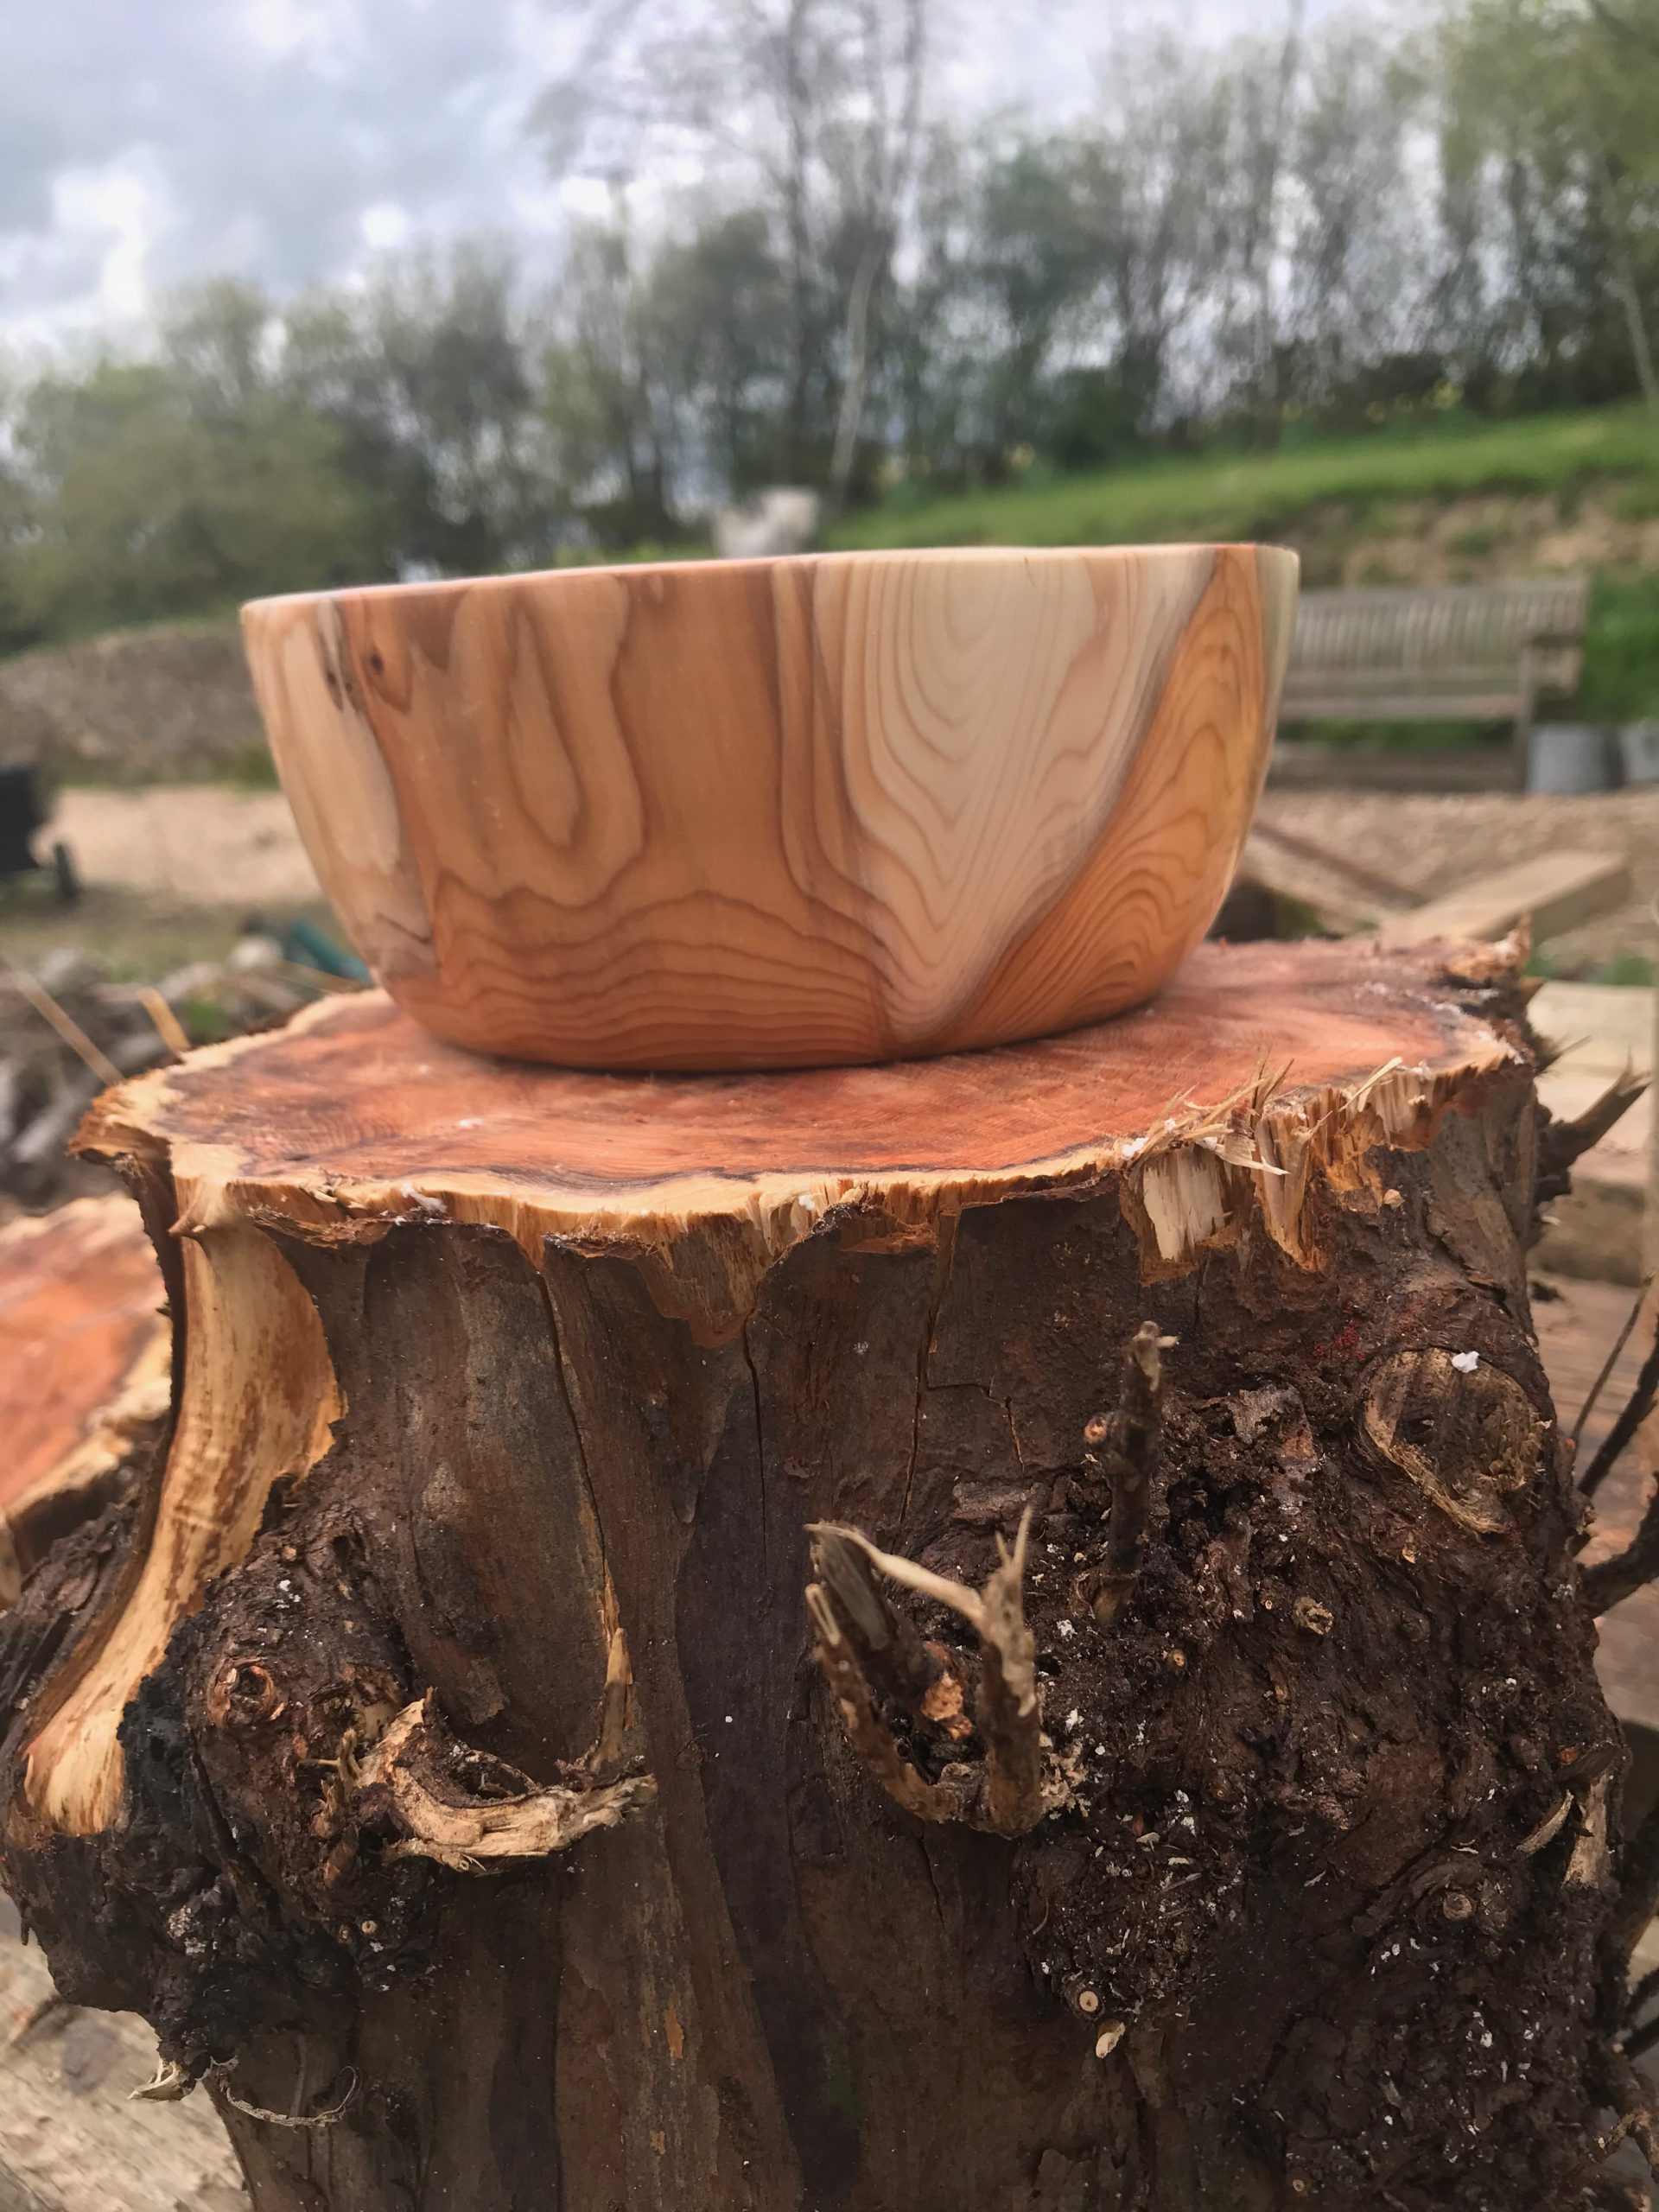
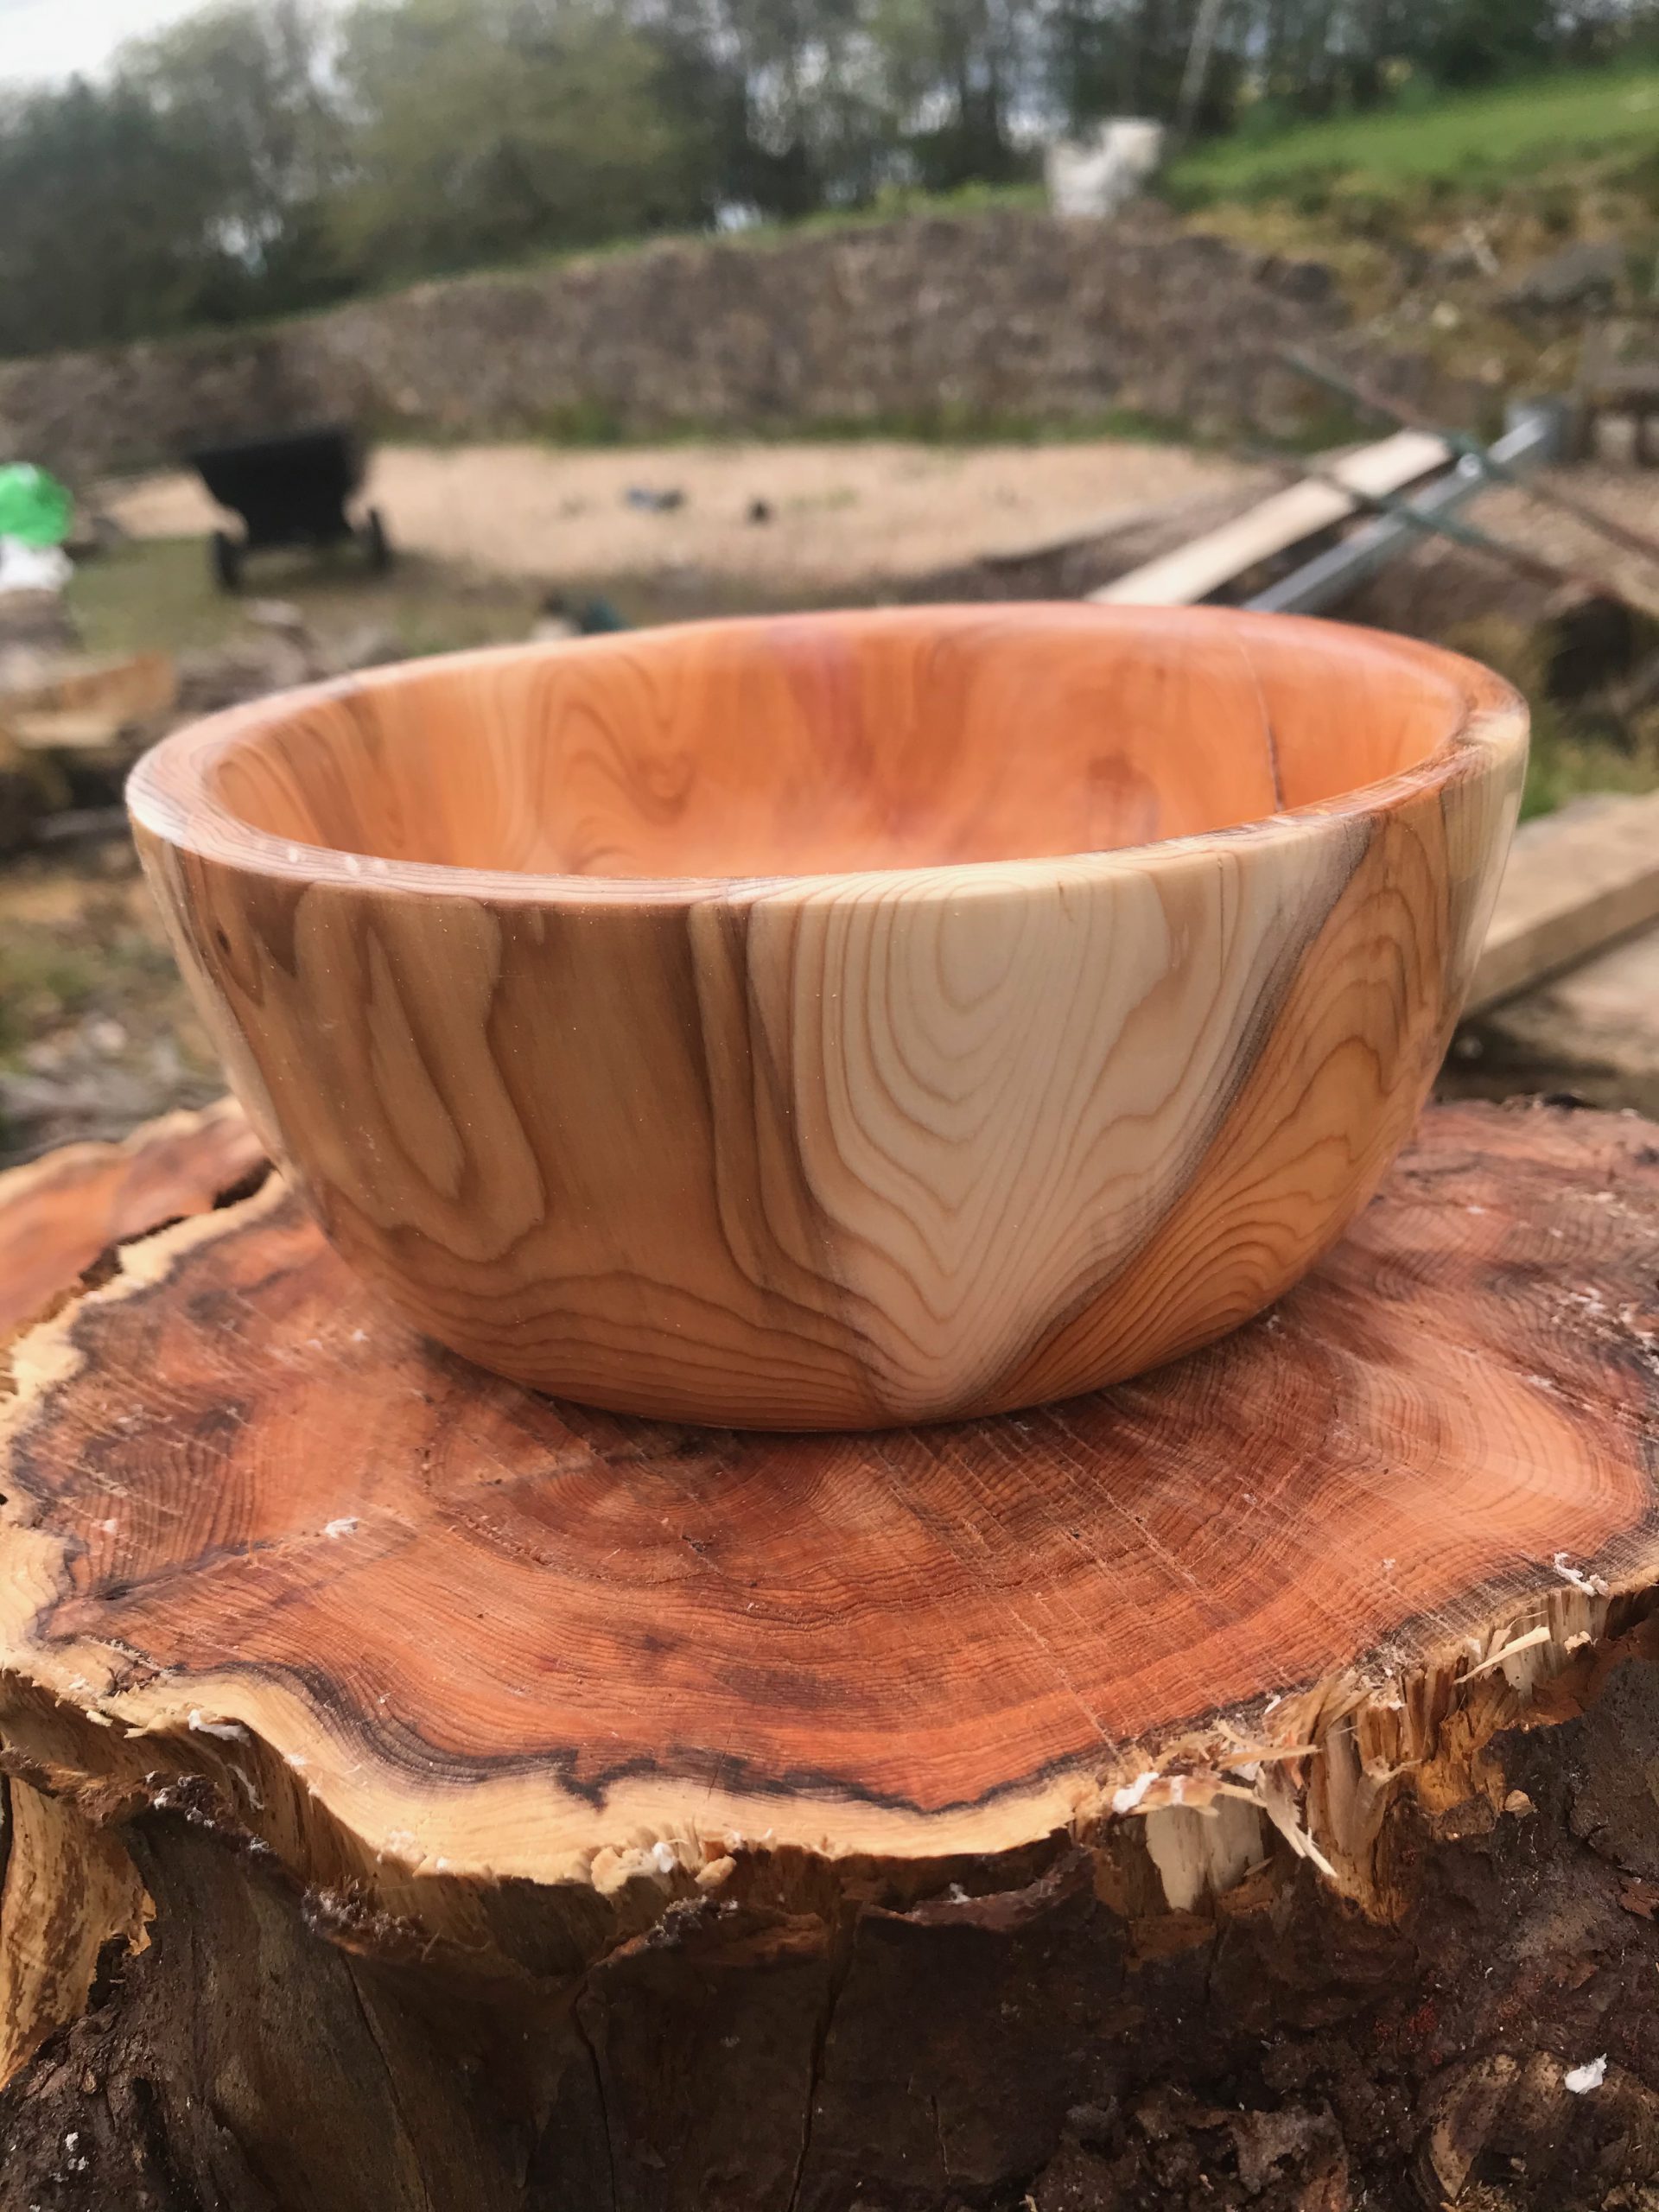
A family friend gave me a Land Rover boot-load of old Yew wood. It’s from a very old tree, is very dense and has loads of character.
The wood had been stored in her garden for several years prior to me getting it.
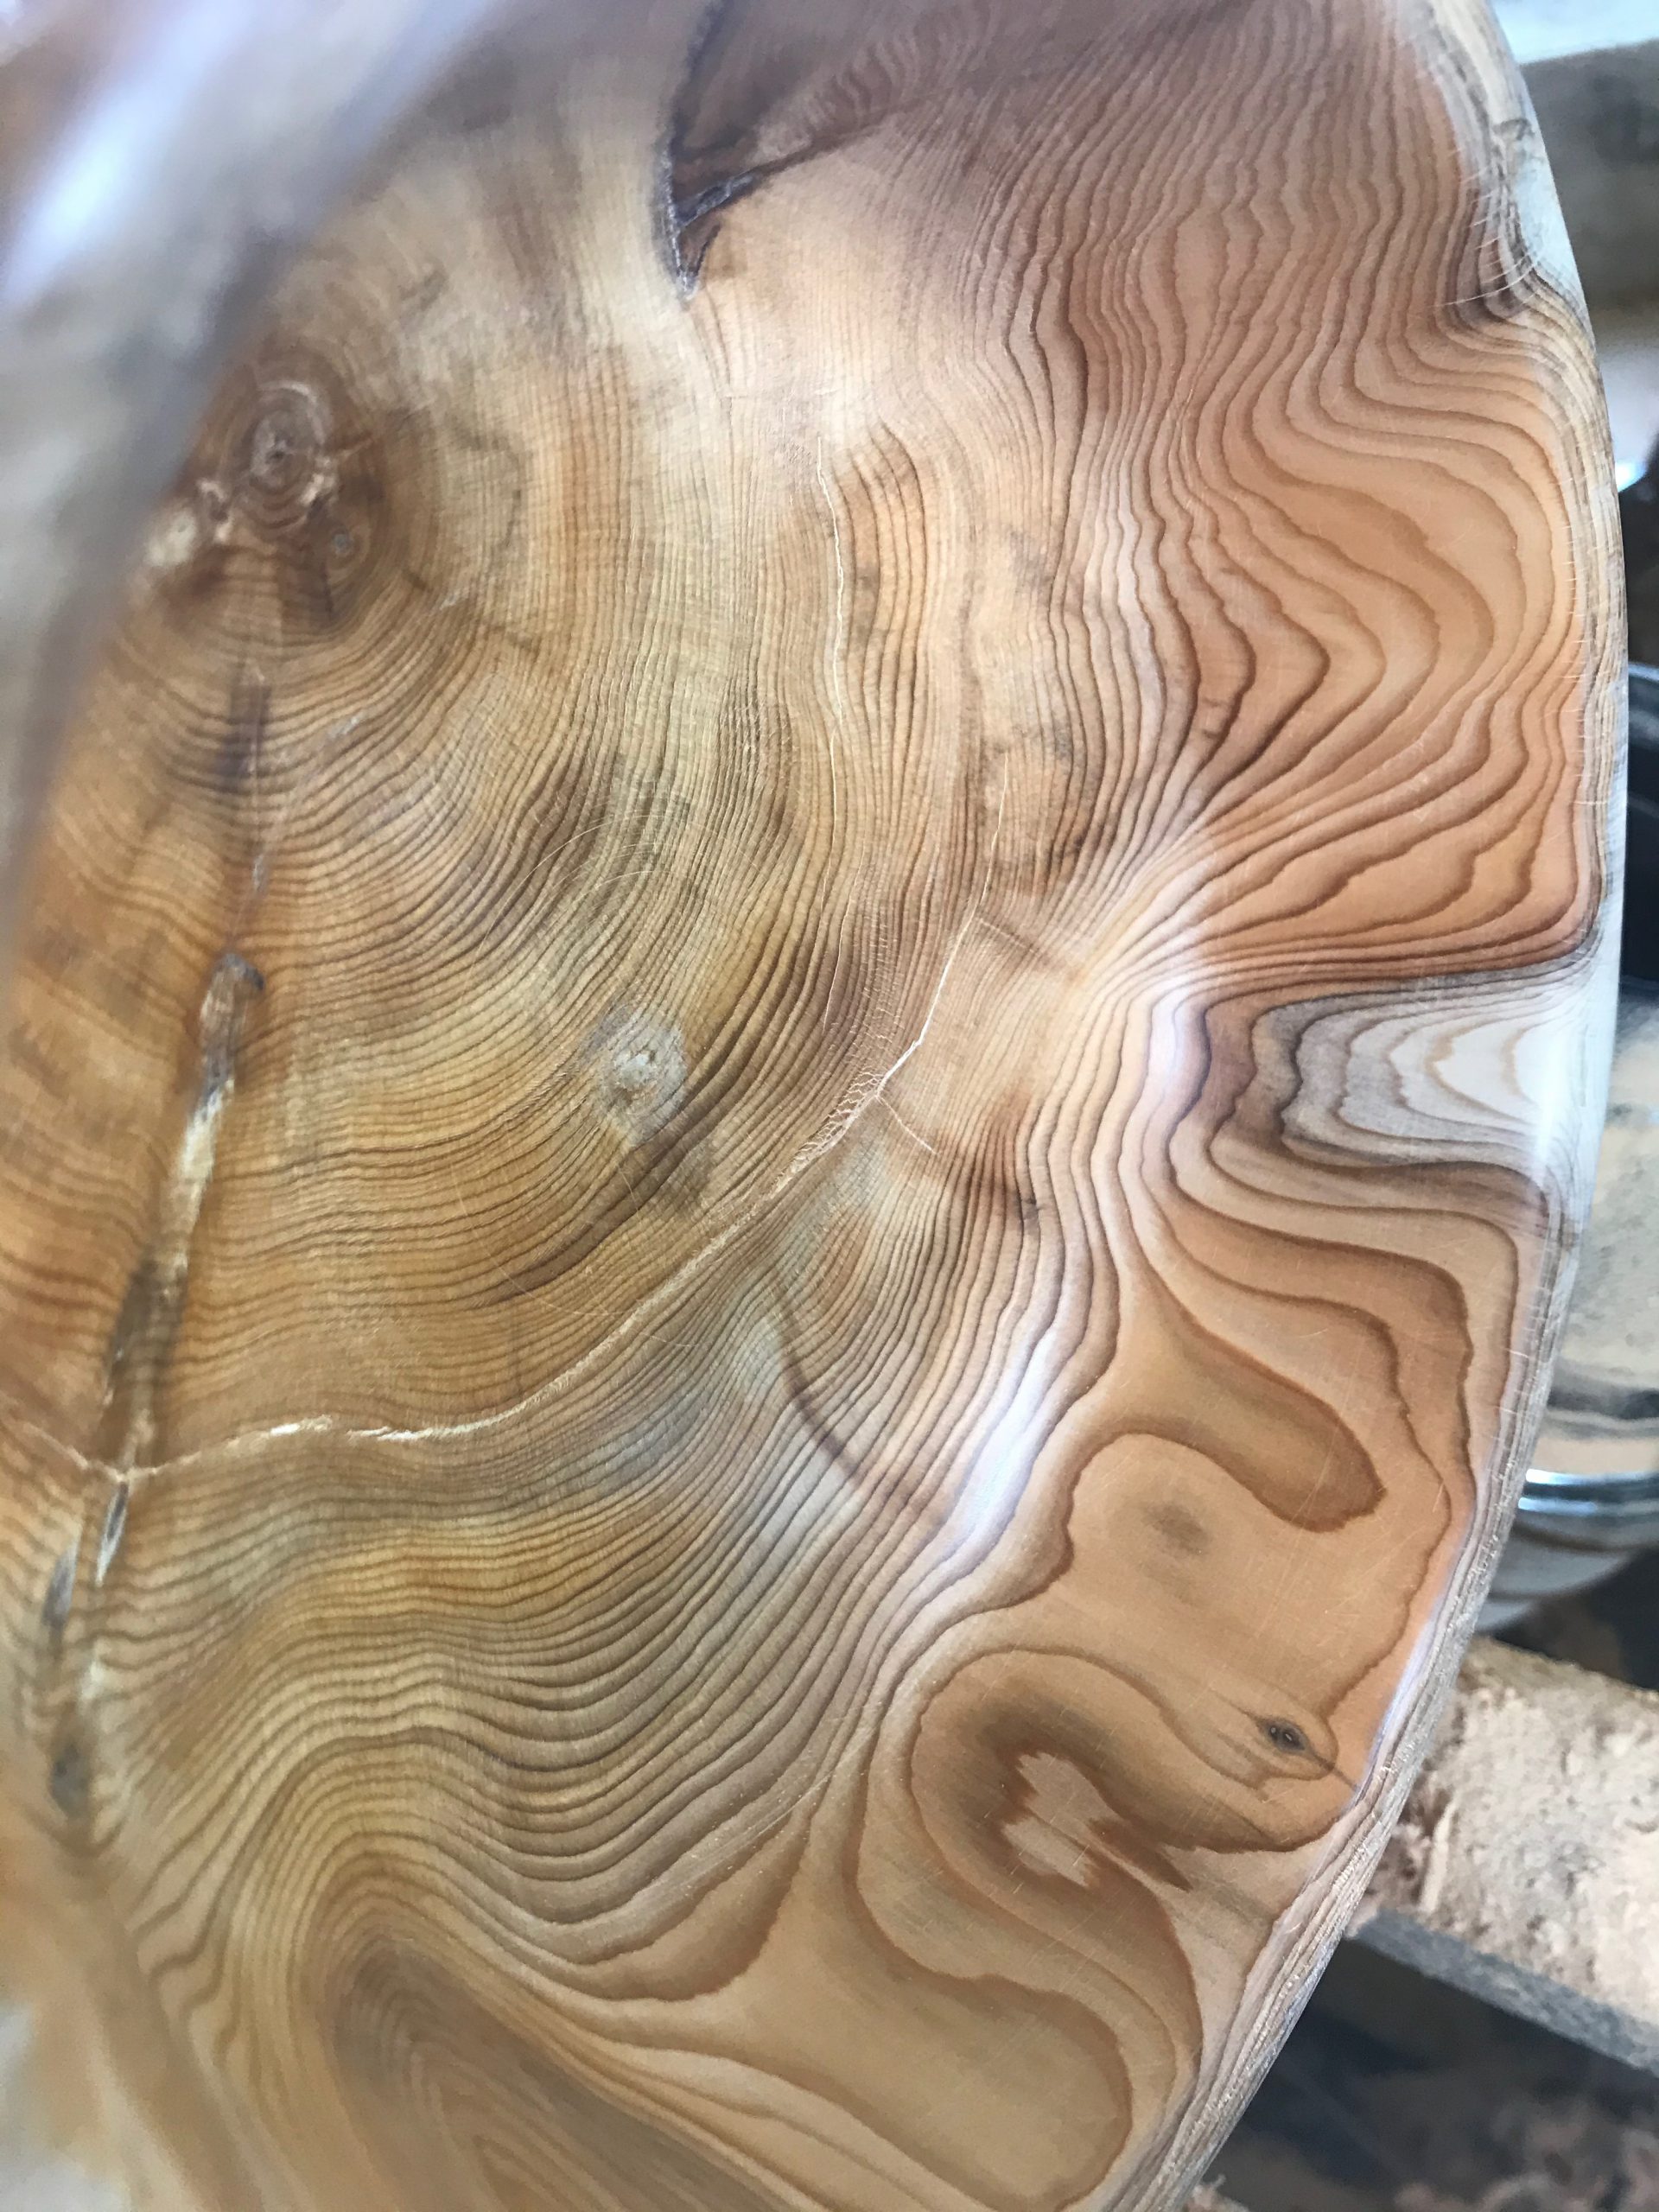
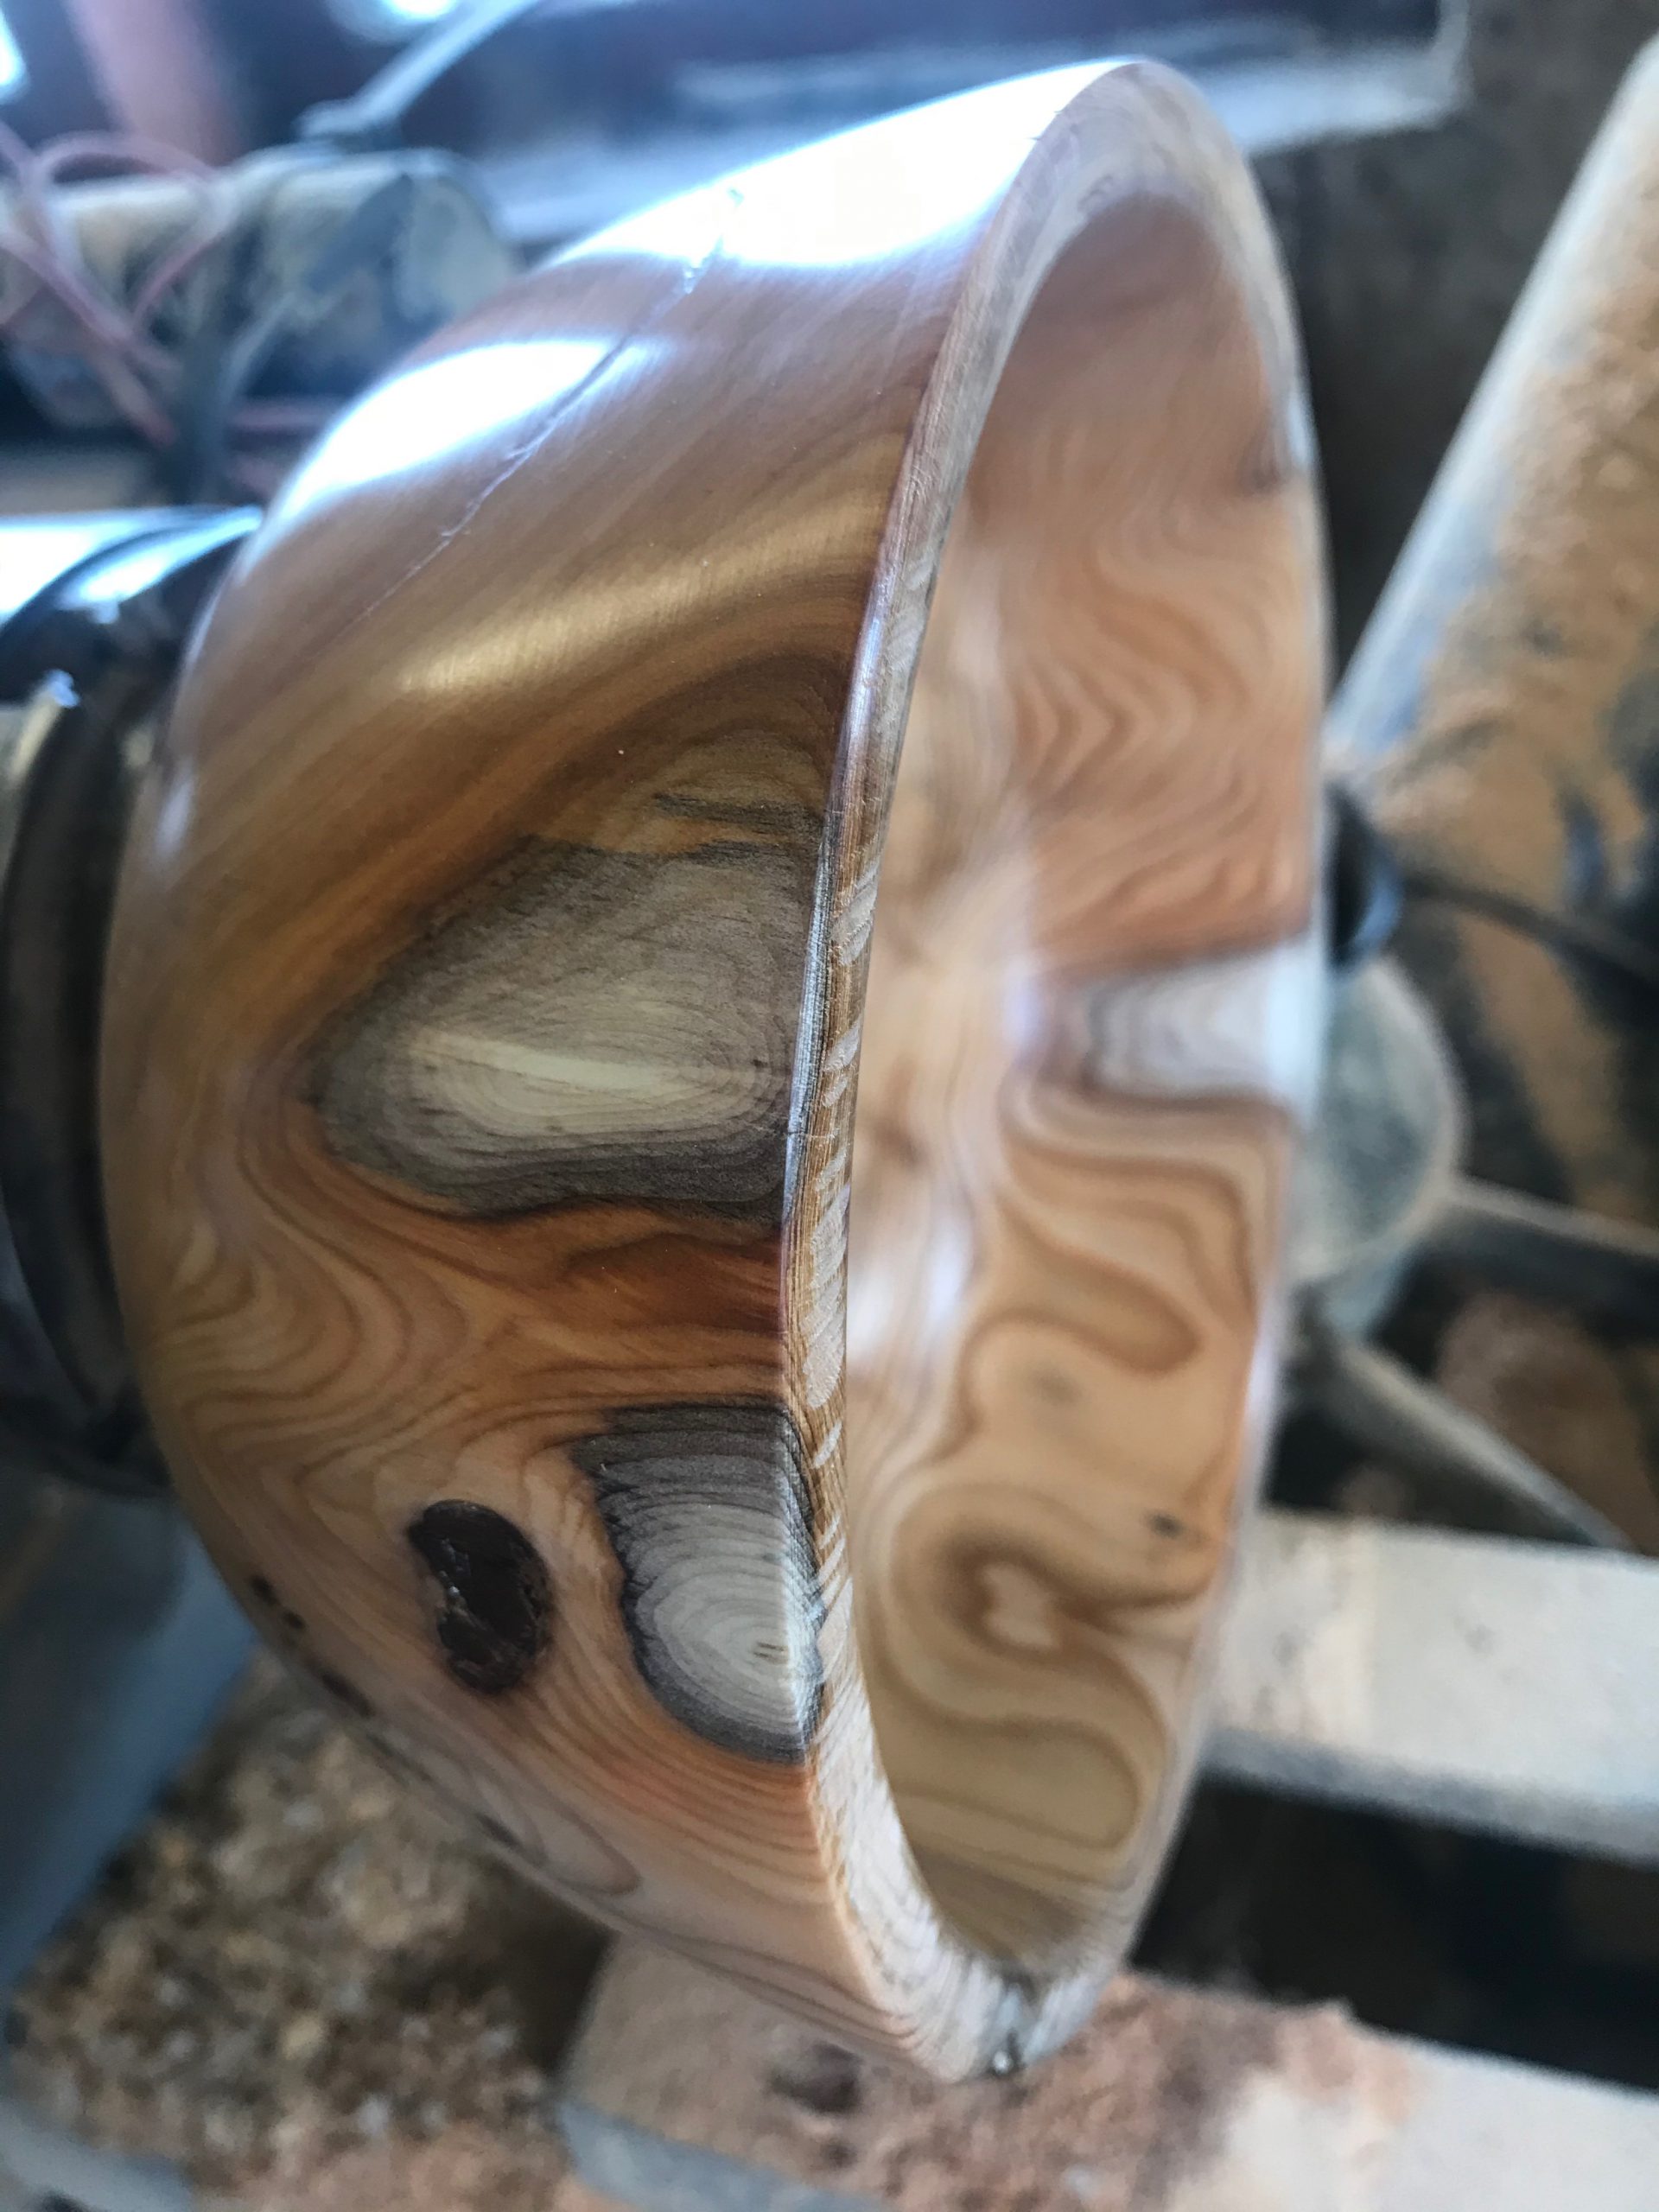
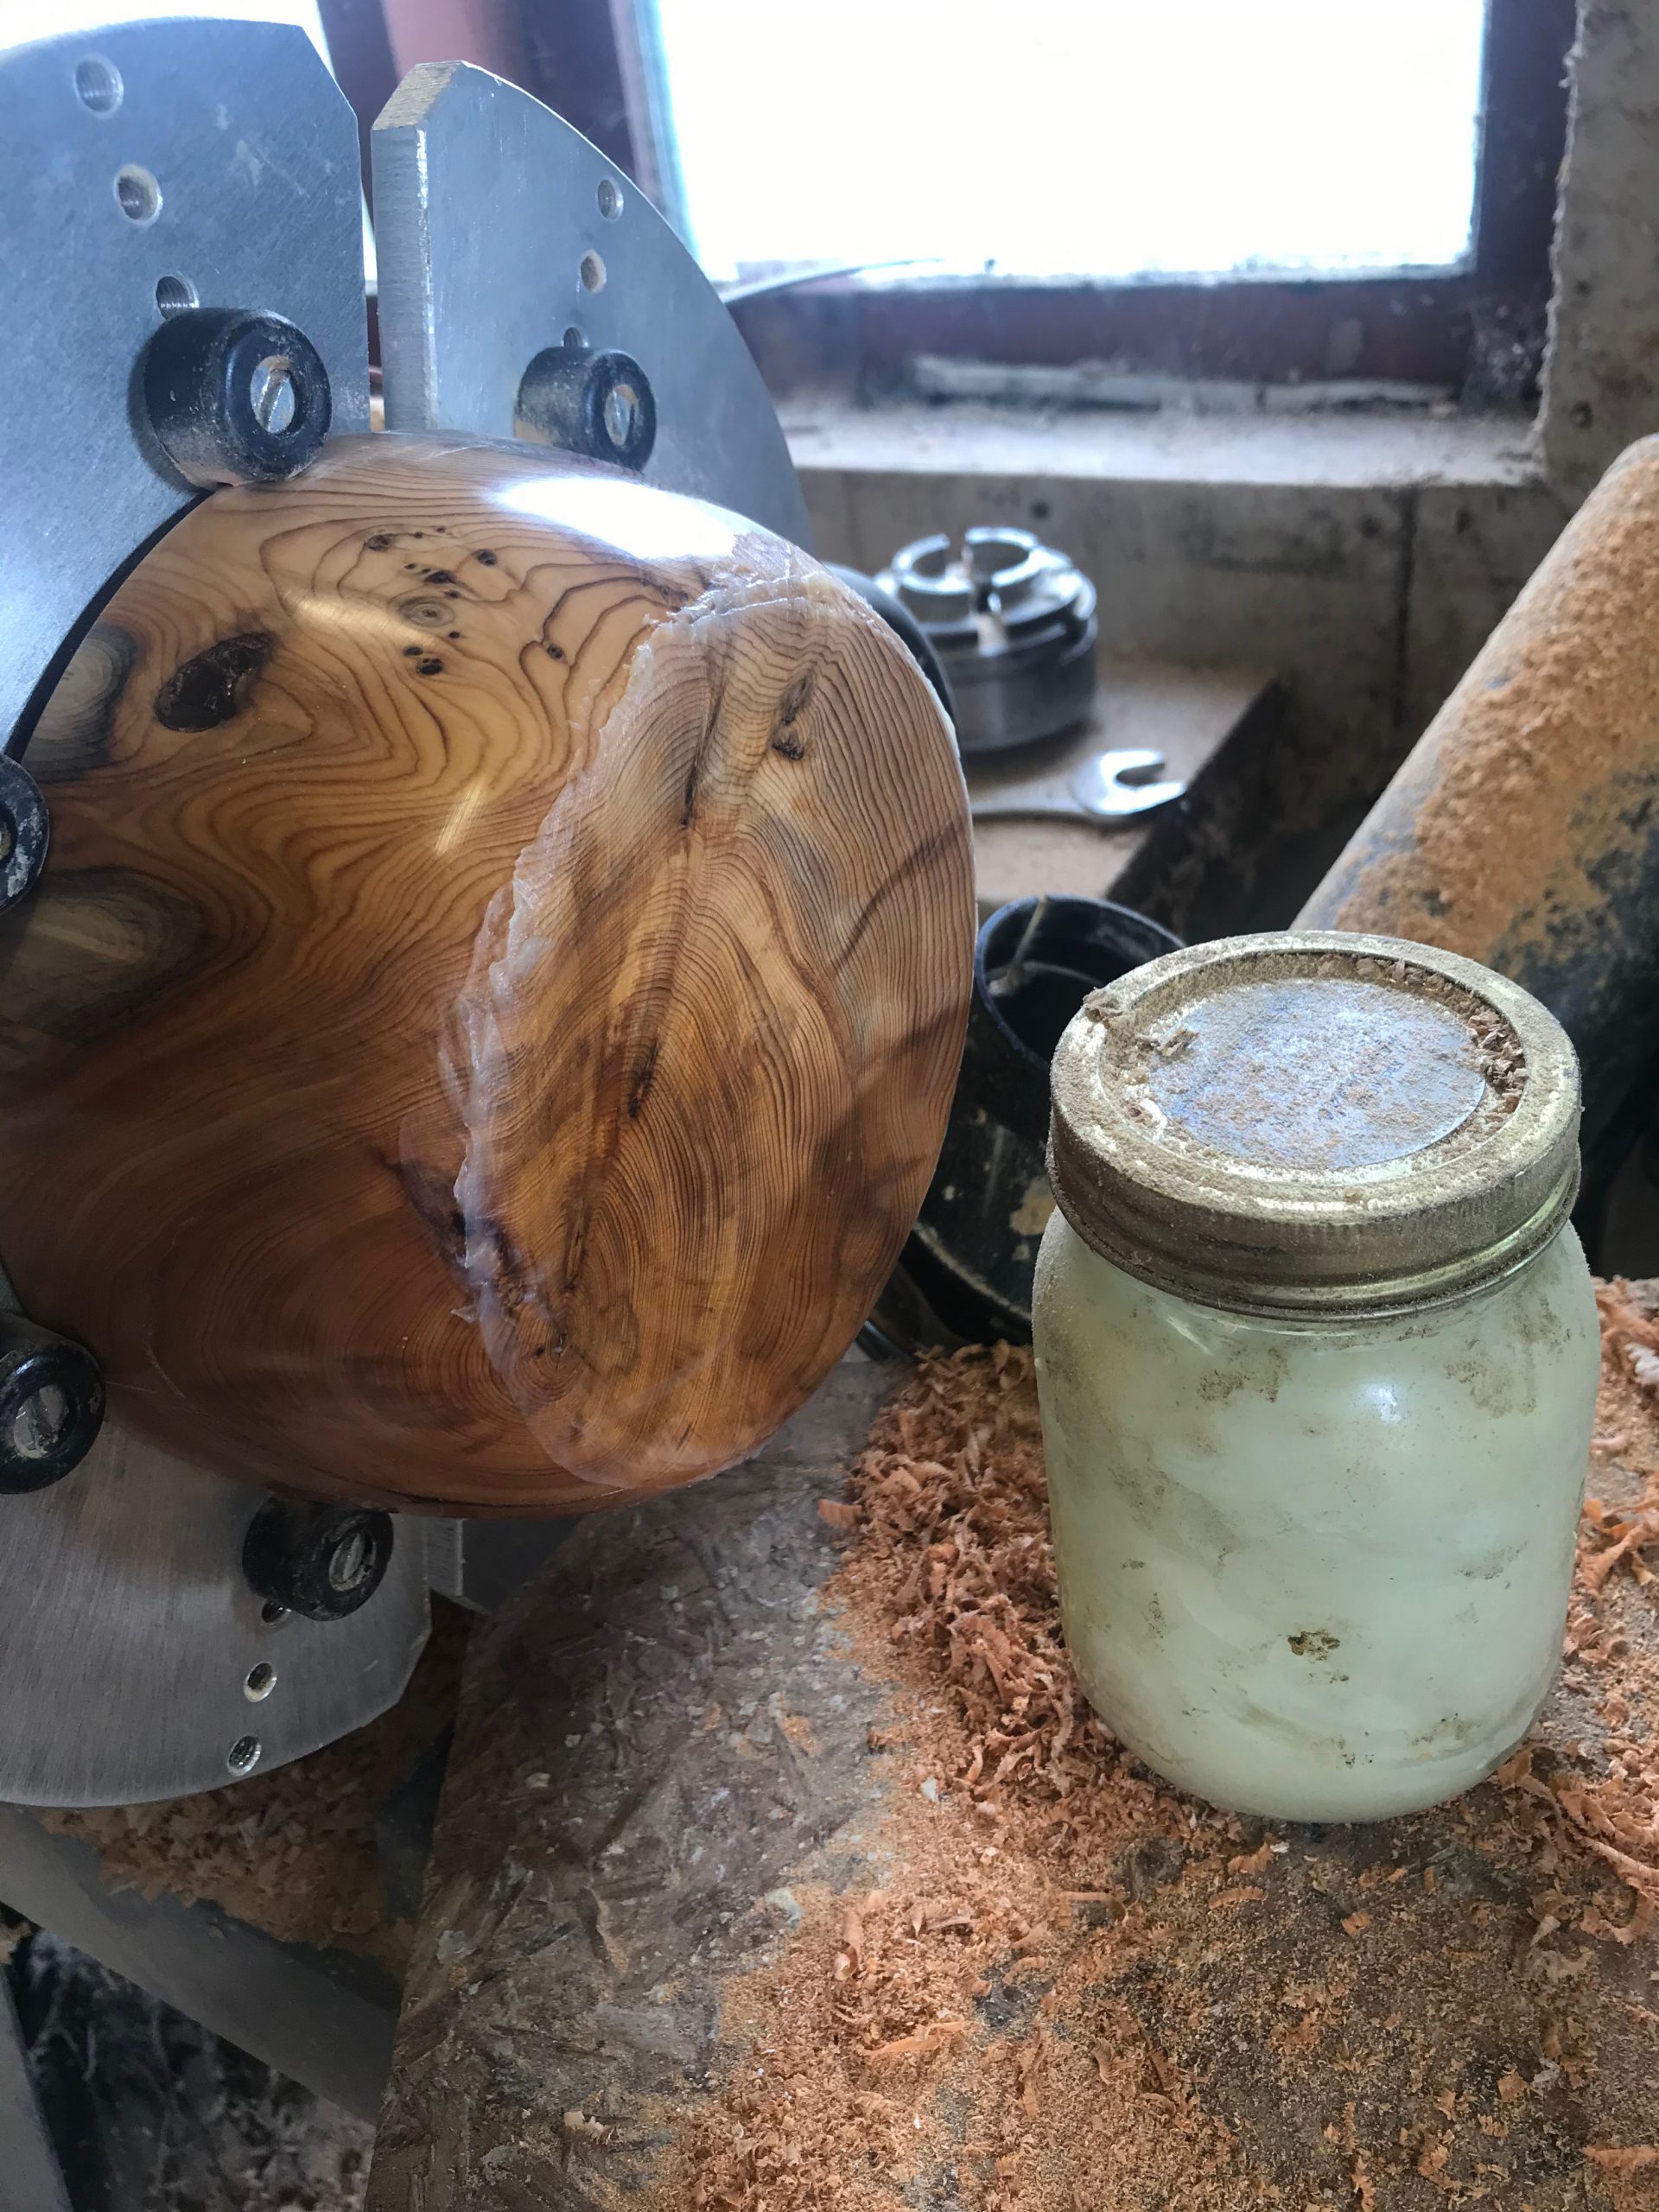
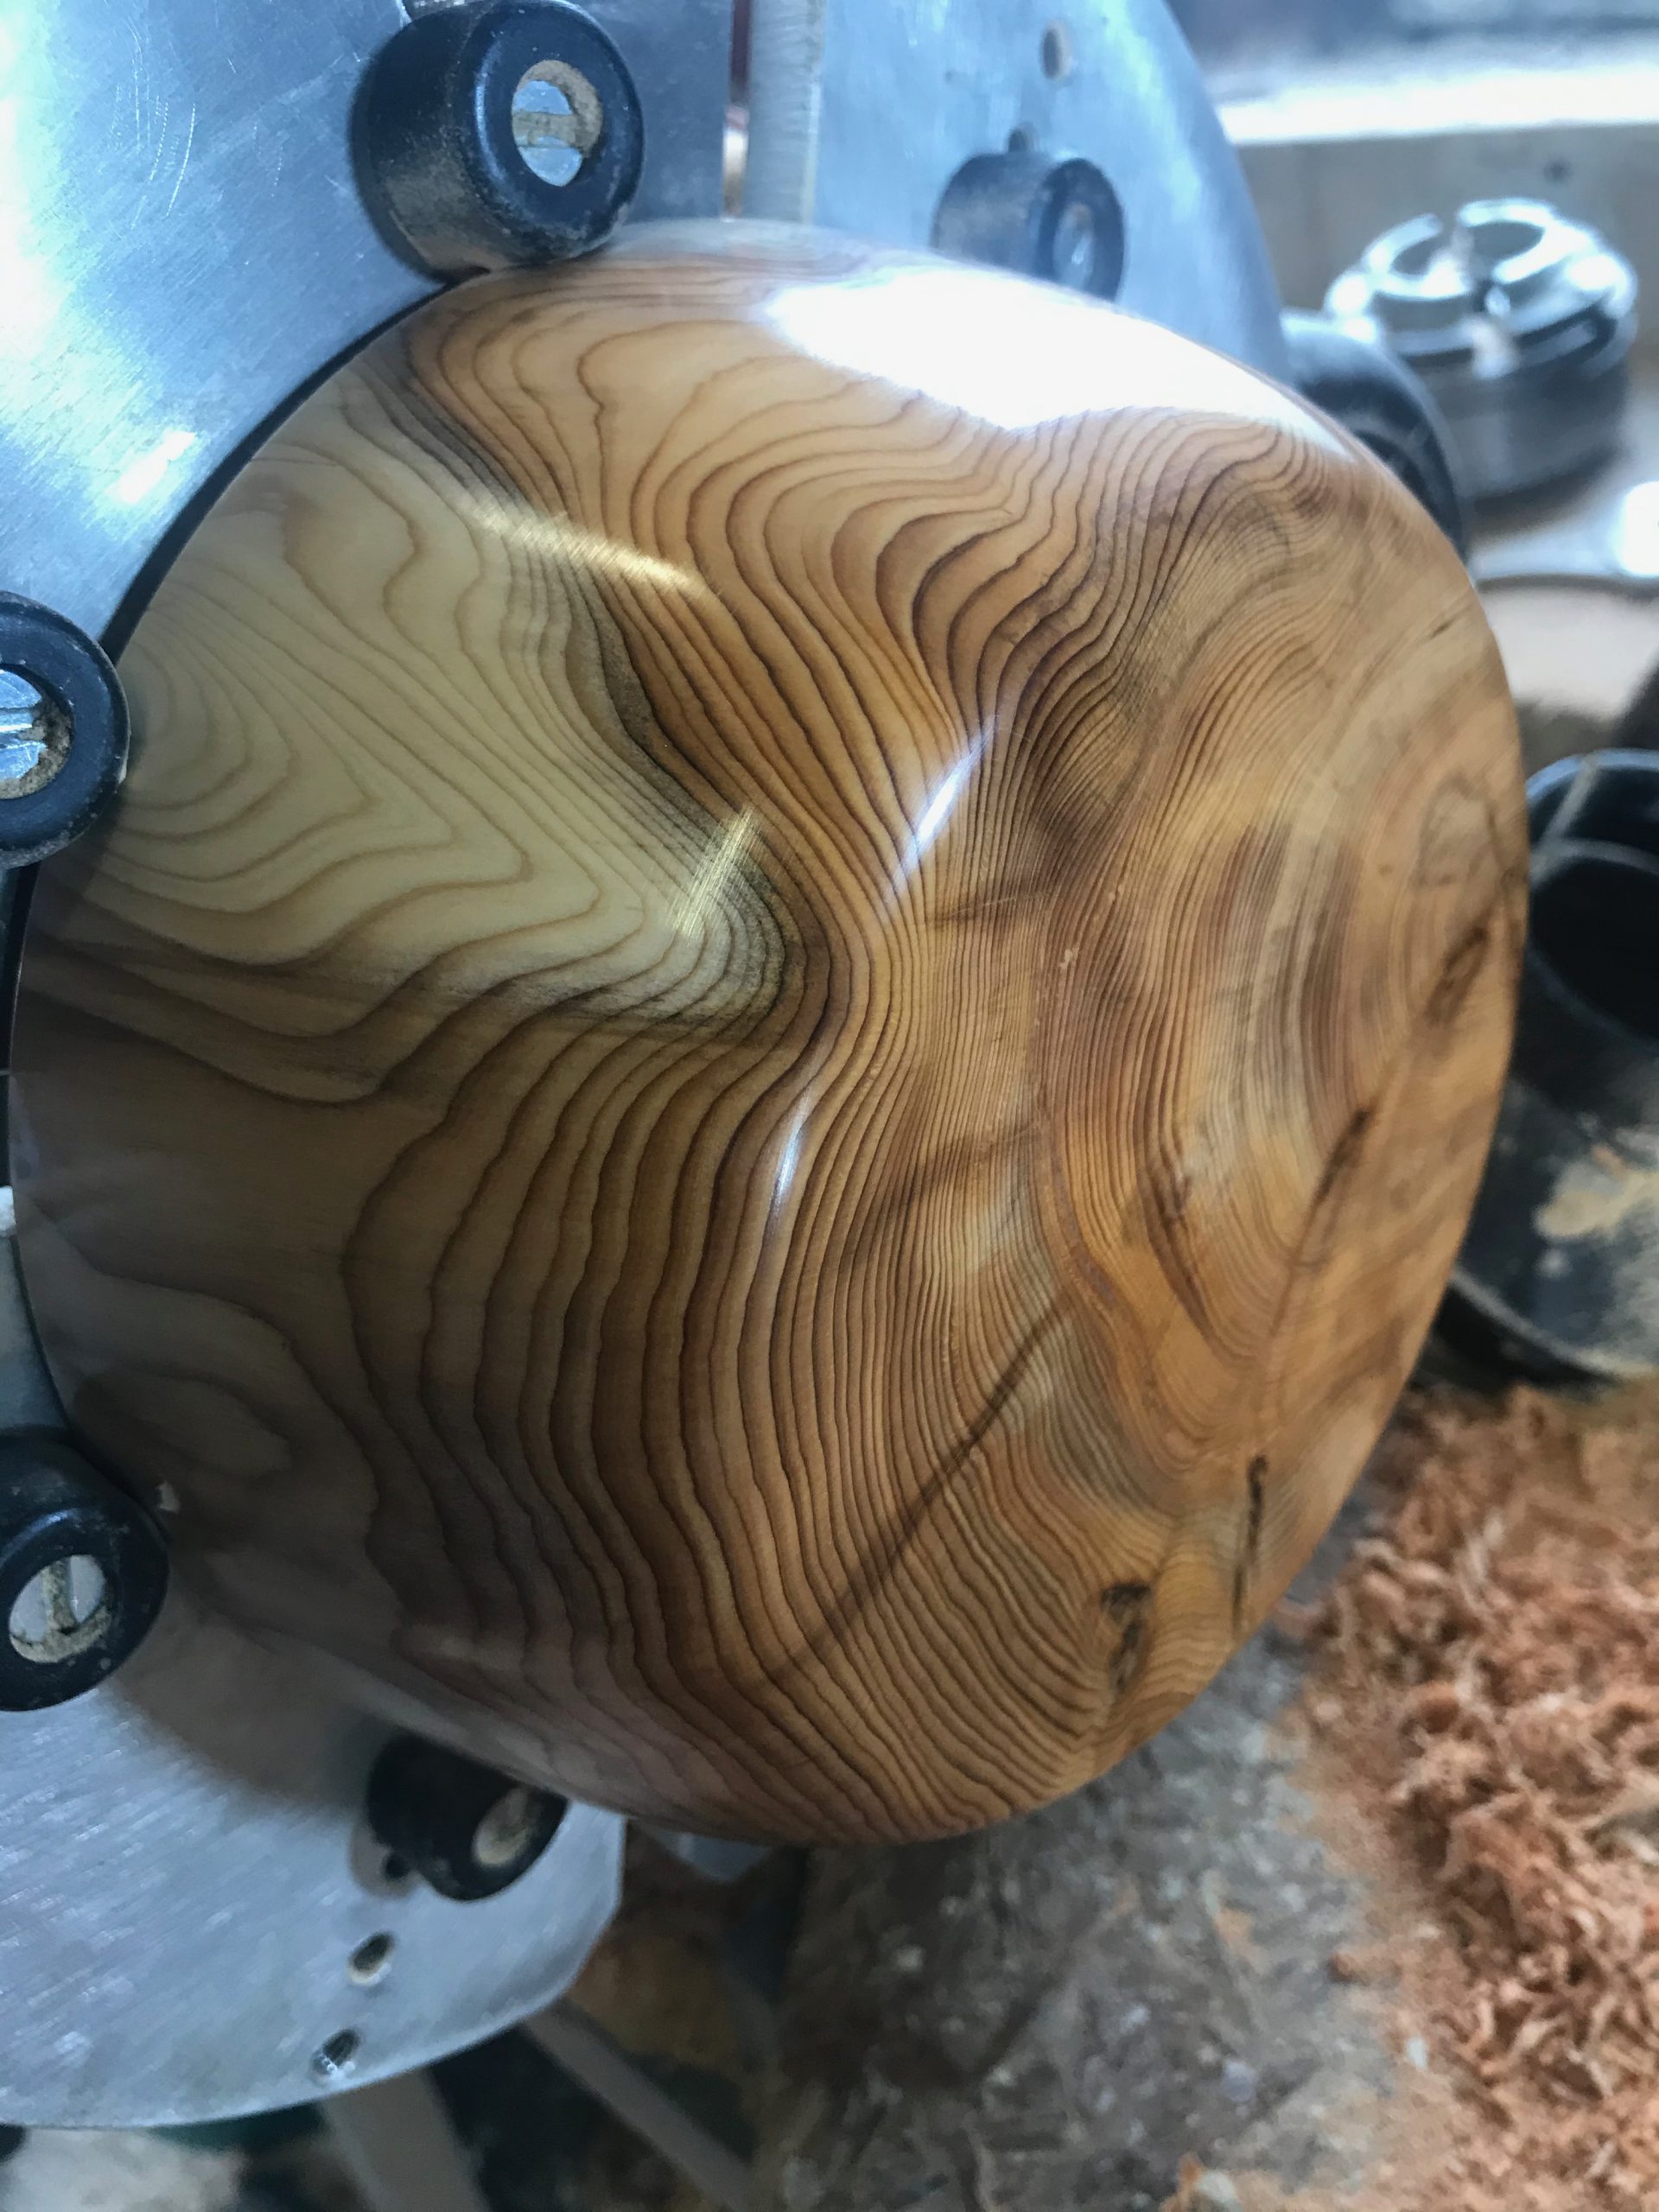
There were a lot of marks, holes and cracks to work around. It also felt very hard to cut and turn, possibly due to the complex grain patterns.
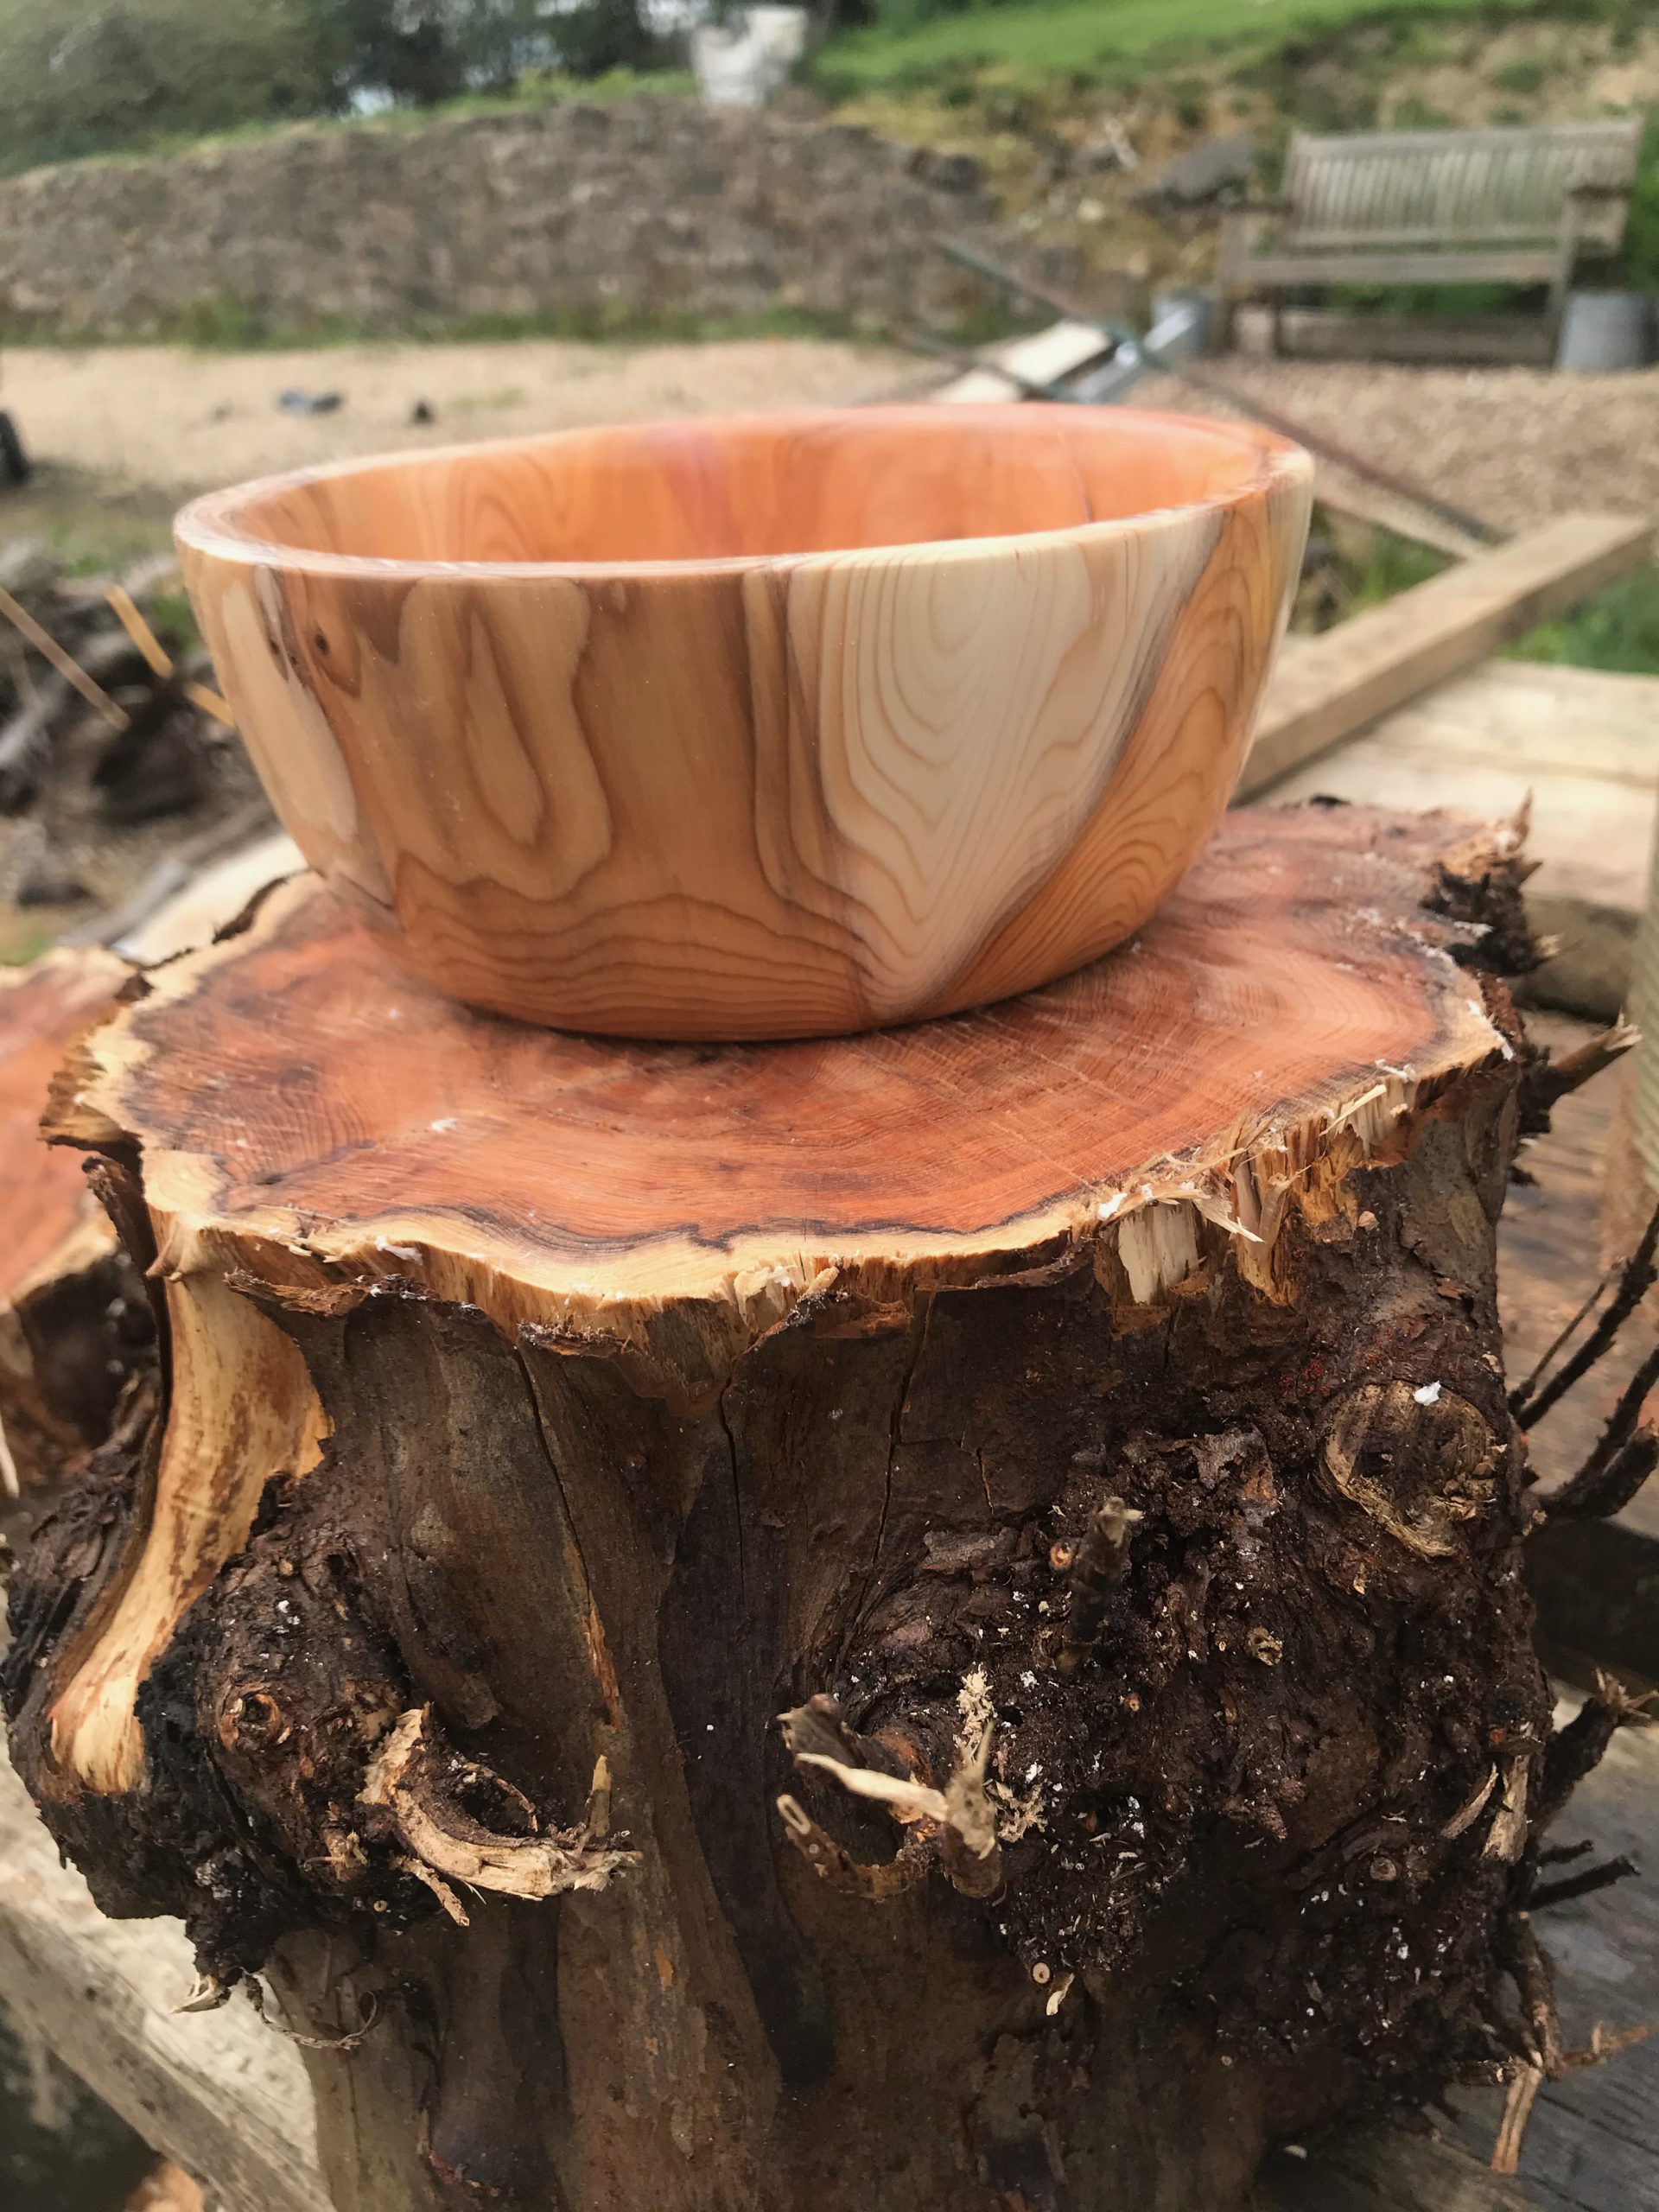
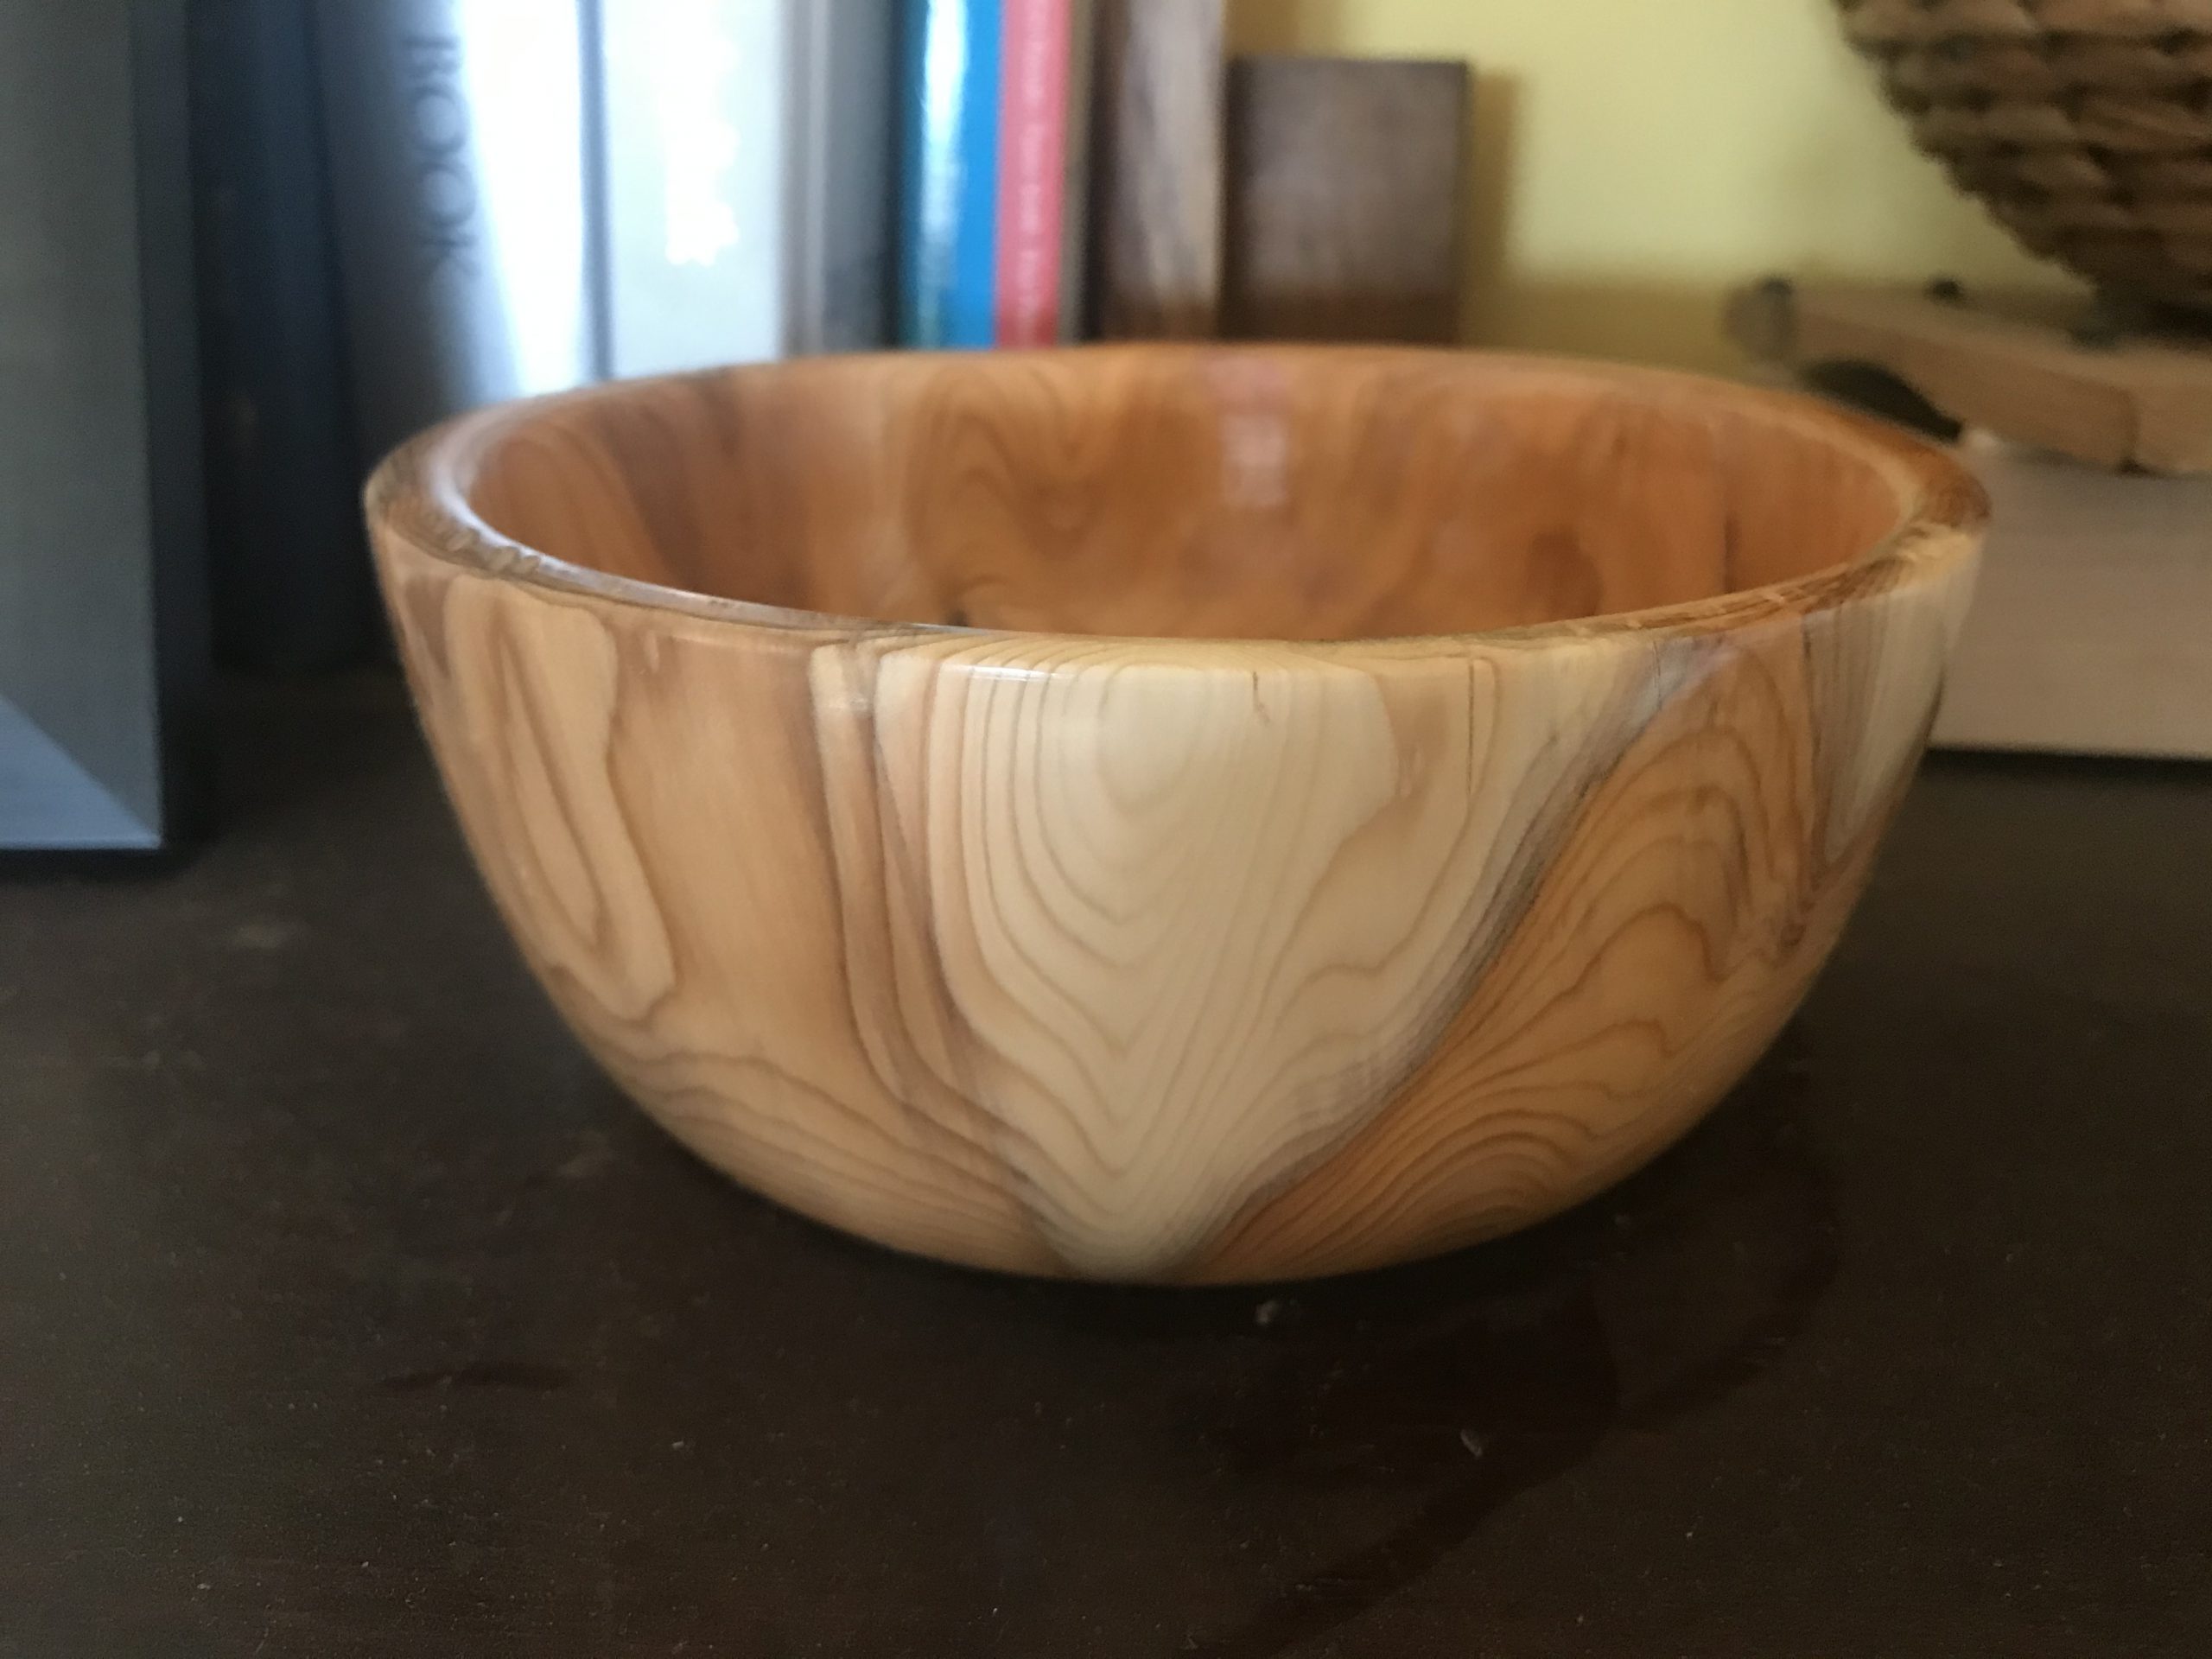
I was pleased with the end result and the different colours & patterns, and have enough wood left to make several more, hopefully.
NOTE: I wore a decent mask and kept the dust extractor on while turning this, and removed as much of the bark as I could first – apparently Yew dust is highly toxic.
The end result – this Yew bowl has been given to the wood donor
This is a follow on to the previous writeup on Kubernetes with Minikube and shows how to quickly and easily get a Kubernetes cluster up and running using VirtualBox and Minikube.
The setup is very similar for all platforms, but this post is specifically focused on Mac, as I’m planning on using this as the basis for a more complex post on Jenkins & Kubernetes Pipelines (and that post is now posted, here!).
Installing required components
There are three main components required:
VirtualBox is a free and open source hypervisor. It is a light weight app that allows you to run Virtual Machines on most platforms (Mac, Windows, Linux). We will use it here to run the Minikube Virtual Machine.
Kubectl is a command line tool for controlling Kubernetes clusters, we install this on the host (Mac) and use it to control and interact with the Kubernetes cluster we will be running inside the Minikube VM.
Minikube is a tool that runs a single-node Kubernetes cluster in a virtual machine on your personal computer. We’re using this to provision our k8s cluster and will also take advantage of some of the developer friendly addons it offers.
Downloads and Instructions
Here are links to the required files and detailed instructions on setting each of these components up – I went for the ‘brew install‘ options but there are many alternatives in these links. The whole process is very simple and took about 10 minutes.
most popular hypervisors are well supported by Minikube.
Here’s what that looks like on my Mac – this may take a few minutes as it’s downloading a VM (if not already available locally), starting it up and configuring a Kubernetes Cluster inside it:
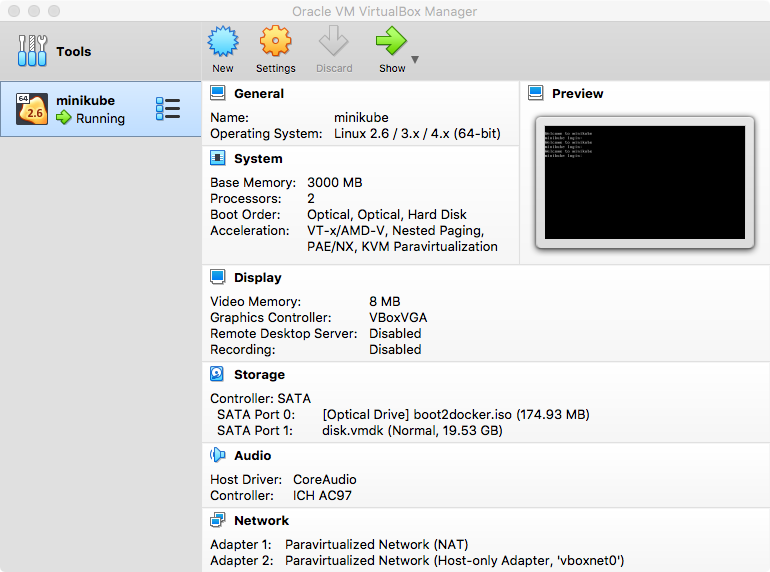
there’s quite a lot going on and not very much to see; you don’t even need to look at VirtualBox as it’s running ‘headless’, but if you open it up you can see the new running VM and its settings:
these values are all set to sensible defaults, but you may want to tweak things like memory or cpu allocations – running
minikube config -h
should help you see what to do, for example
minikube start --memory 1024
to change the allocated memory.
If you then take a look at the config file in ~/.minikube/config/config.js you will see how your preferences – resource limits, addons etc – are persisted and managed there.
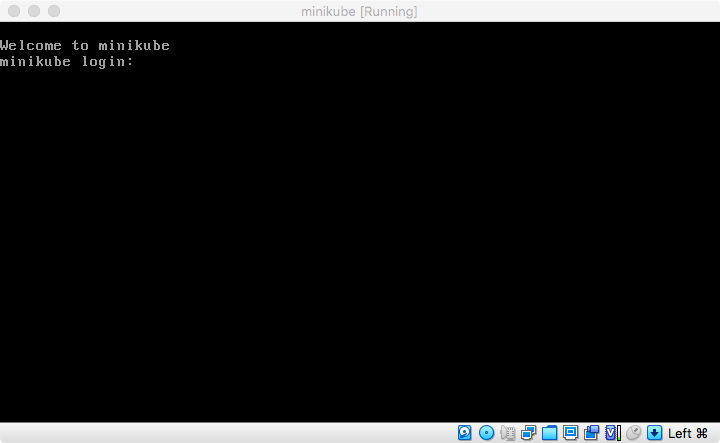
Looking back at VirtualBox, if you click on “Show” or the running VM you can open that up to see the console for the Minikube VM:
to stop the vm simply do a minikube stop, or just type minikube to see a list of args and options to manage the lifecycle, e.g. minikube delete, status, pause, ssh and so on.
Minikube Addons
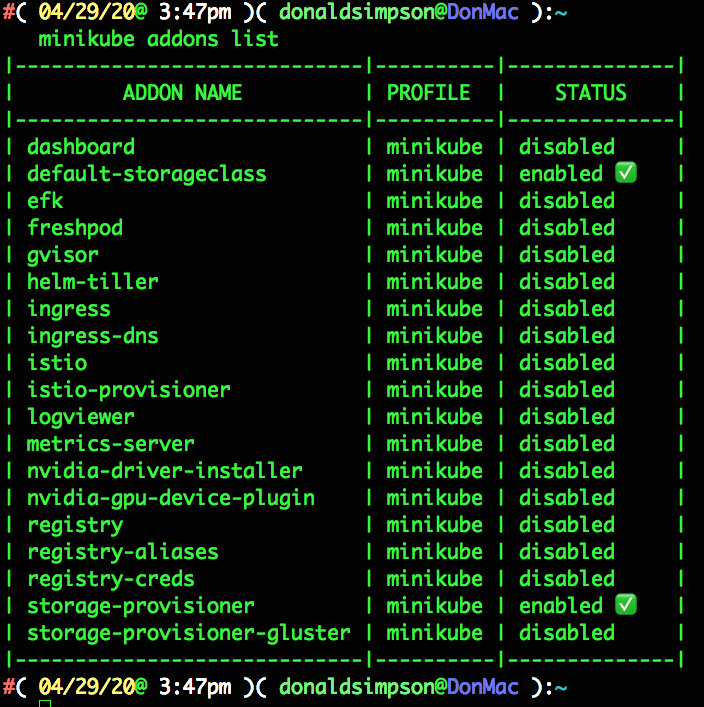
One of the handy features Minikube provides are its selection of easy to use addons. As explained in the official docs here you can see the list and current status of each addon by typing minikube addons list
the storage-provisioner and default-storeageclass addons were automatically enabled on startup, but I usually like to add the metrics server and dashboard too, like so:
I often use helm & tiller, efk, istio and the registry too – this feature save me a lot of time and messing about!
Accessing the Kubernetes Dashboard – all done!
Once that’s completed you can run minikube dashboard to open up the Kubernetes dashboard on your host.
Minikube makes this all very easy; we didn’t have to forward ports, configure firewalls, consider ingress and egress, create RBAC roles, manage accounts/passwords/keys or set up DNS, or any of the many things you would normally want or have to consider to get to this point.
These features make Minikube a great choice for development work, where you don’t want to care about things like this as you would in a “for real” environment.
Your browser should open up the Kubernetes Dashboard, and you can click around and see the status of the many components that comprise your new Kubernetes cluster:
And then…
Next up I’ll be building on this setup by deploying a Jenkins instance inside the Kubernetes Cluster, then configuring that to use Kubernetes to build, manage and deploy applications on the same Kubernetes Cluster.
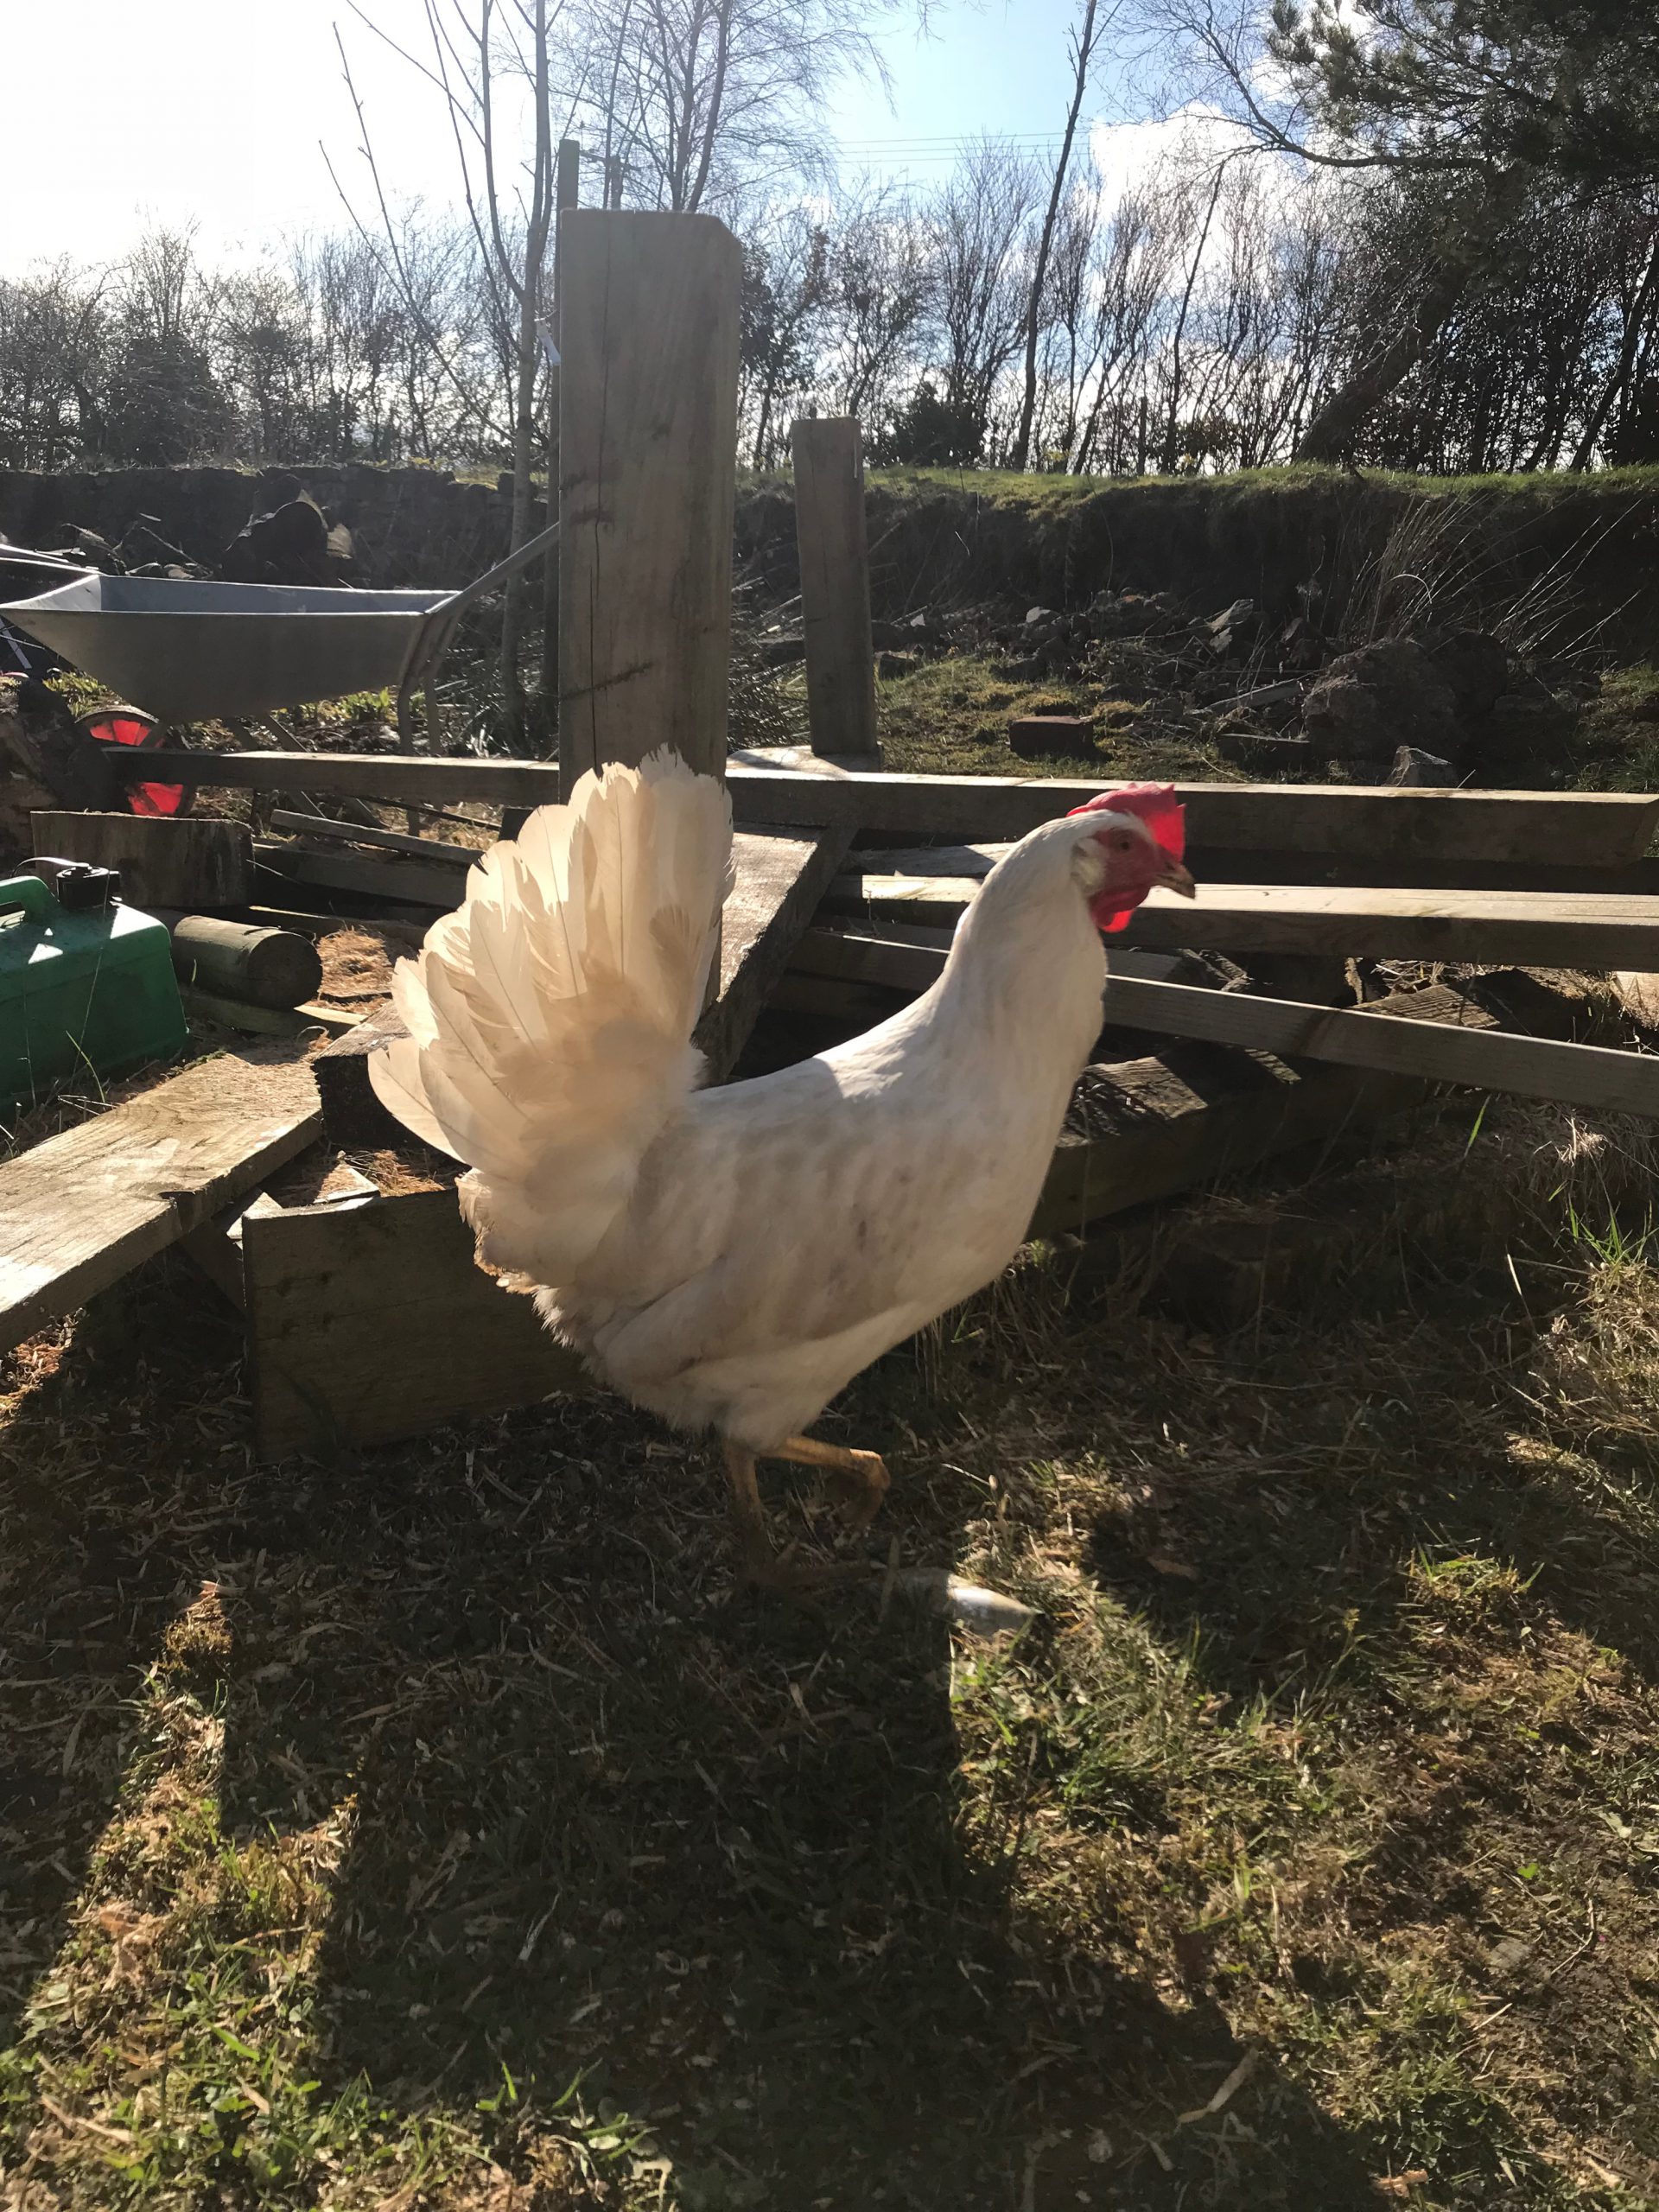
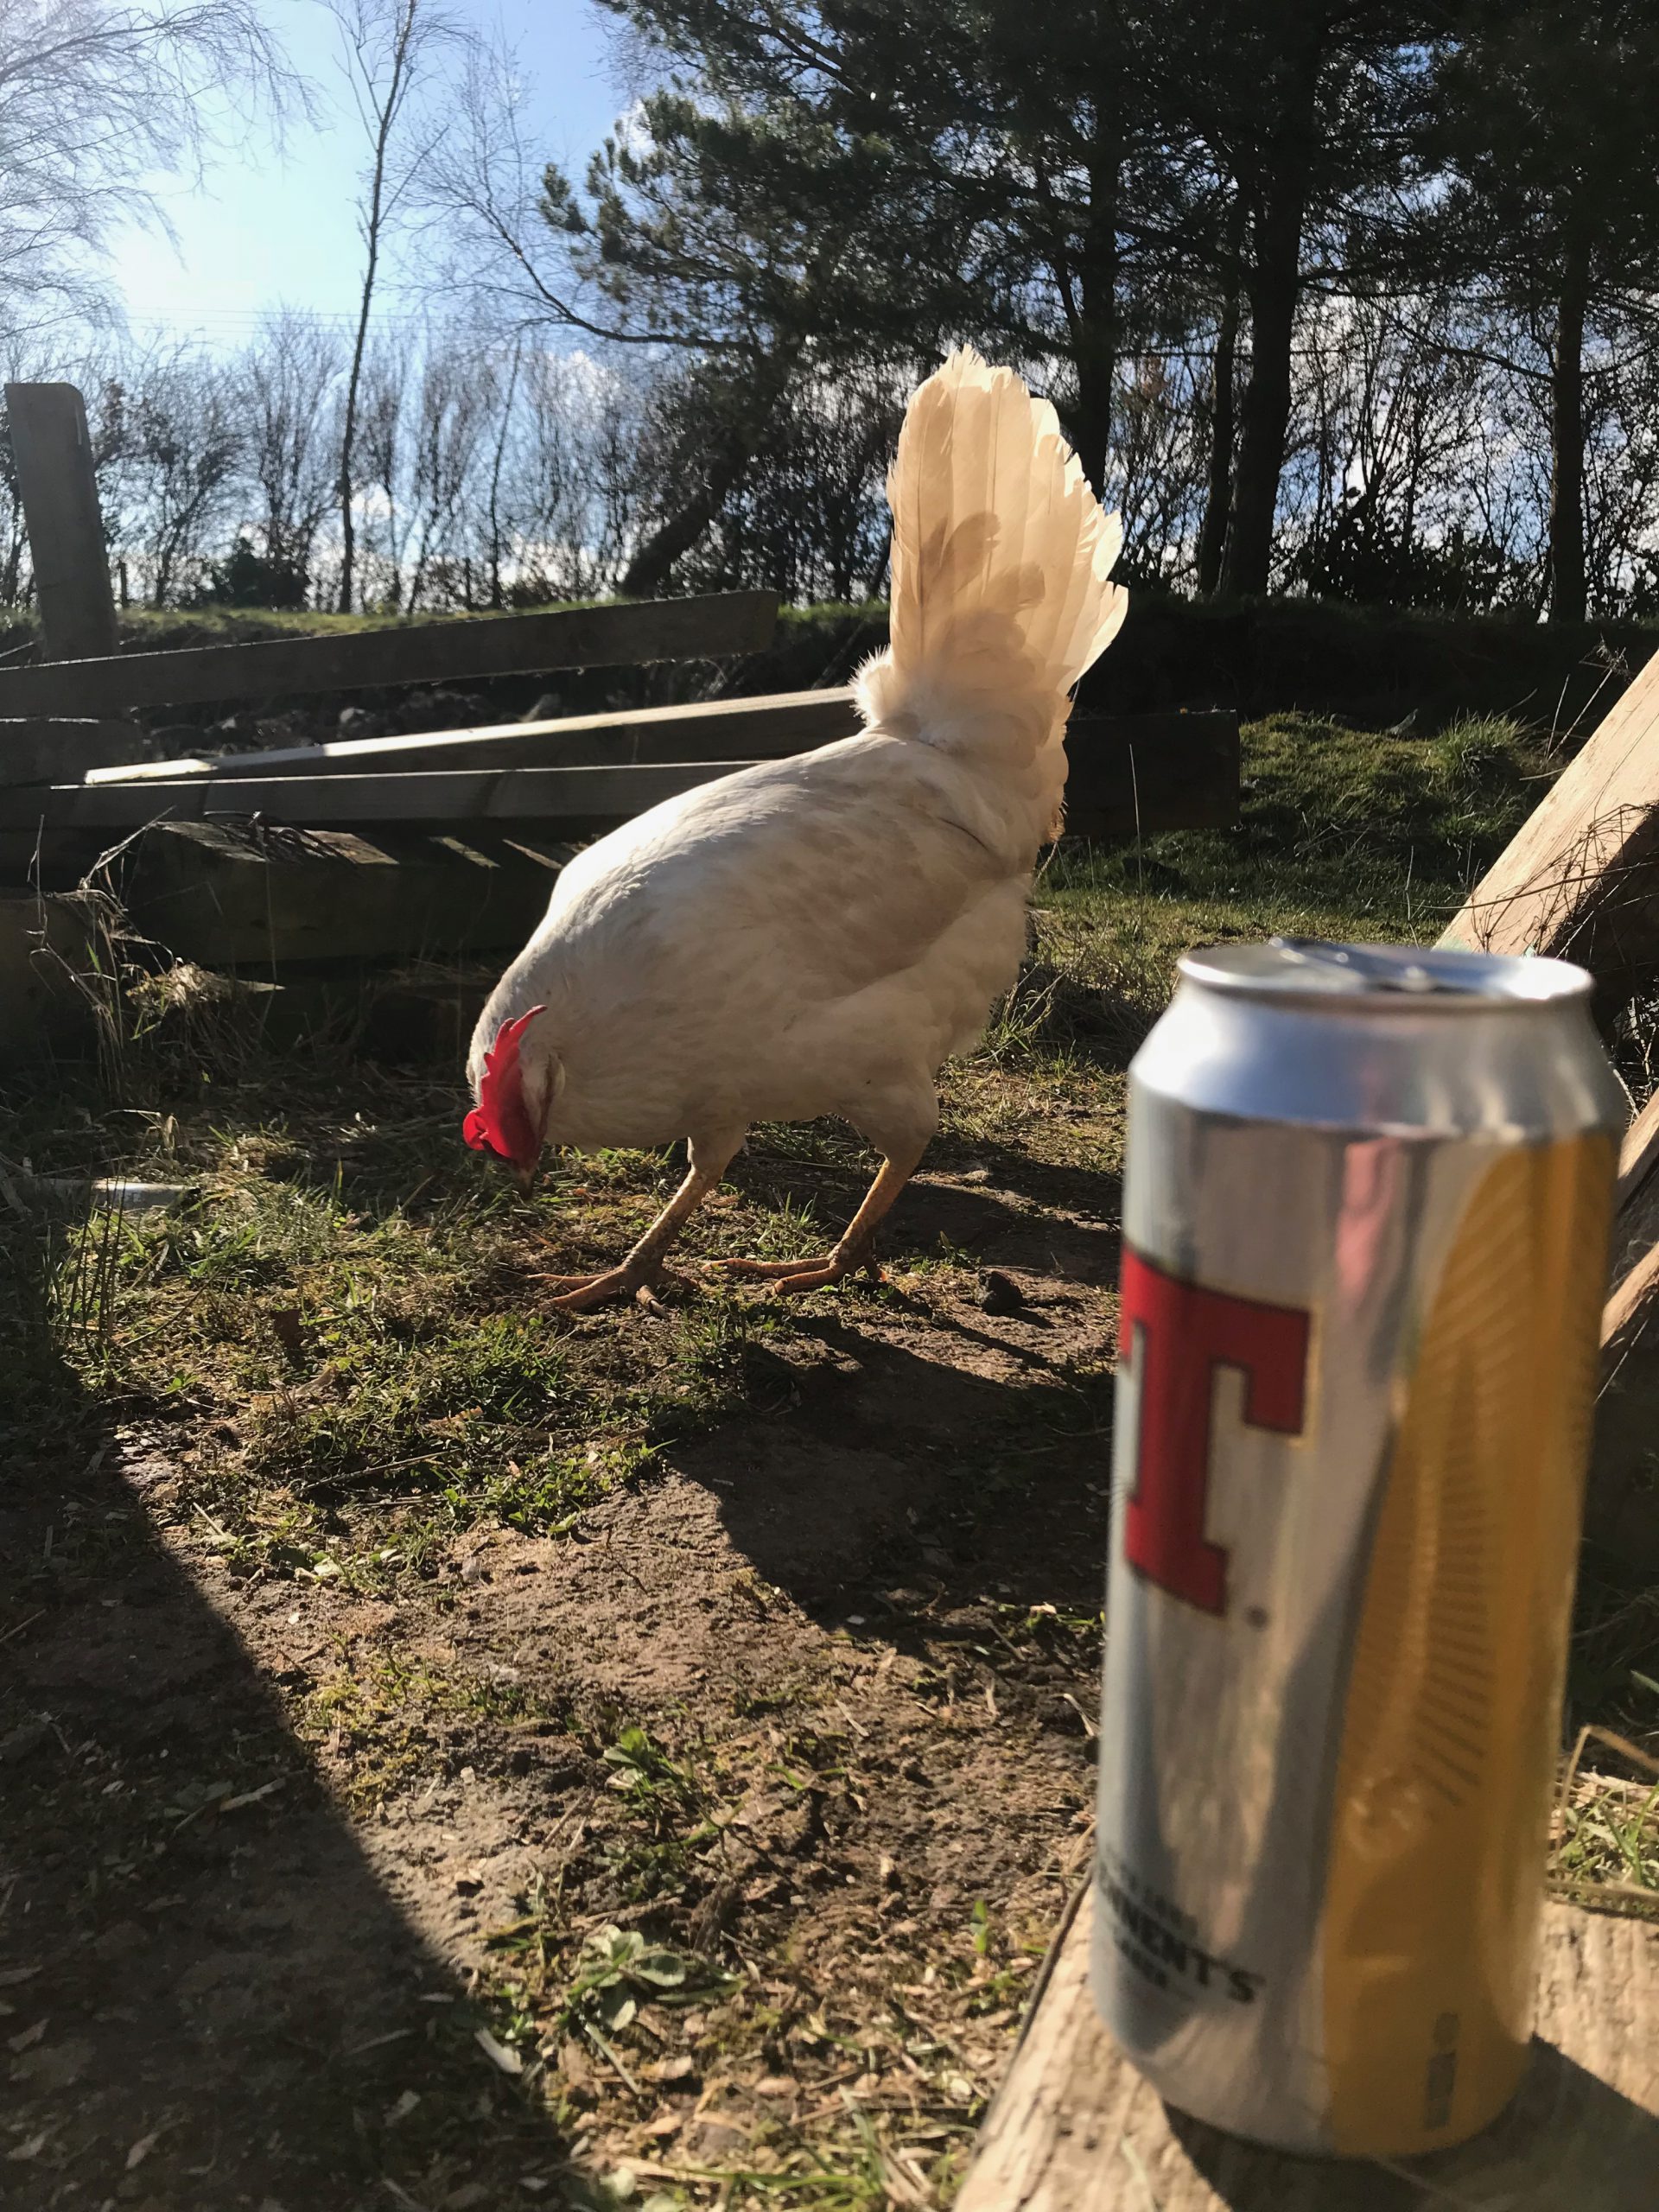
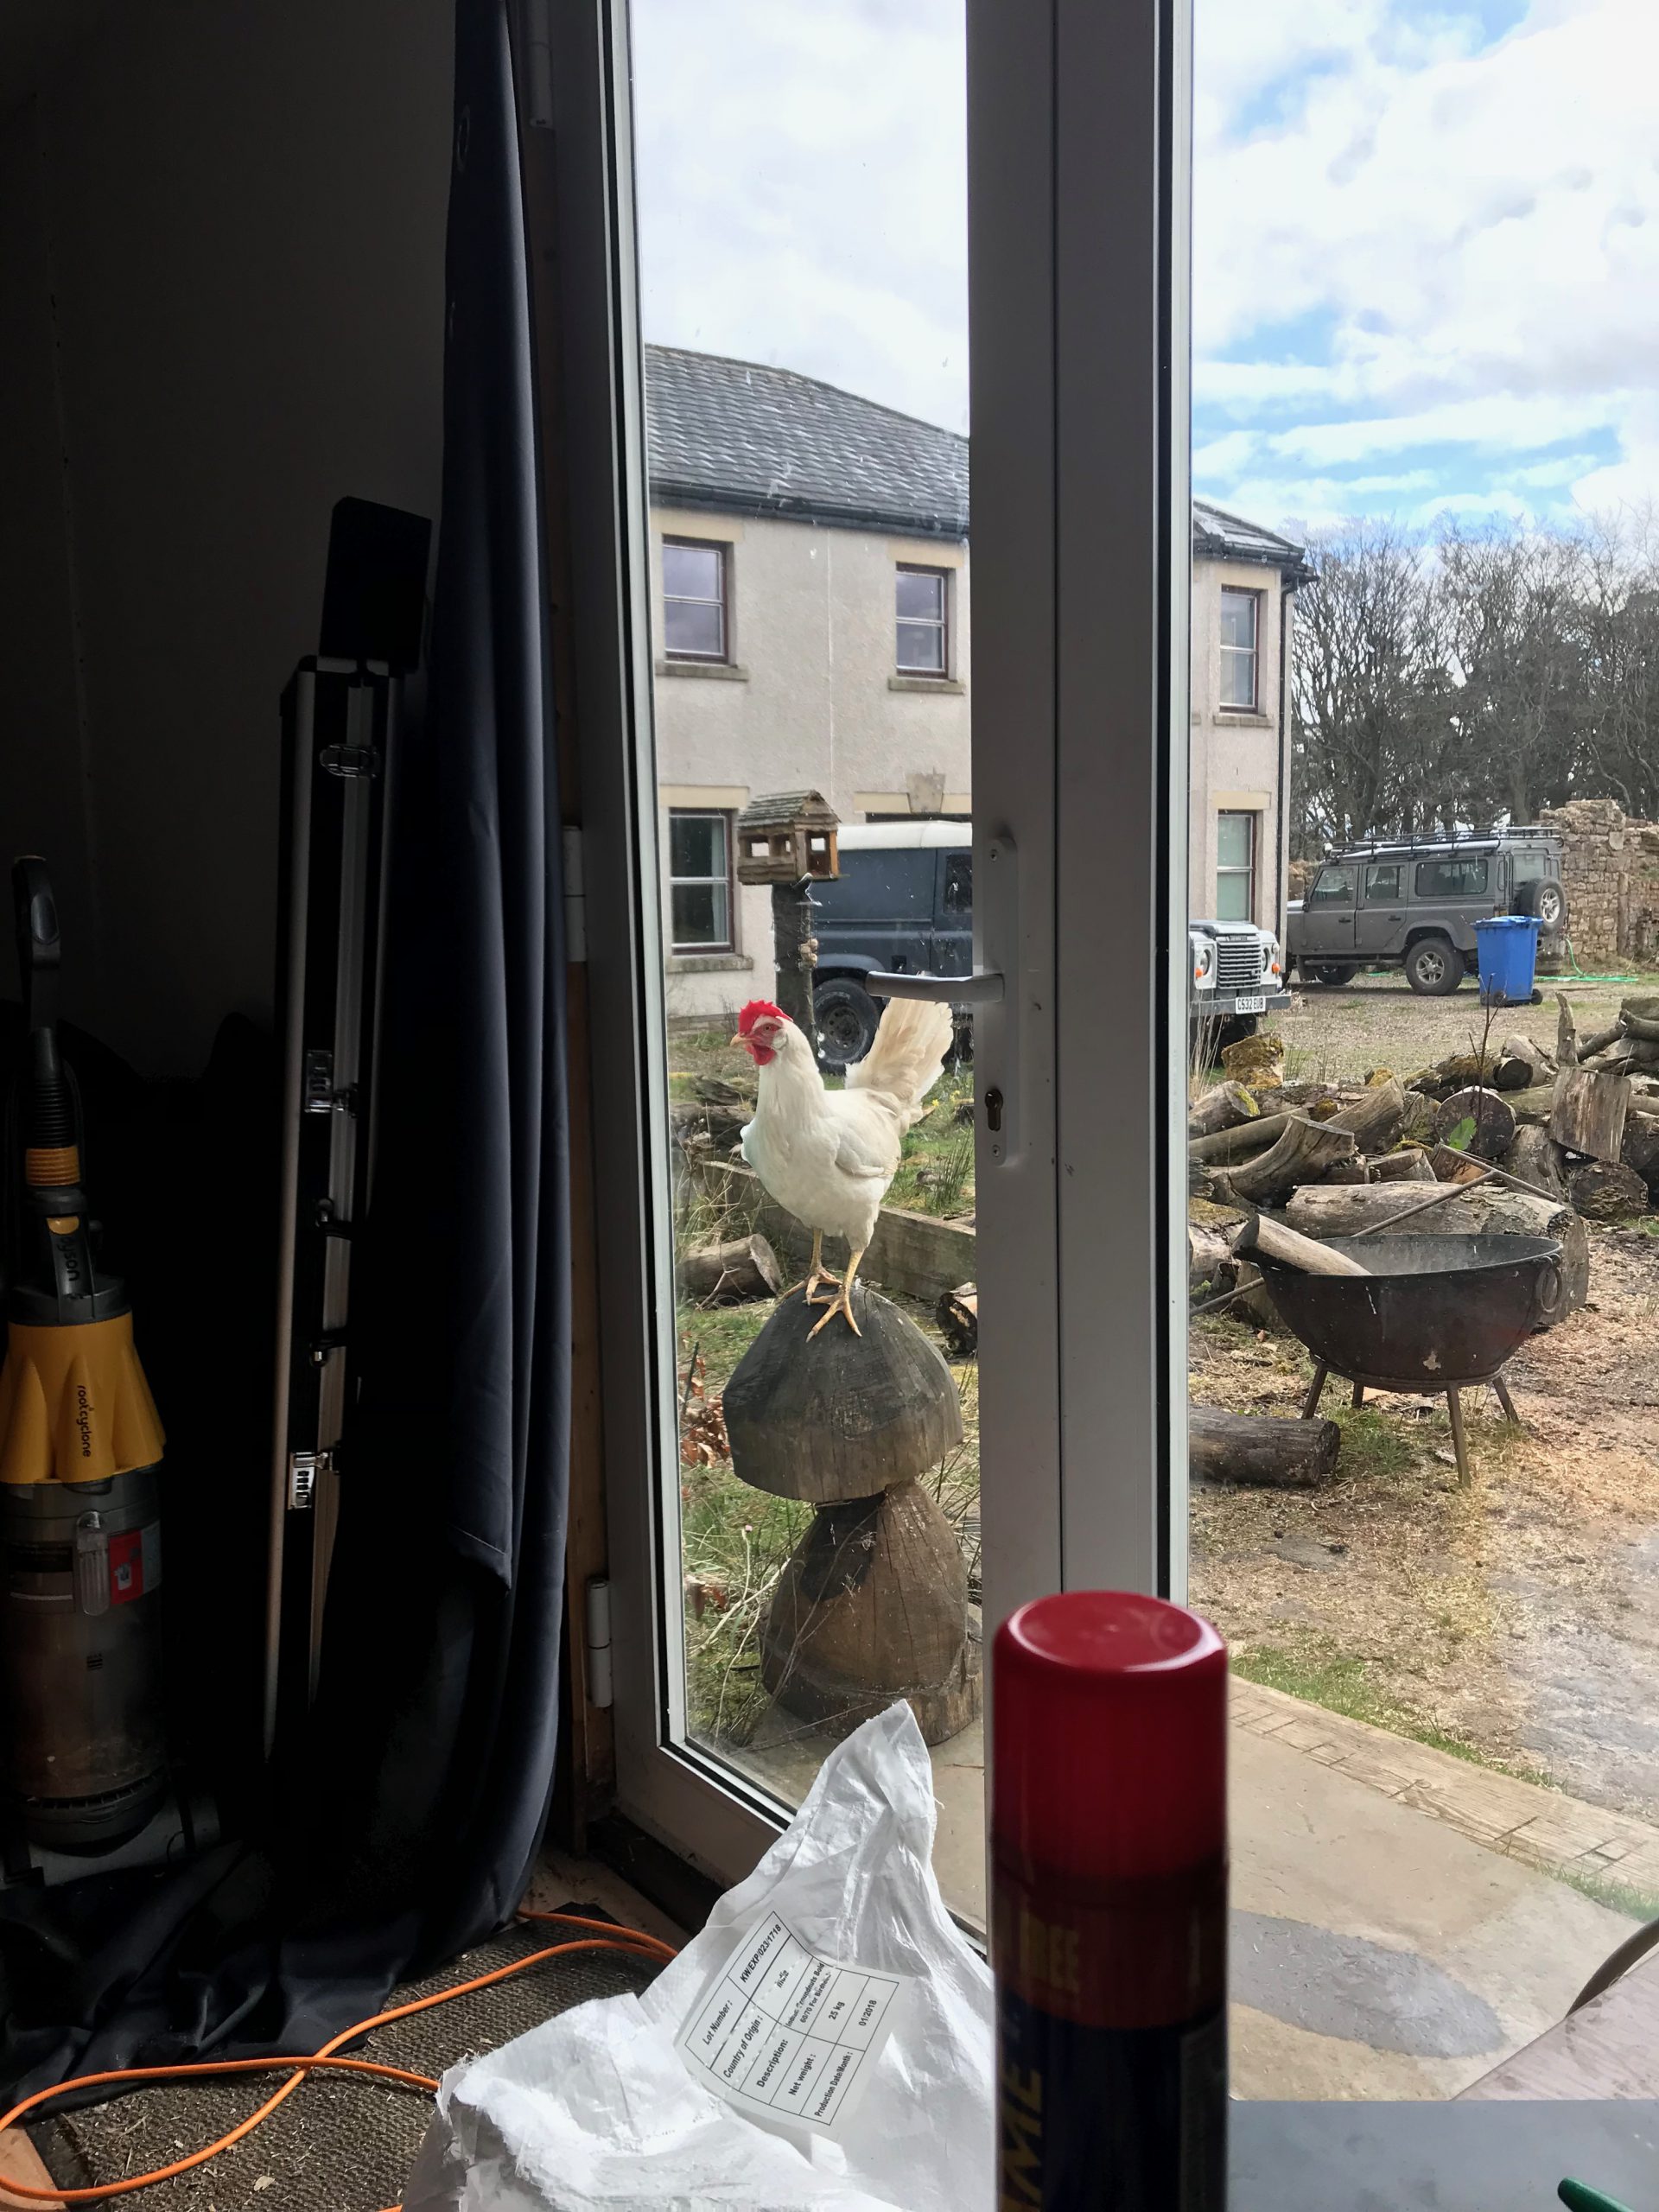
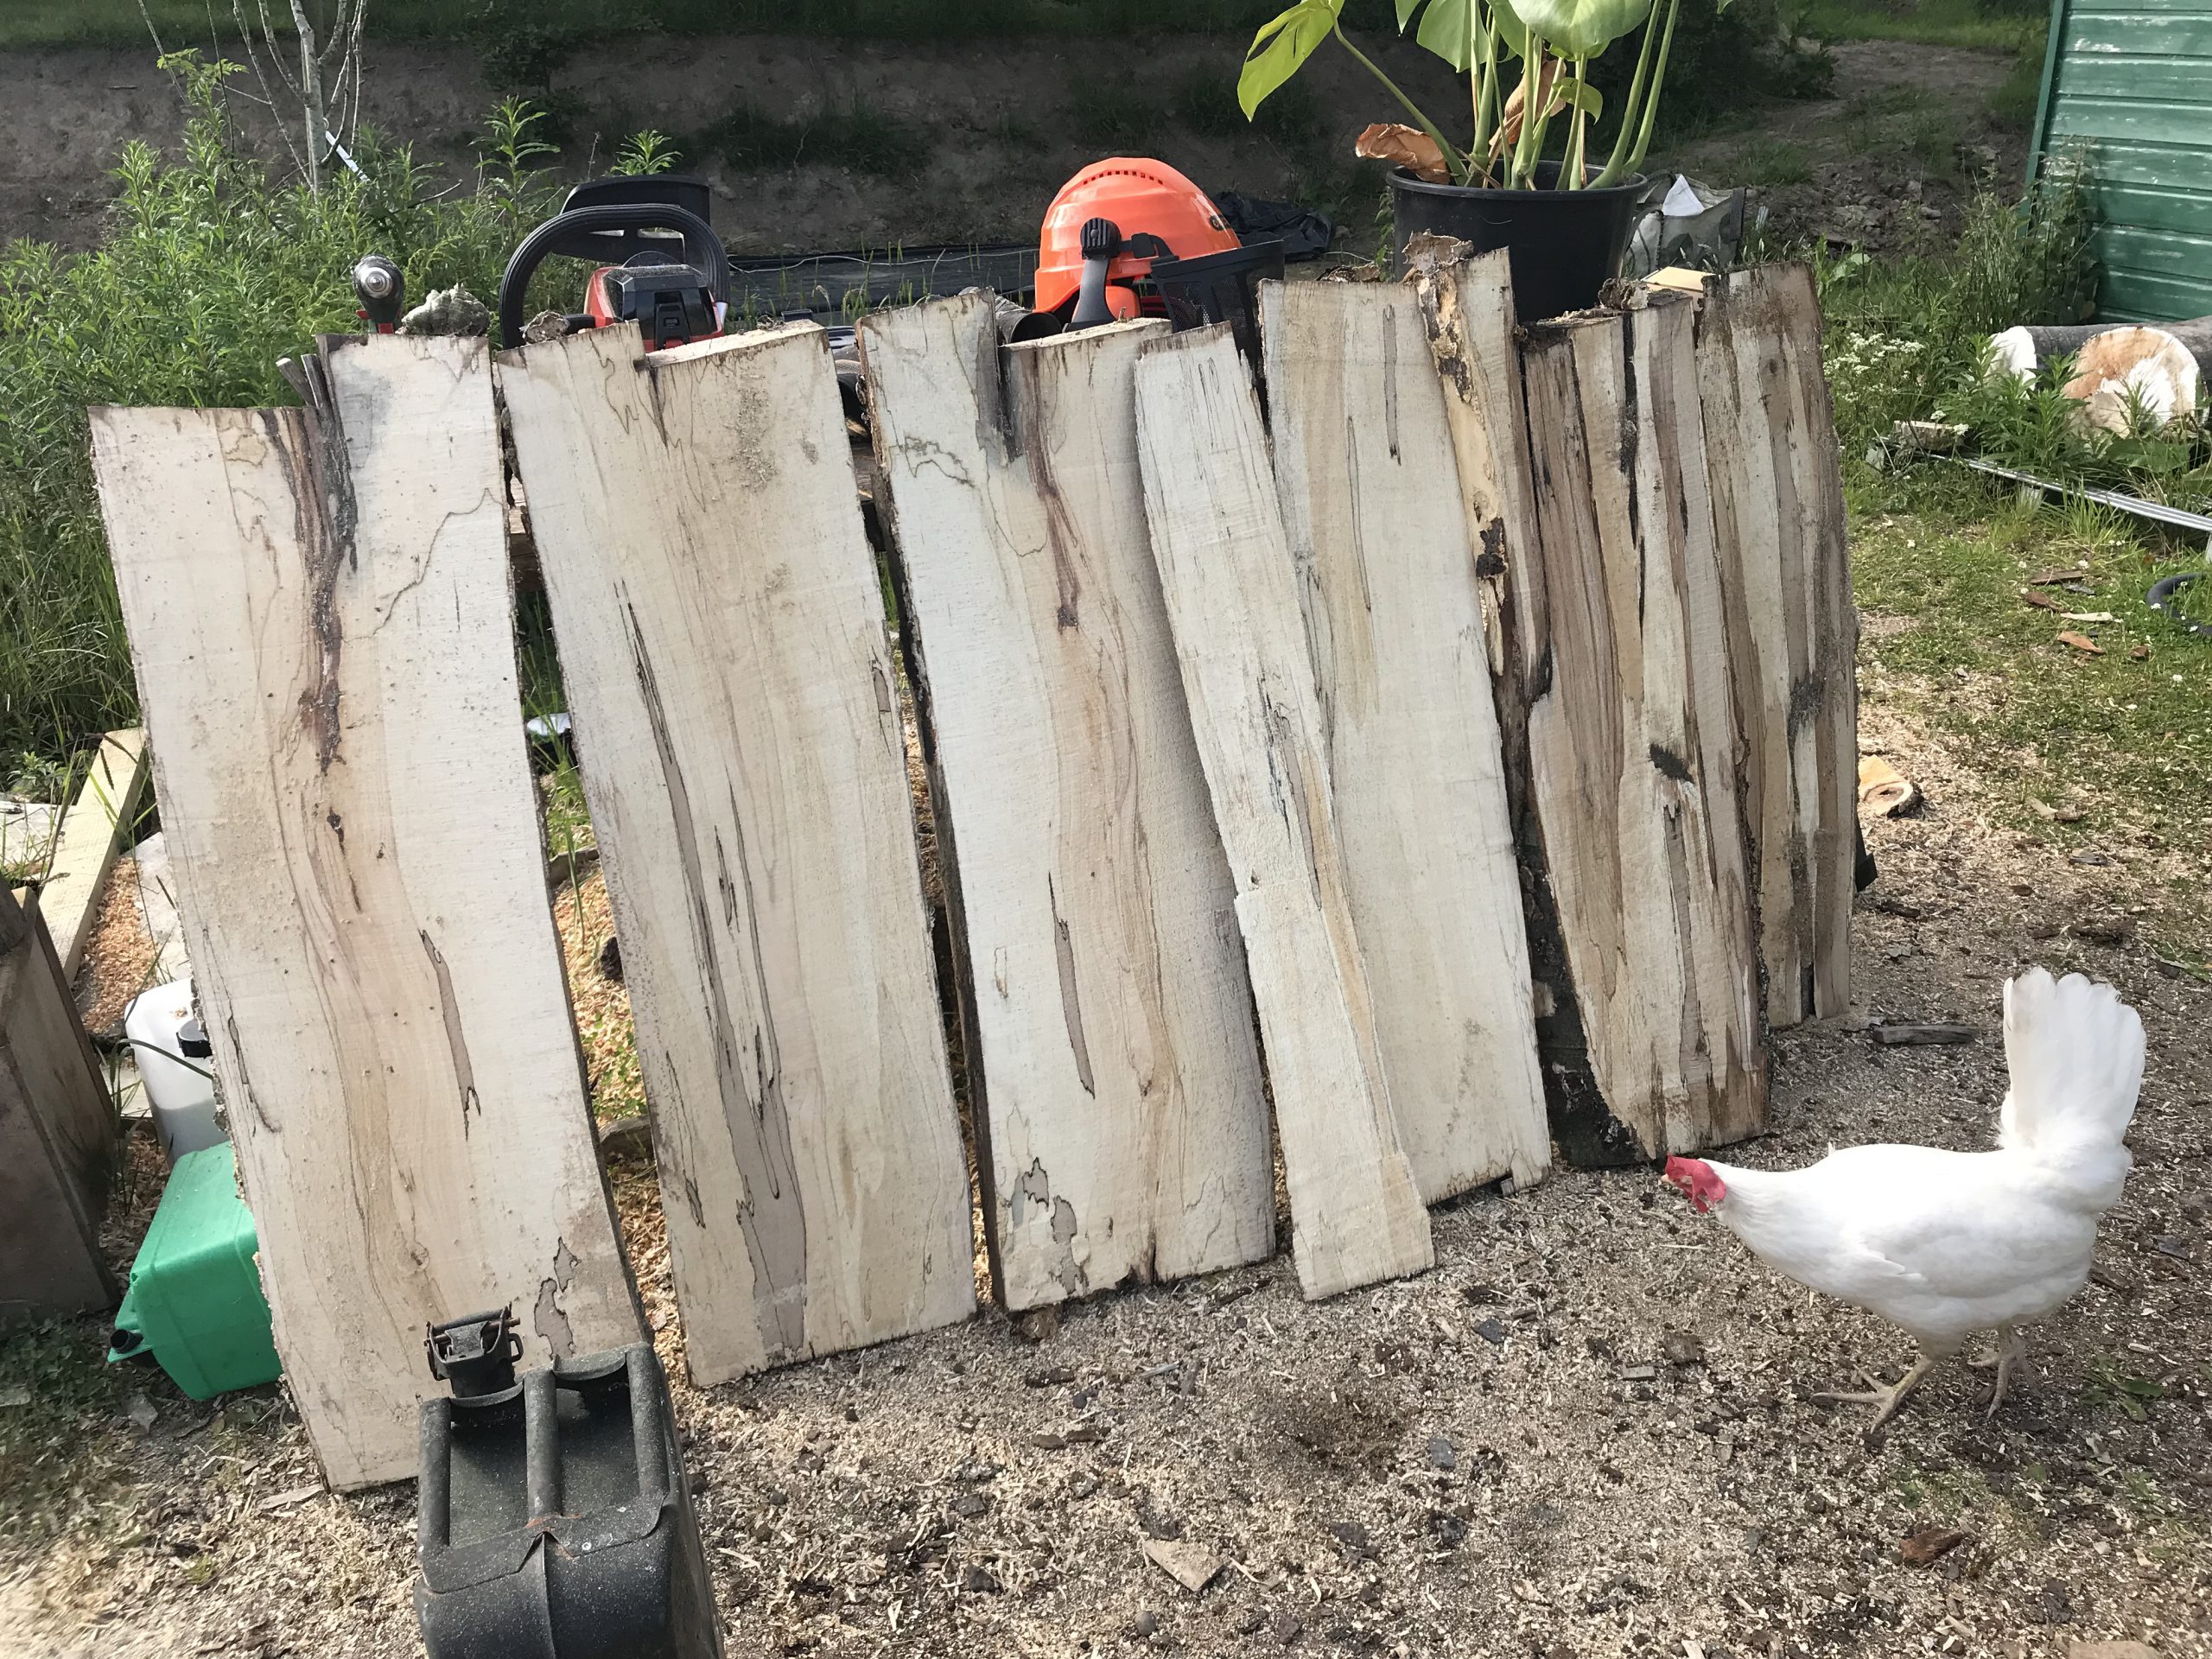
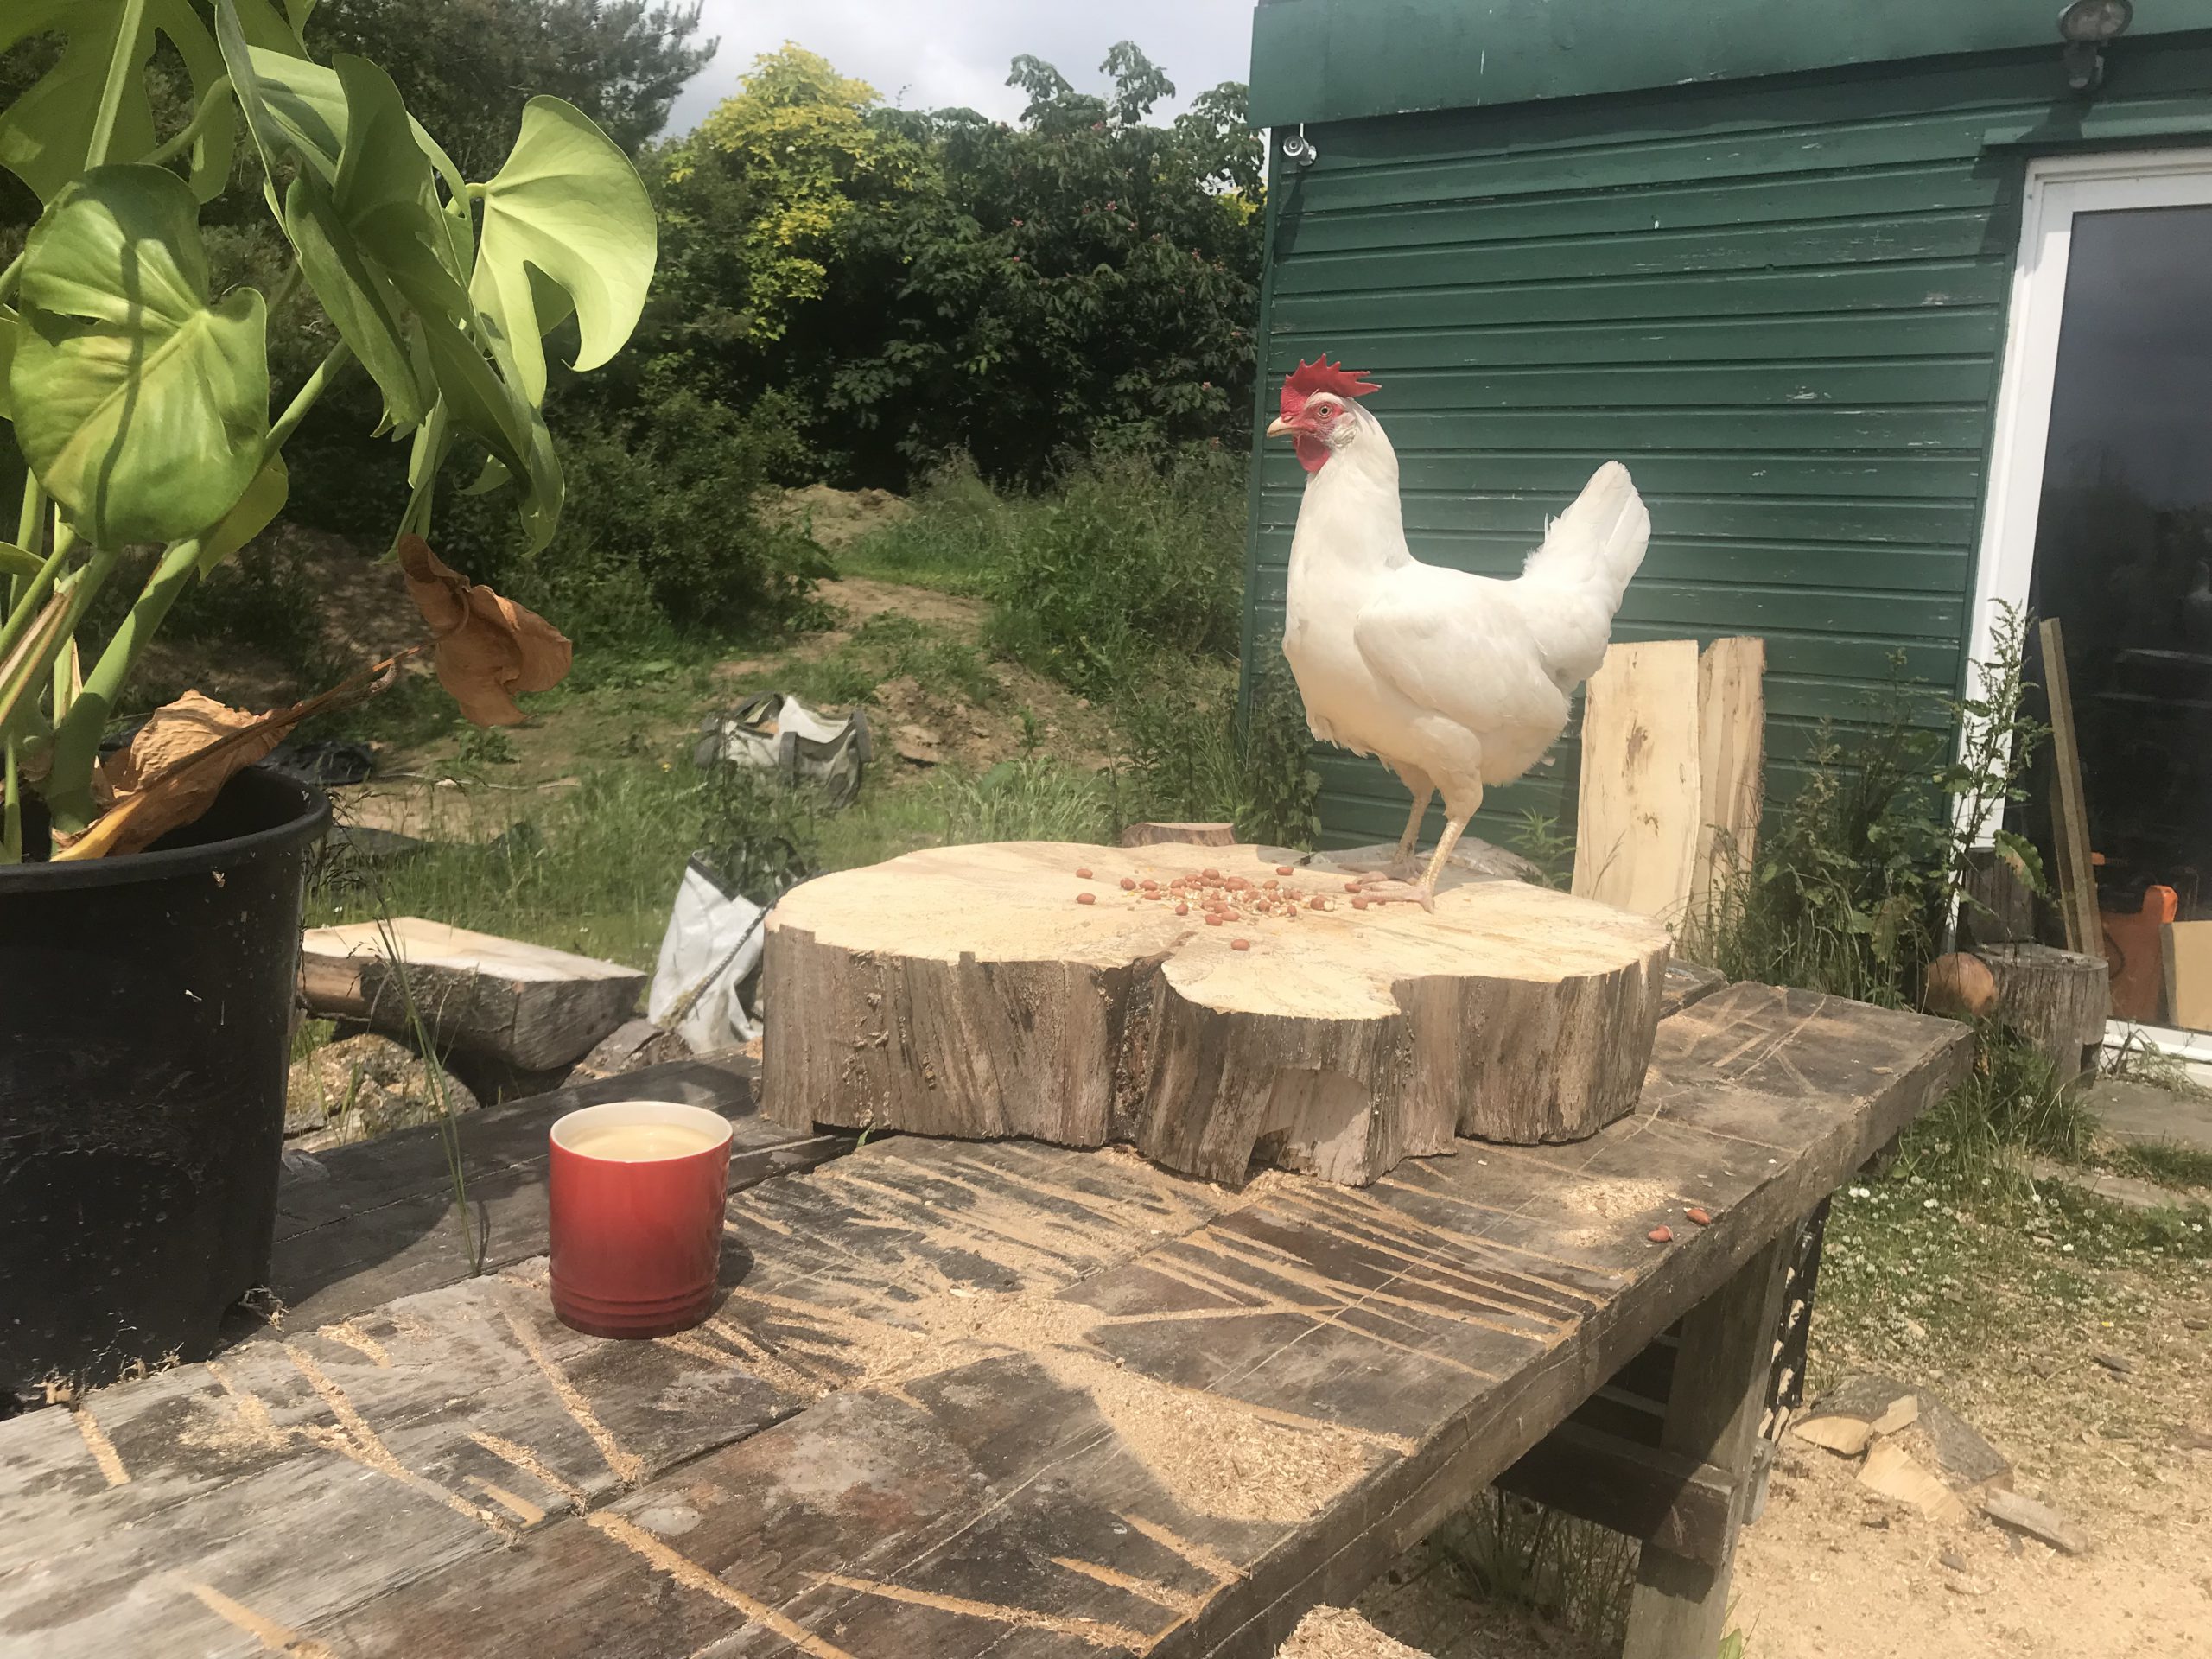
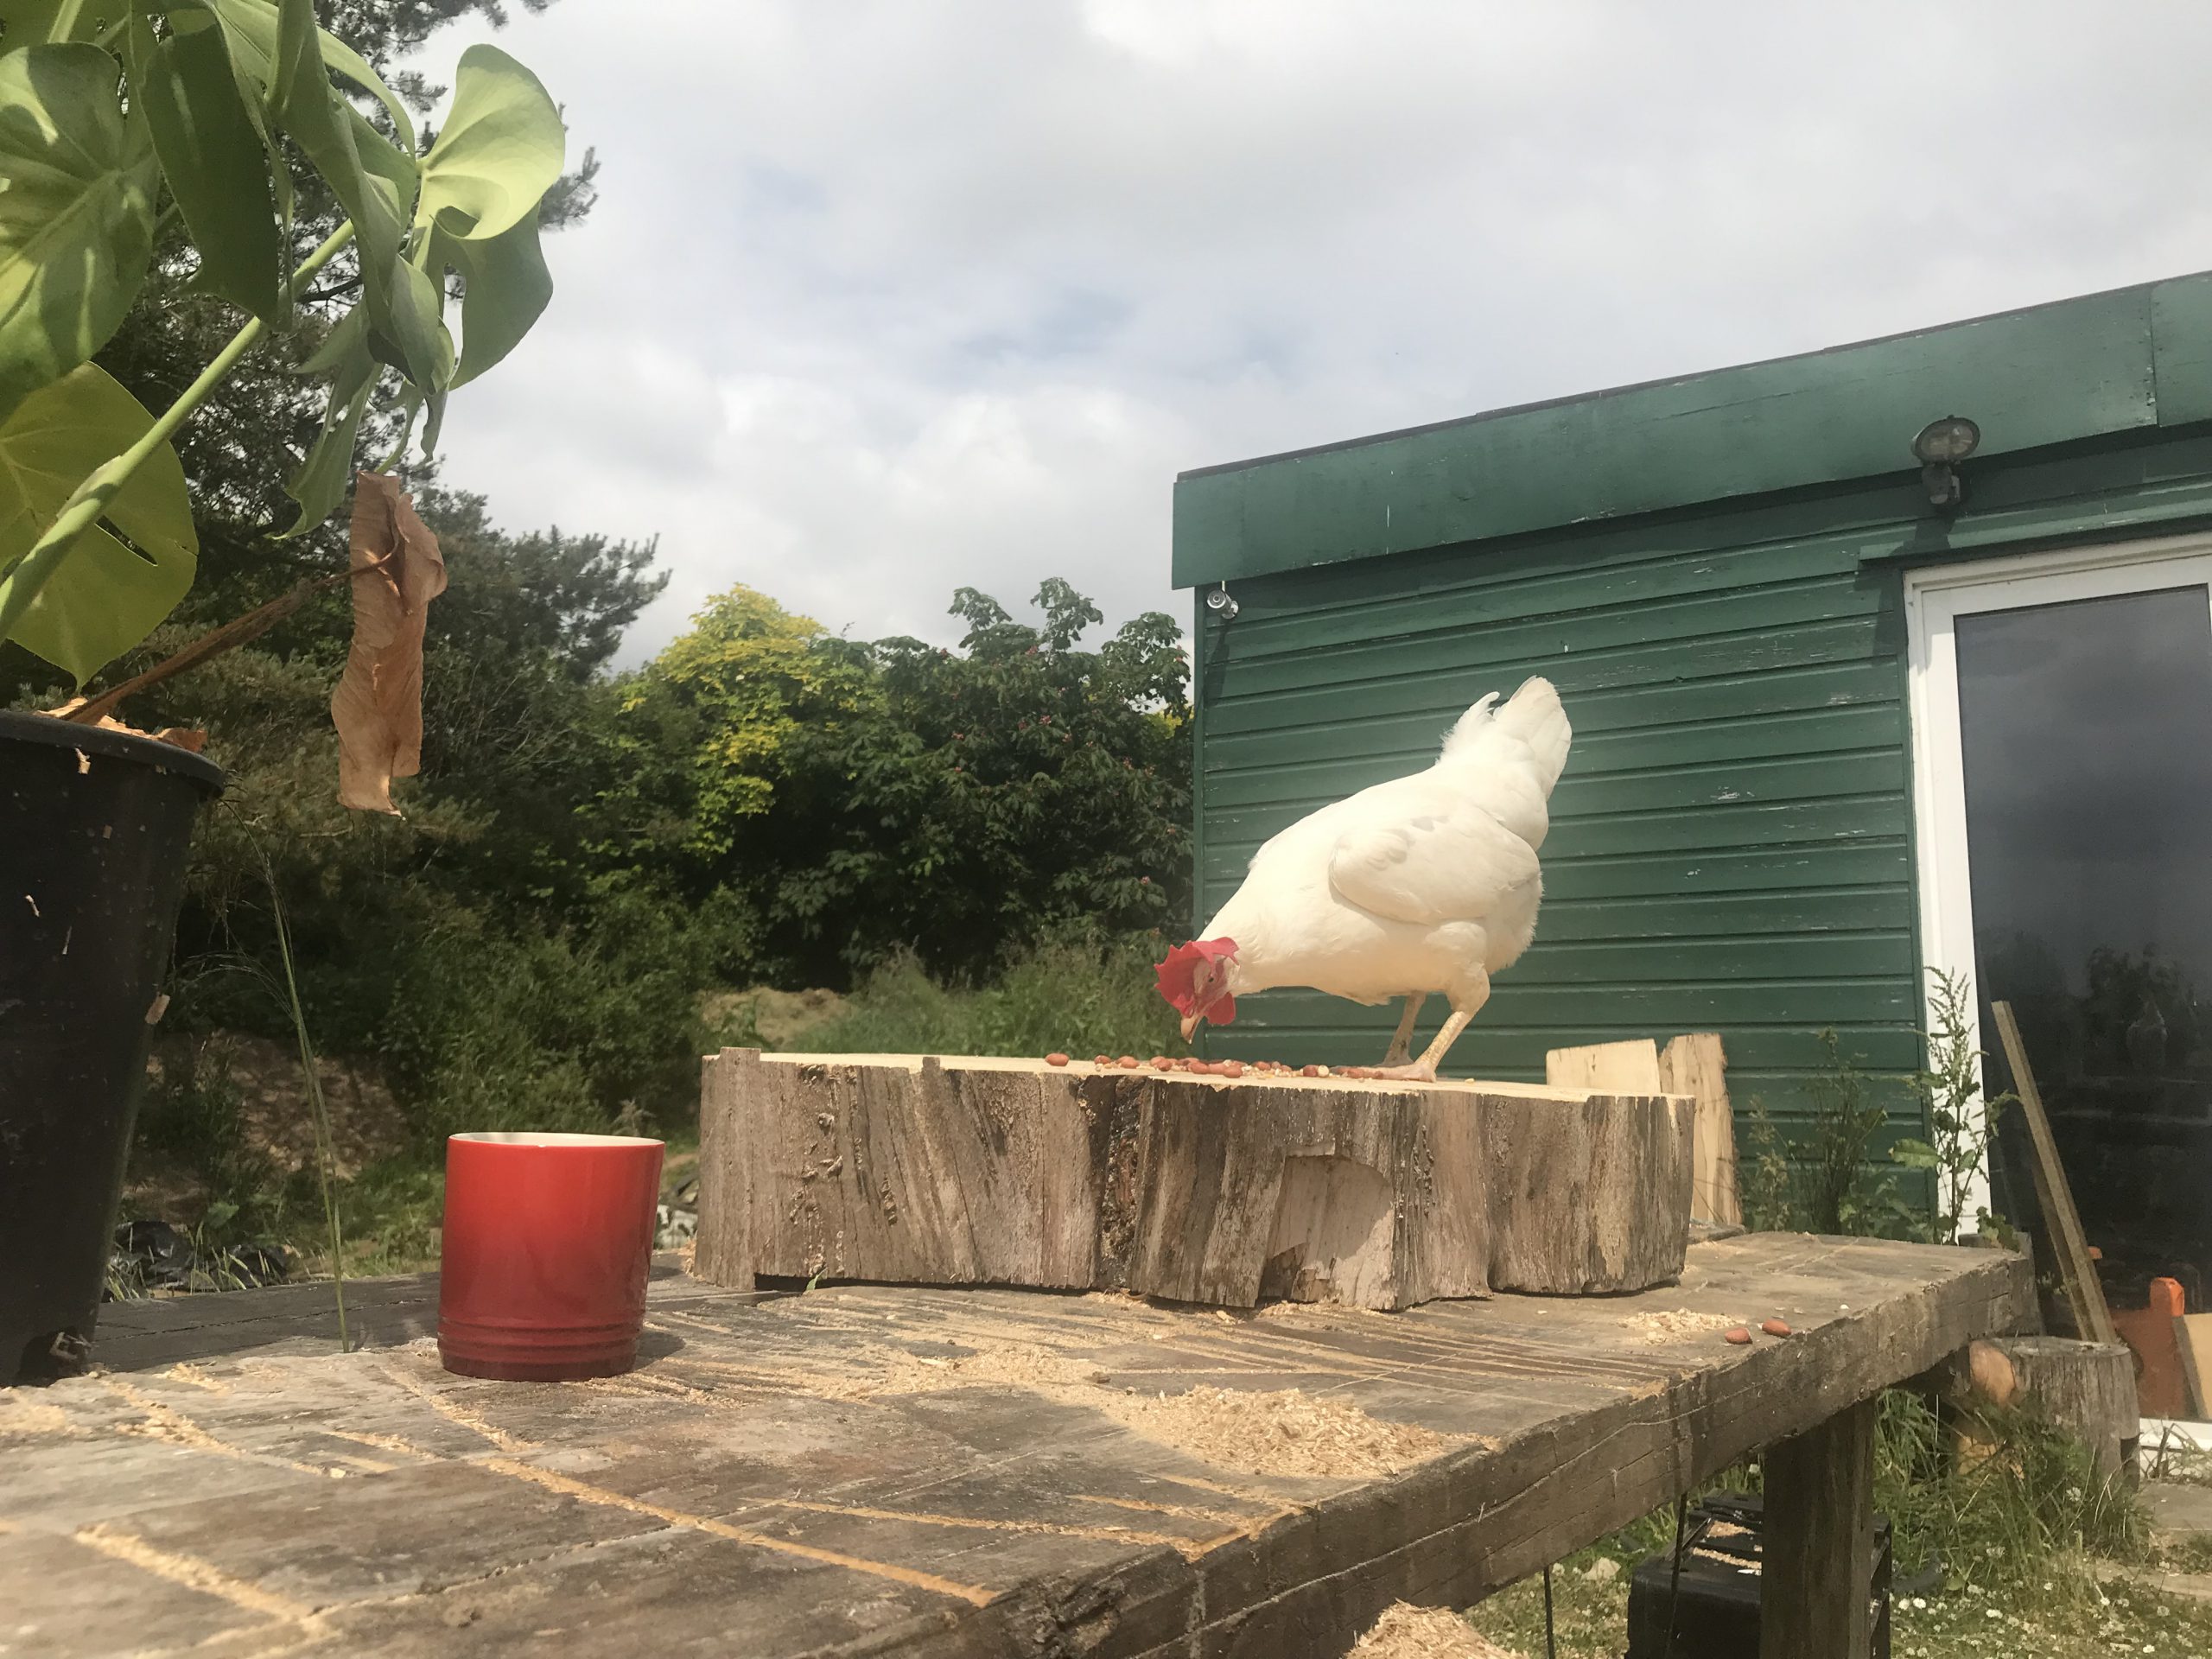
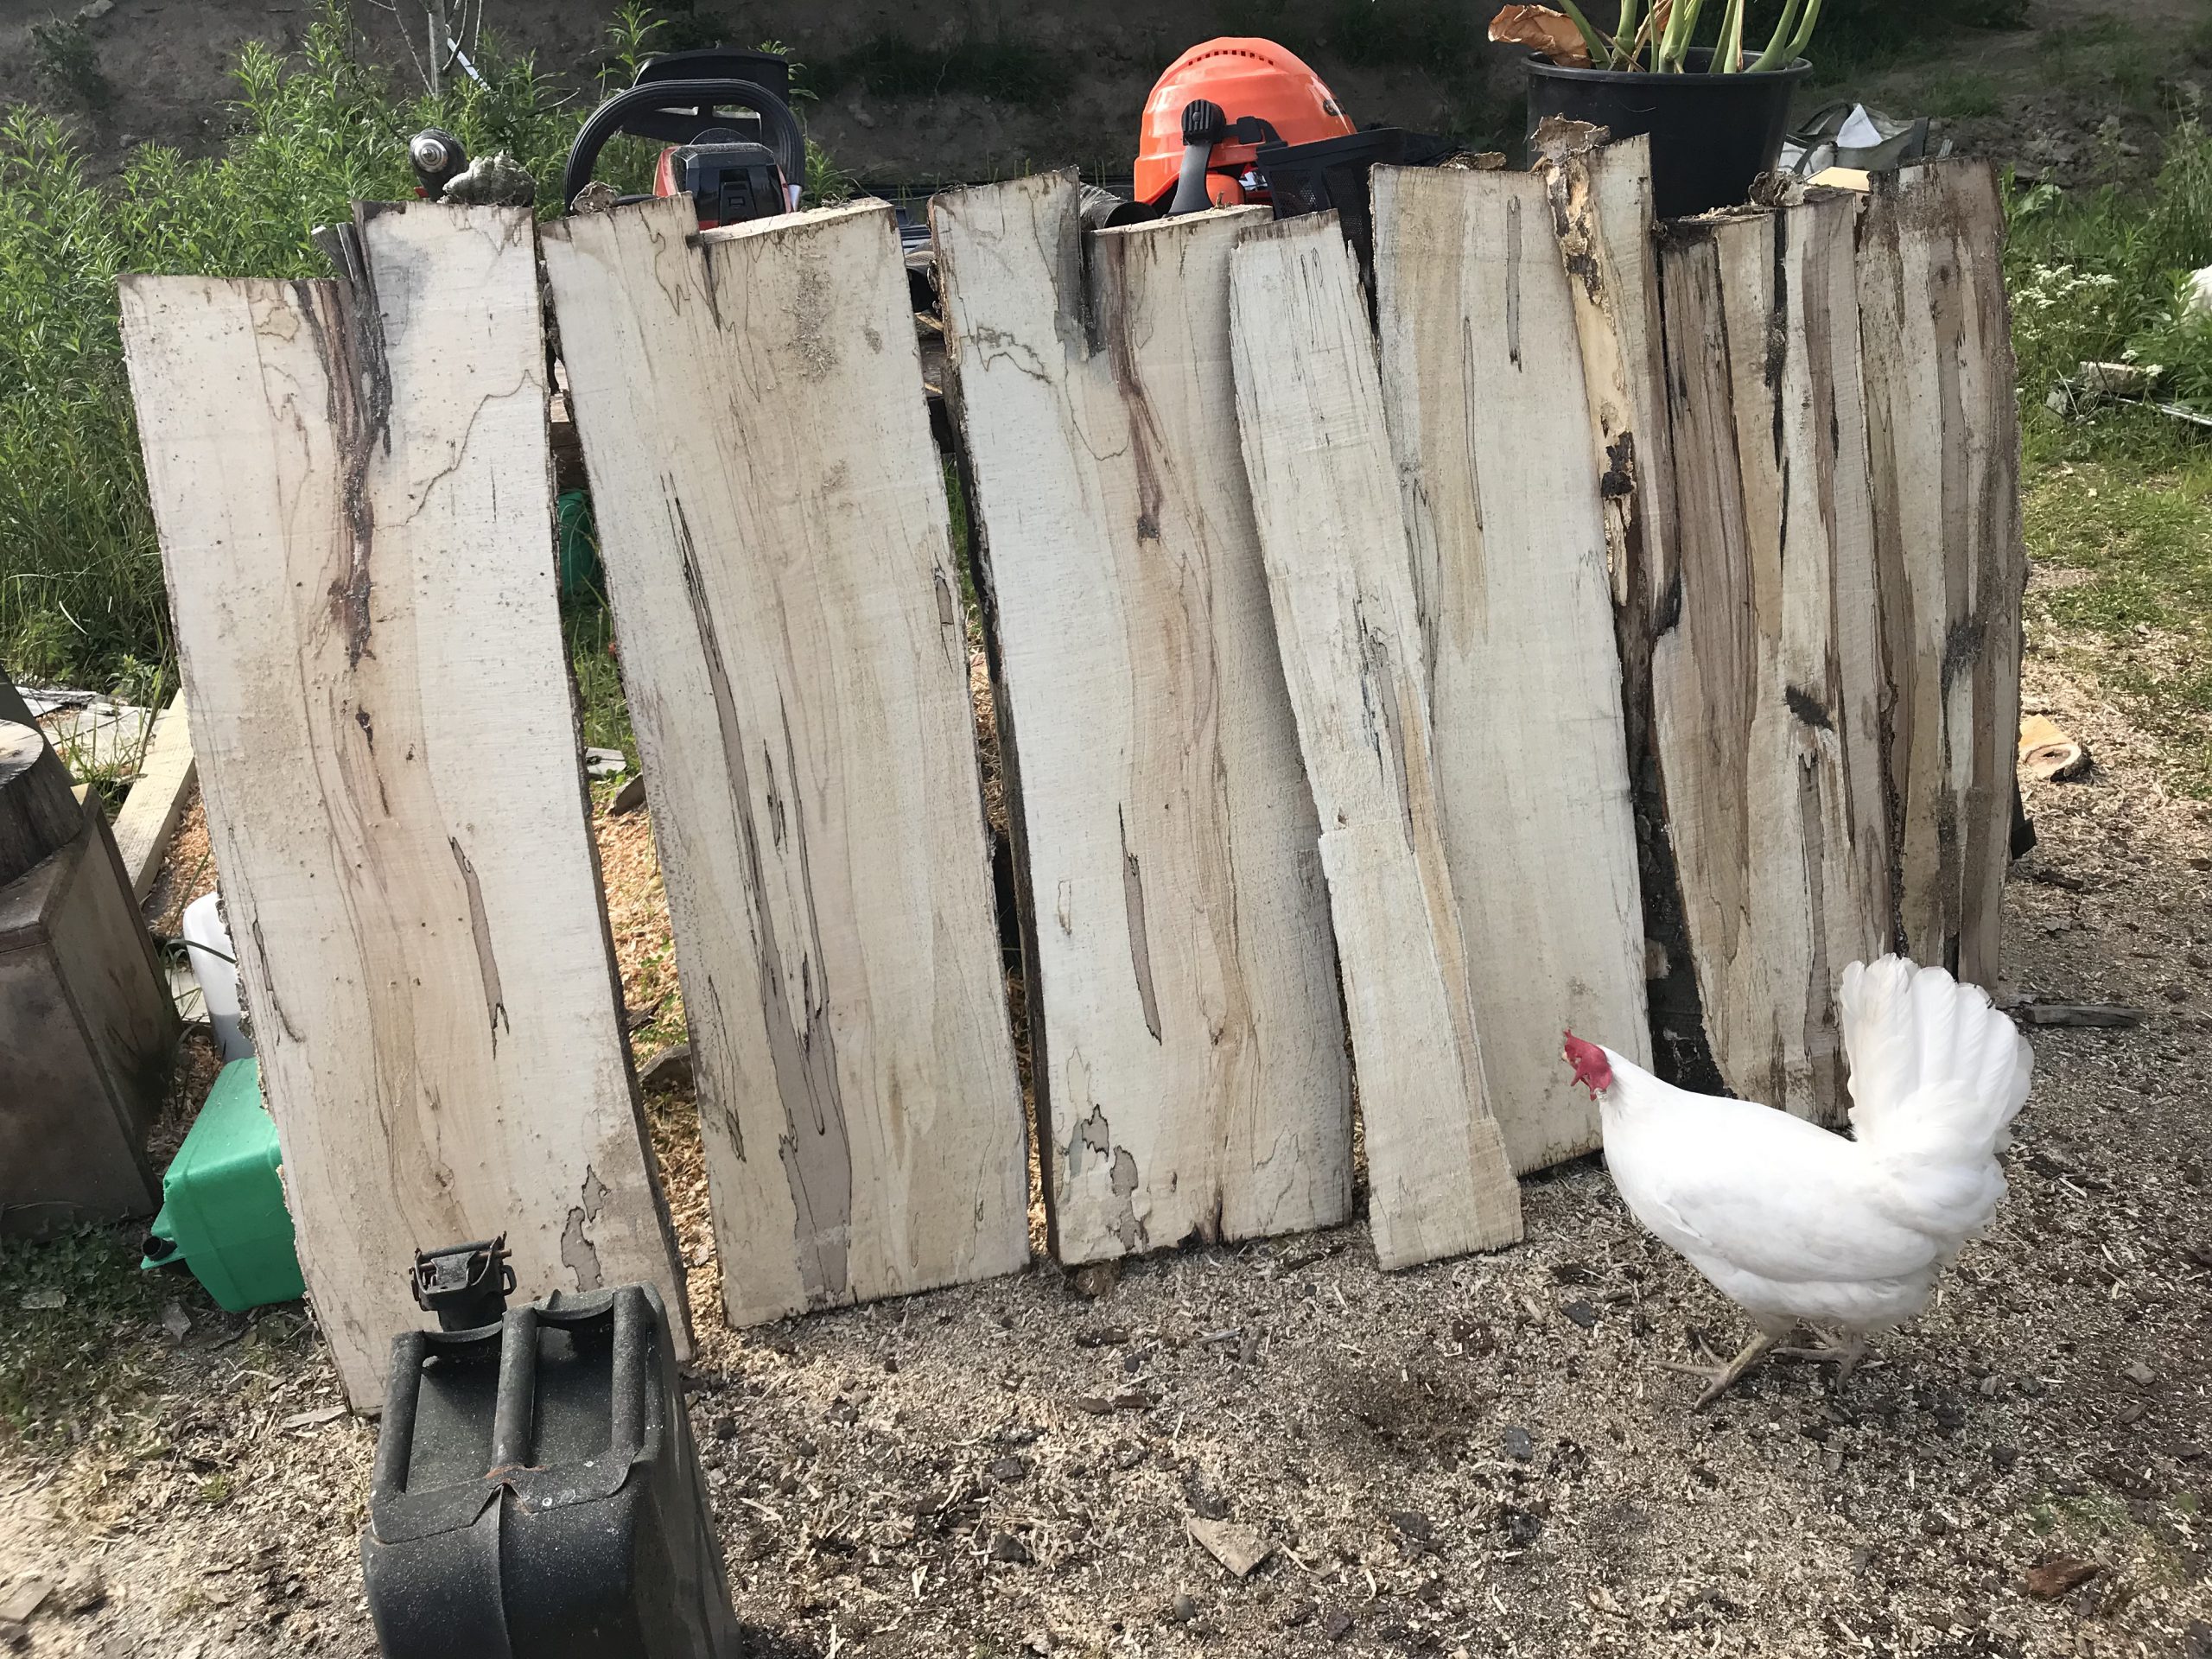
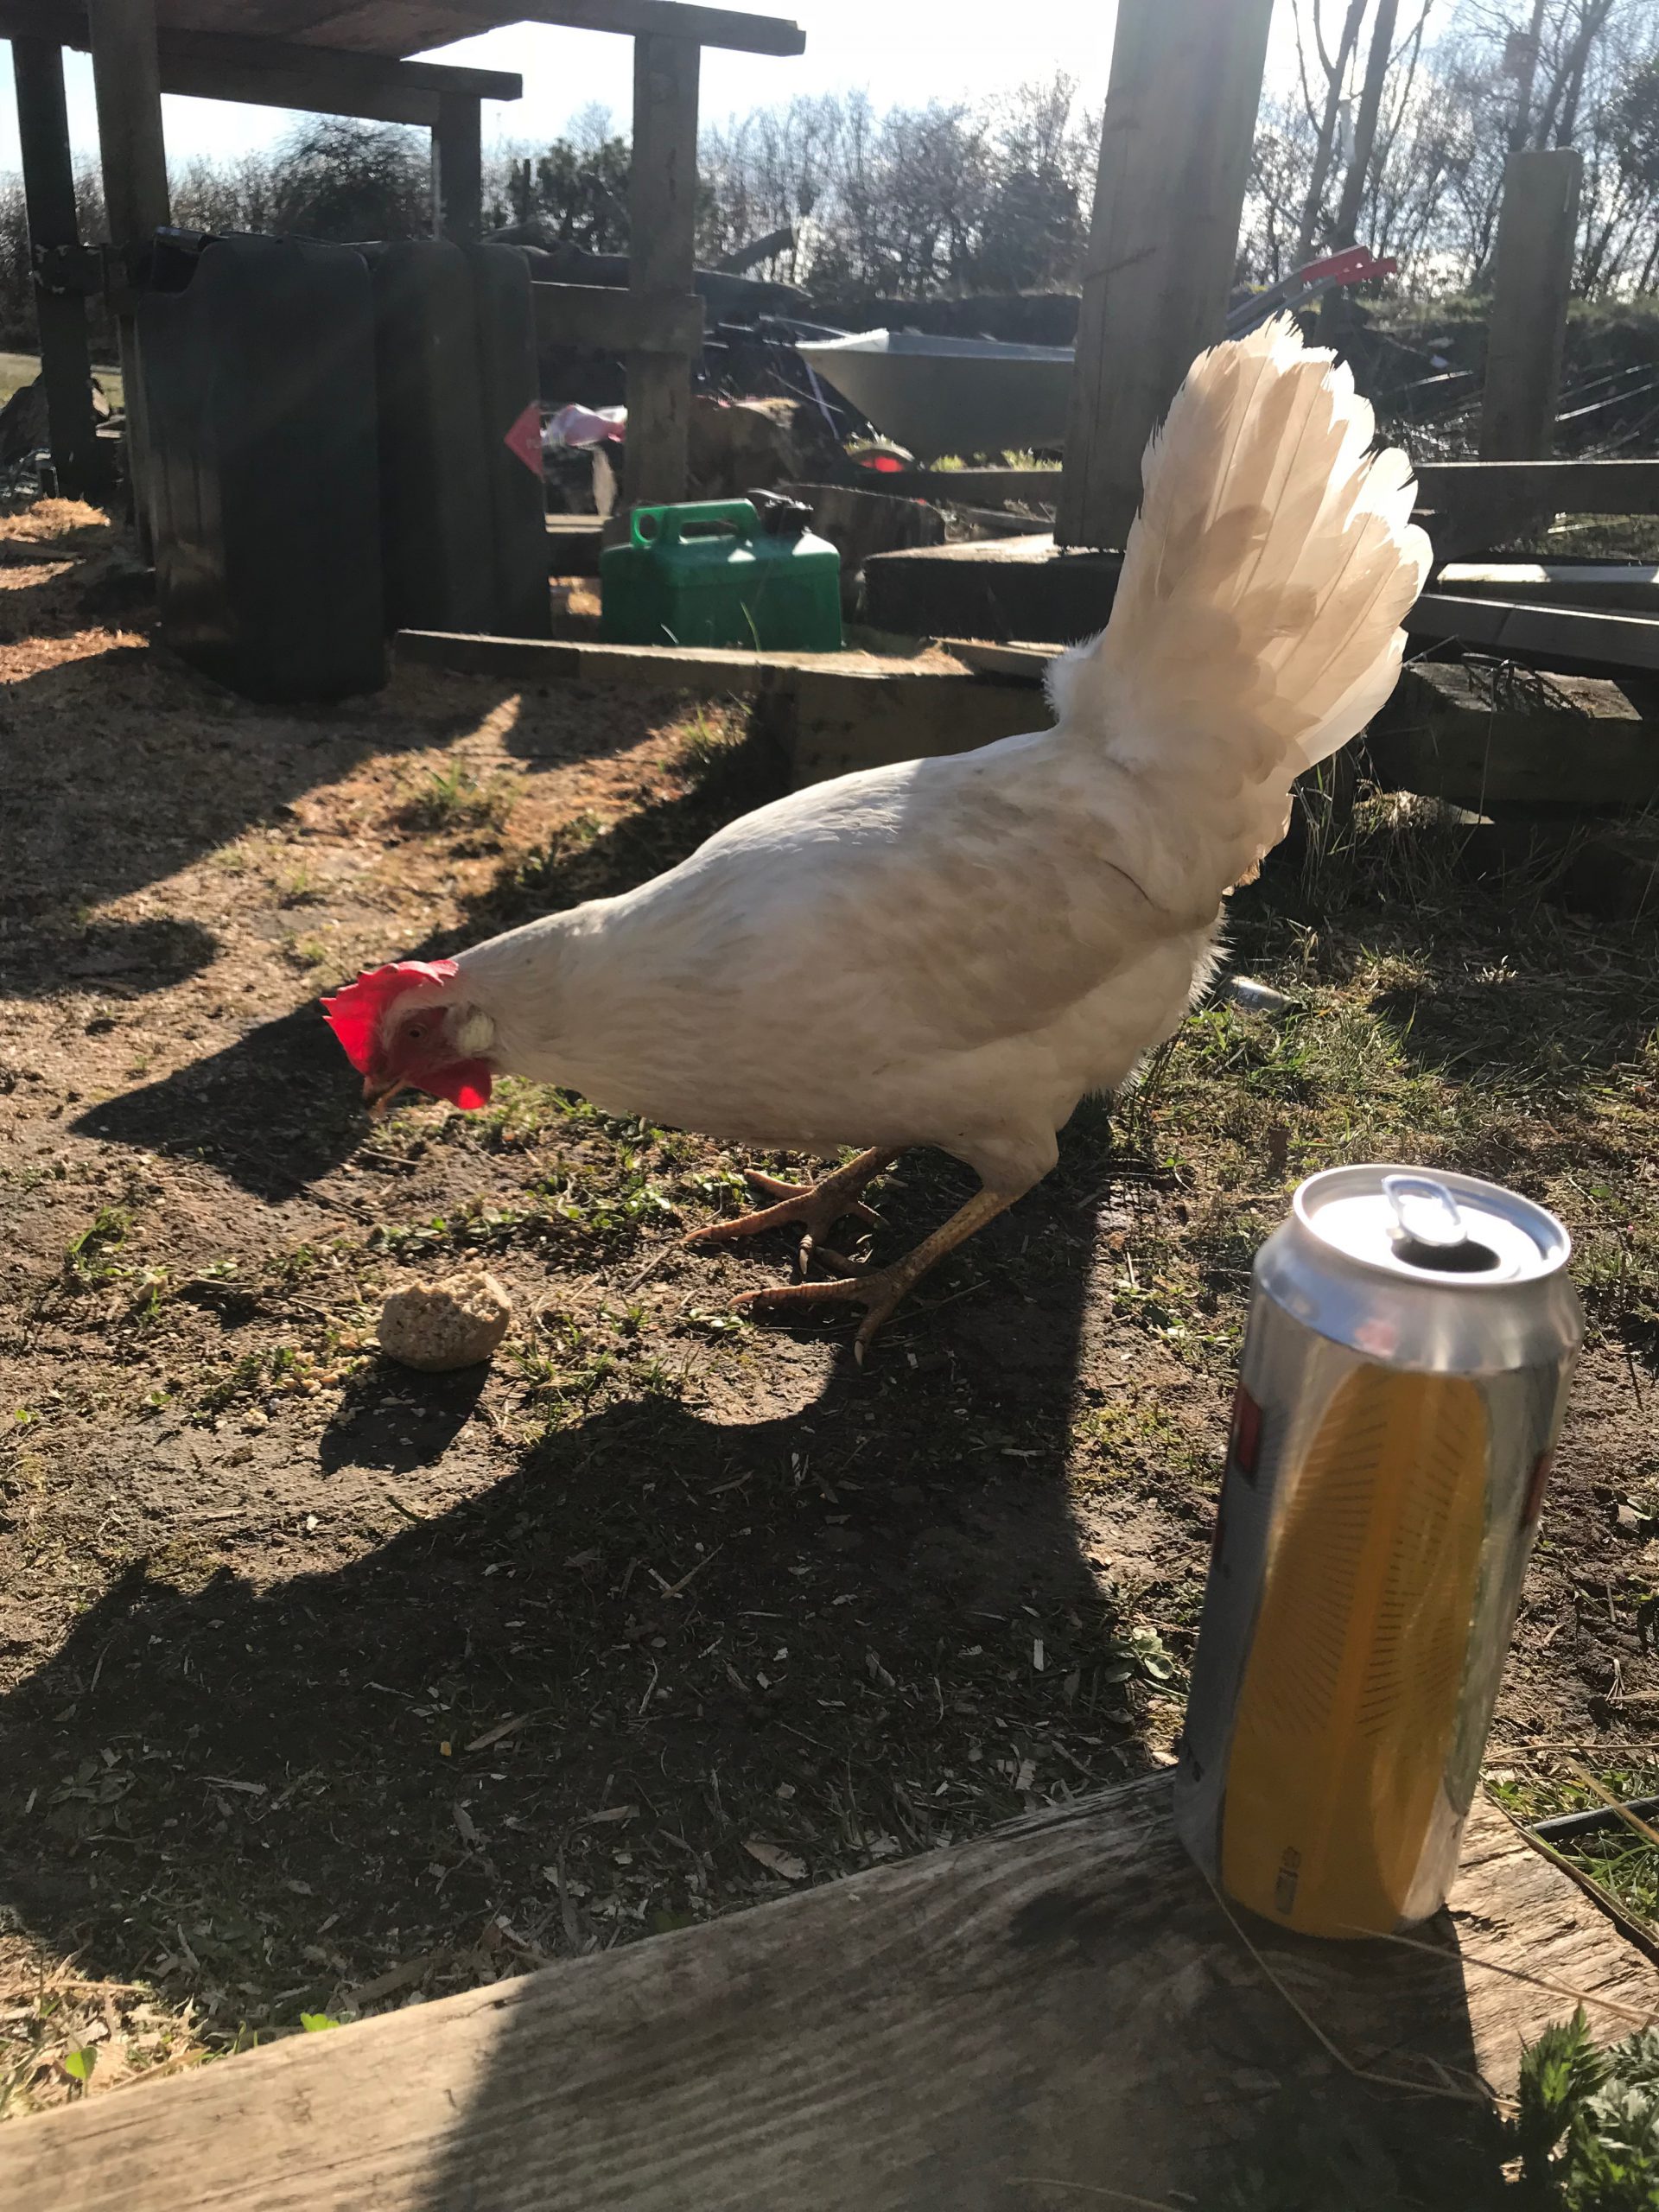
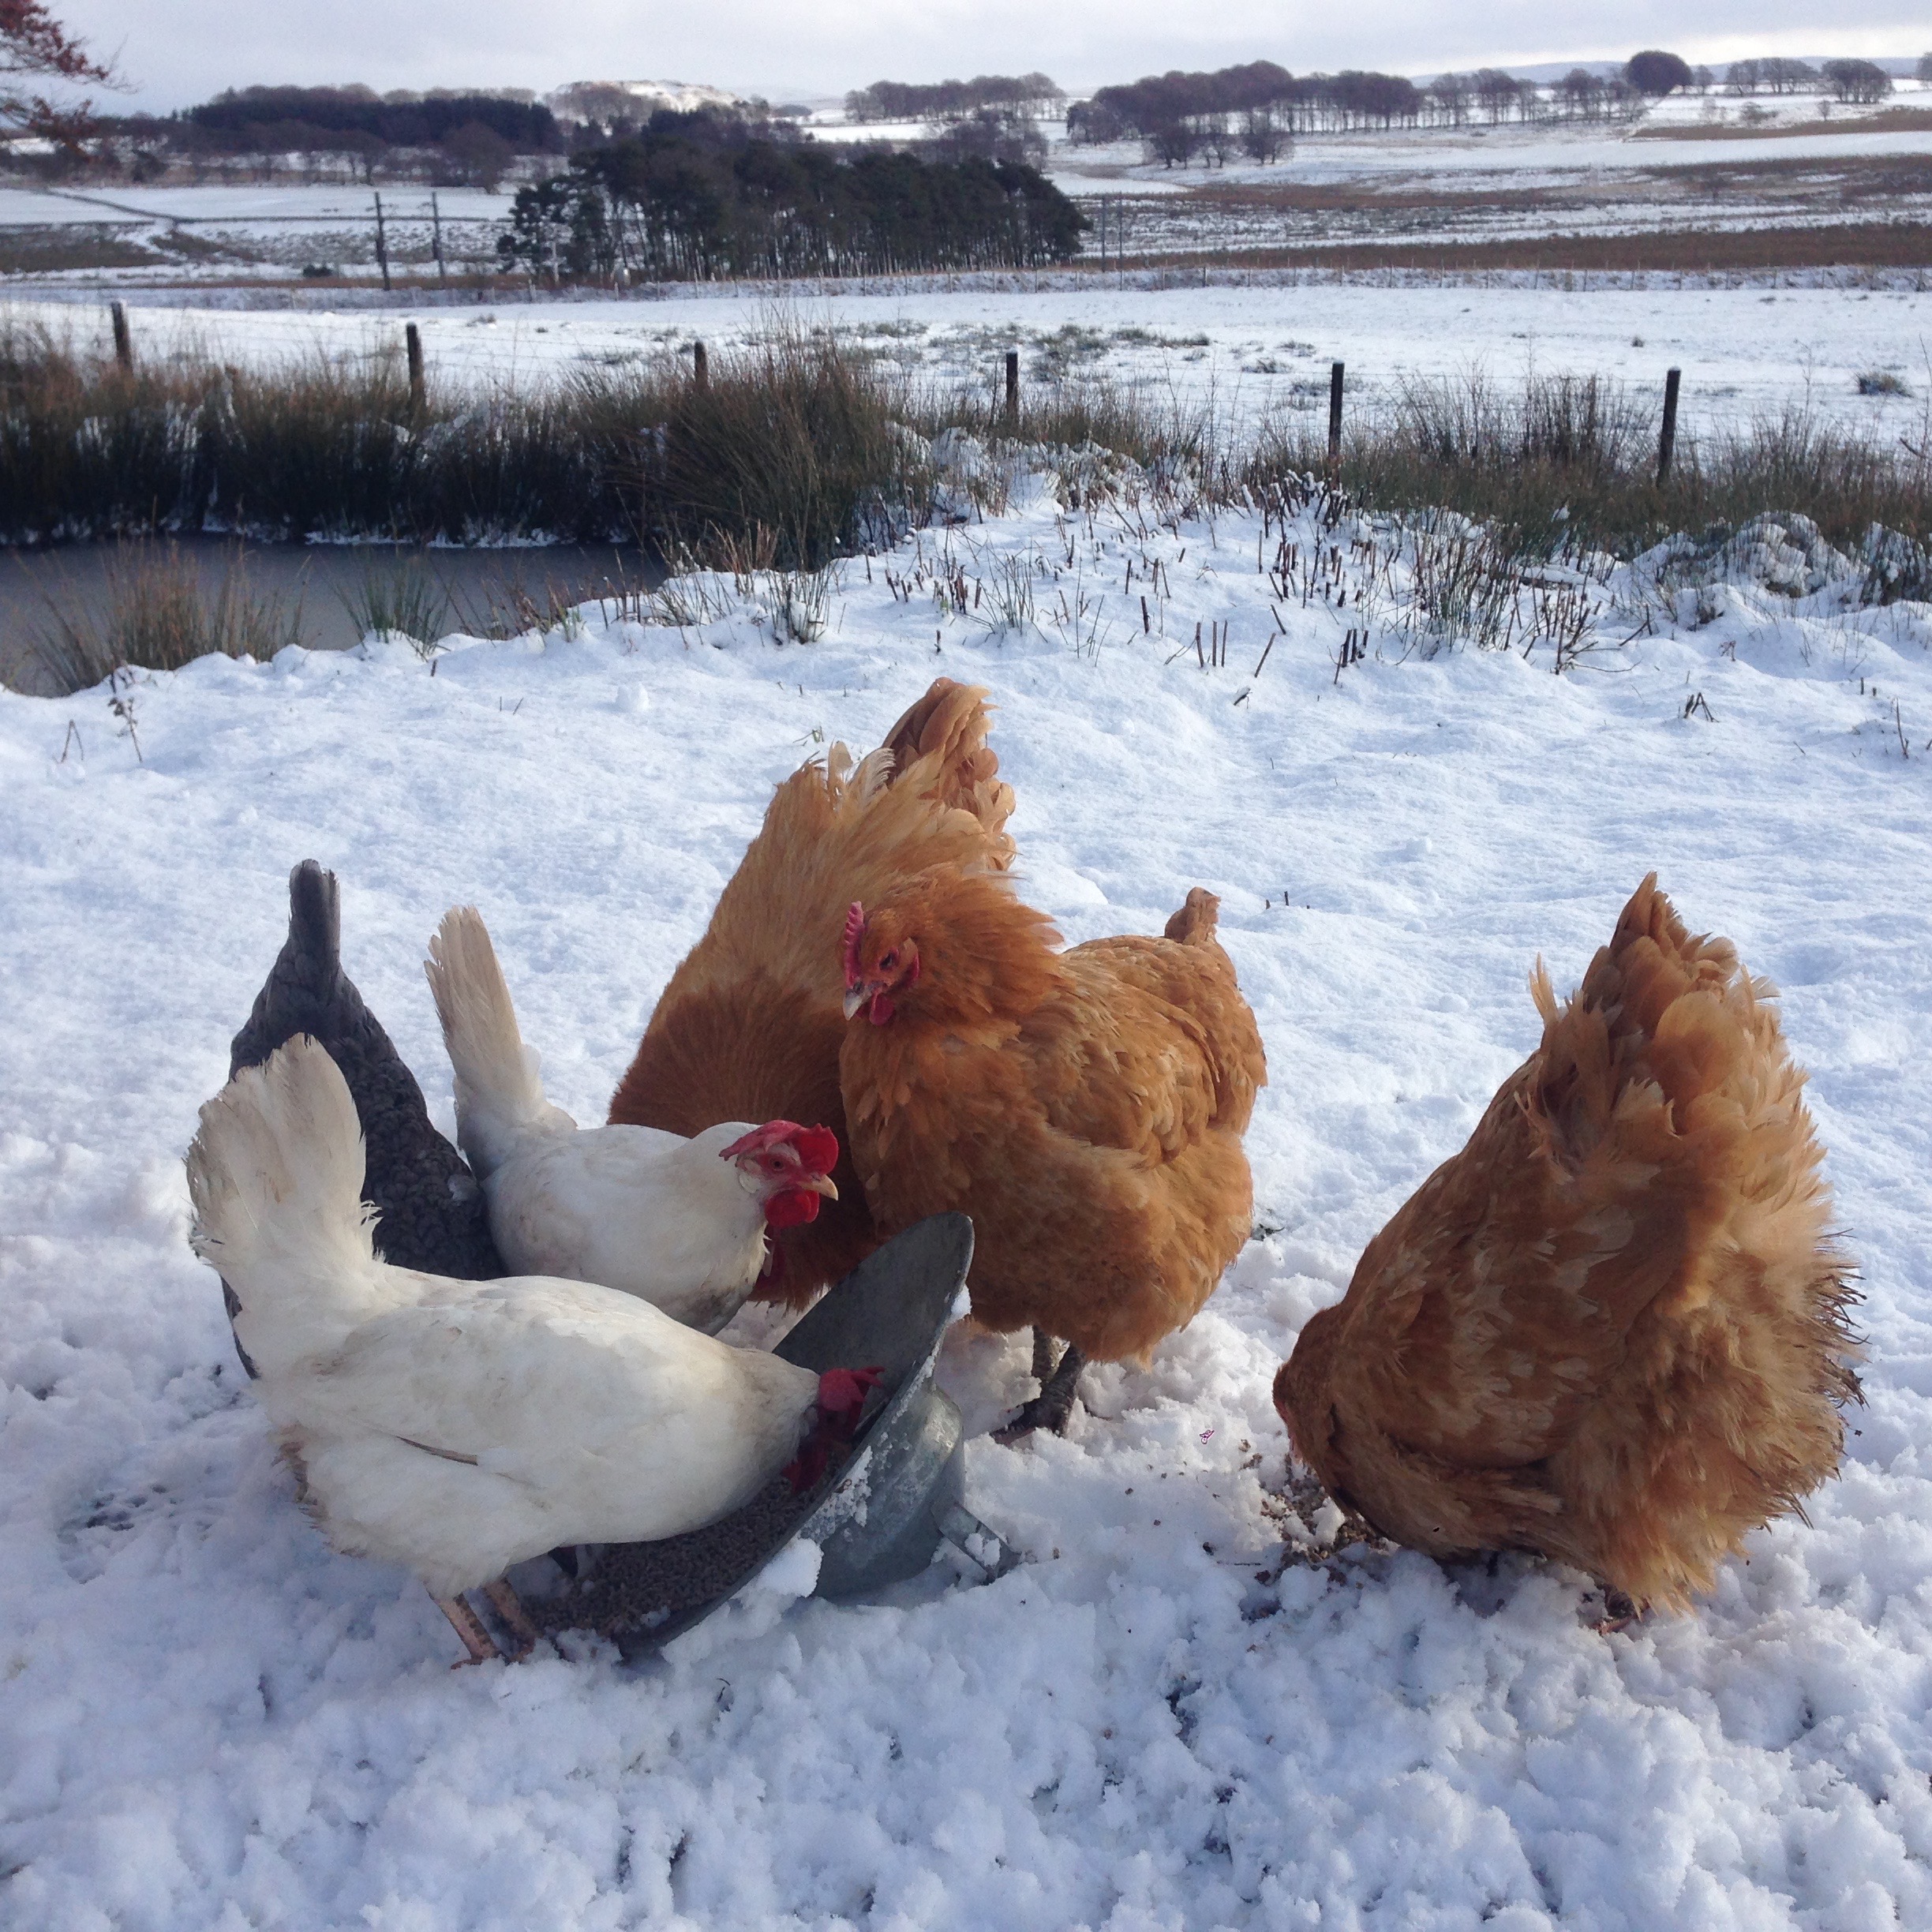
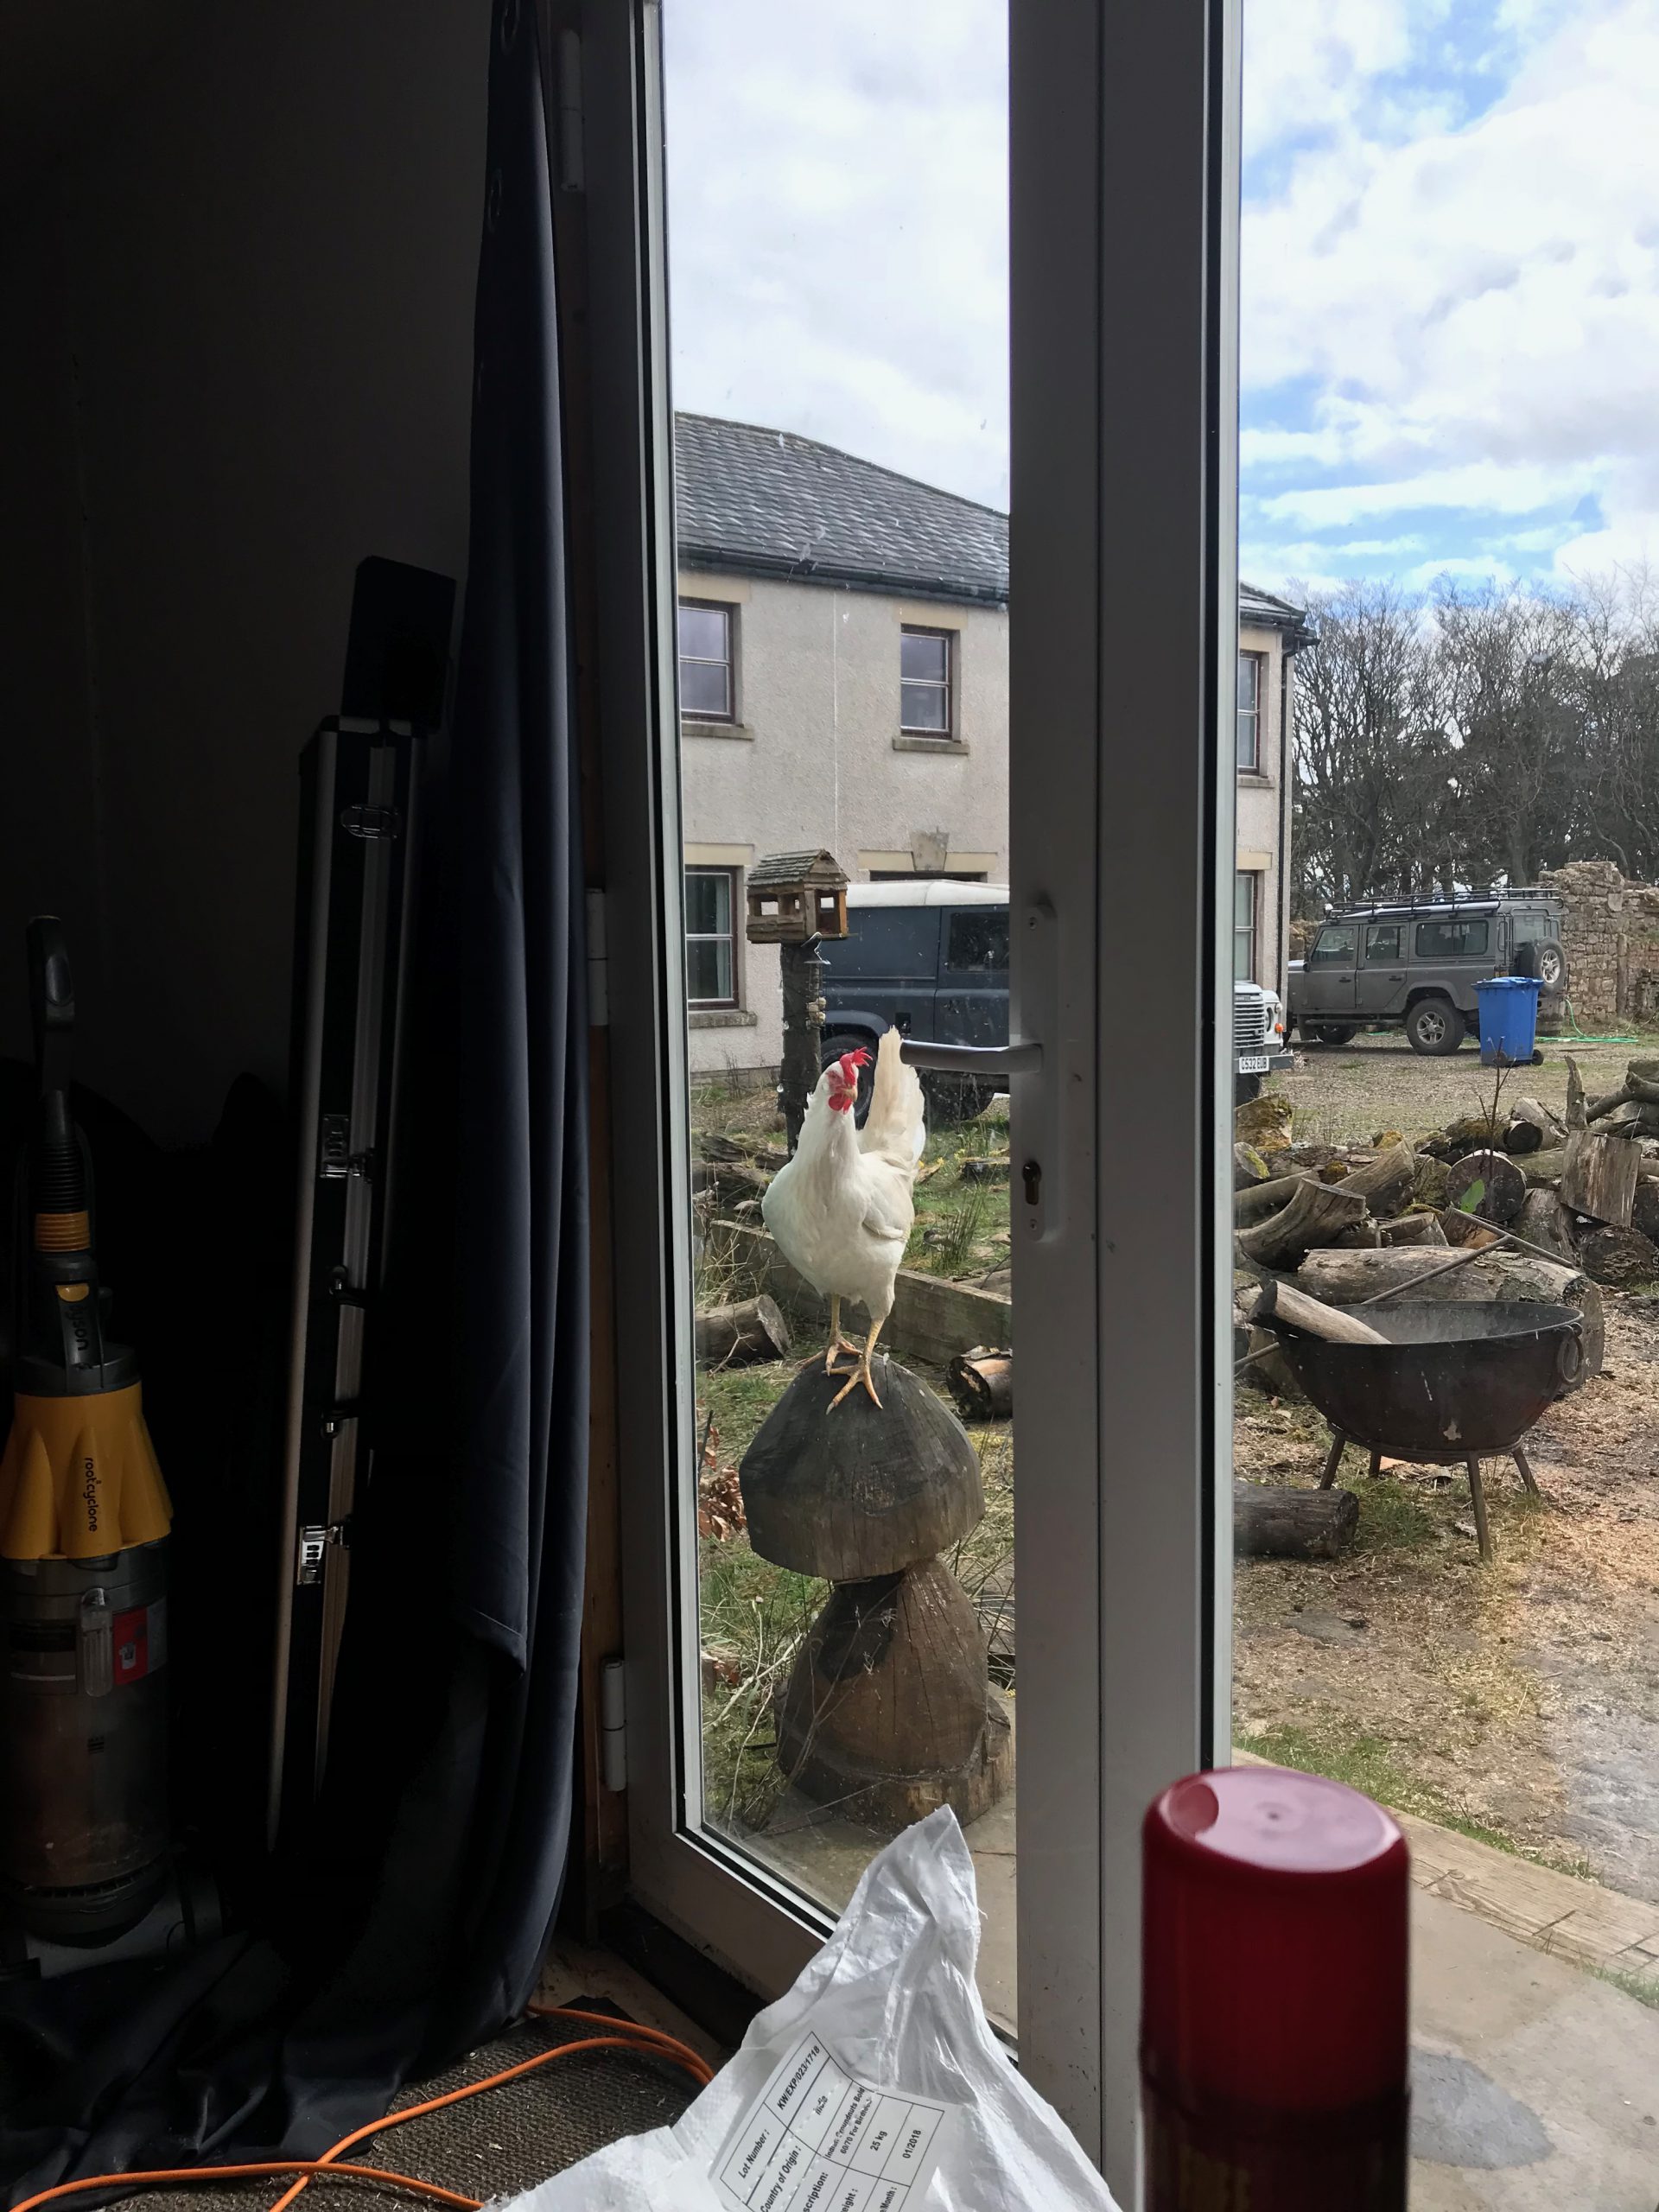
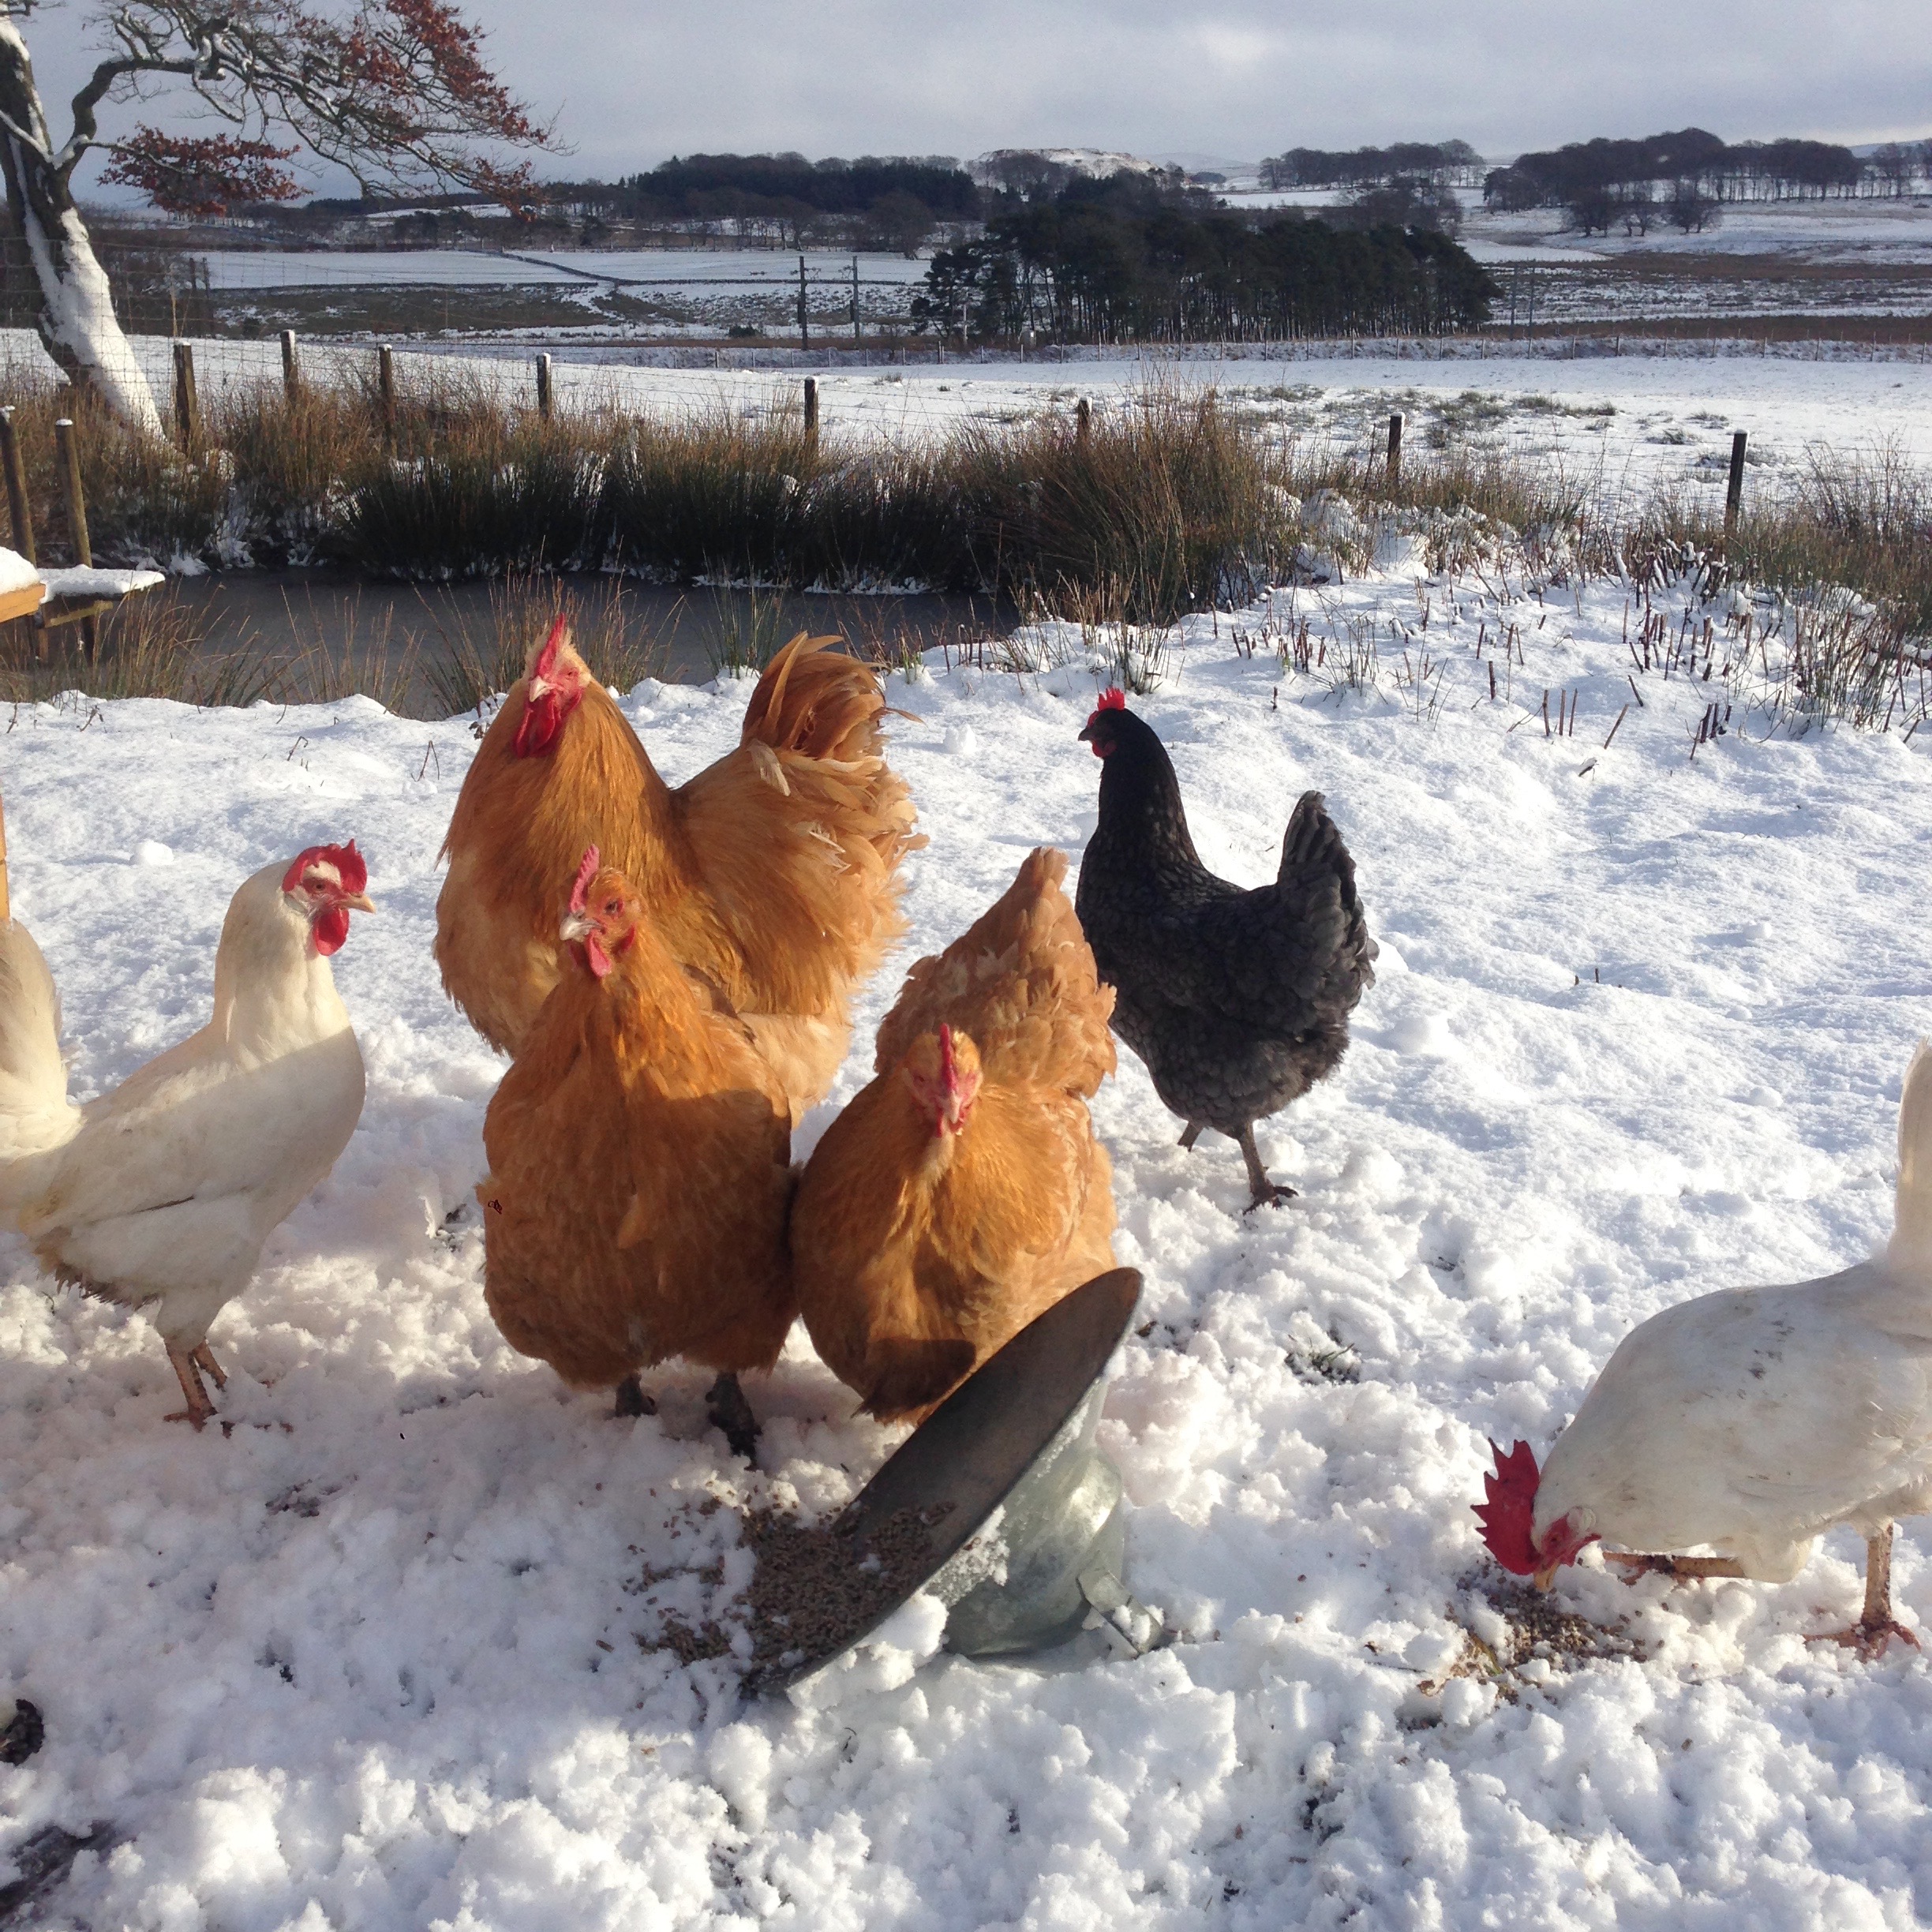
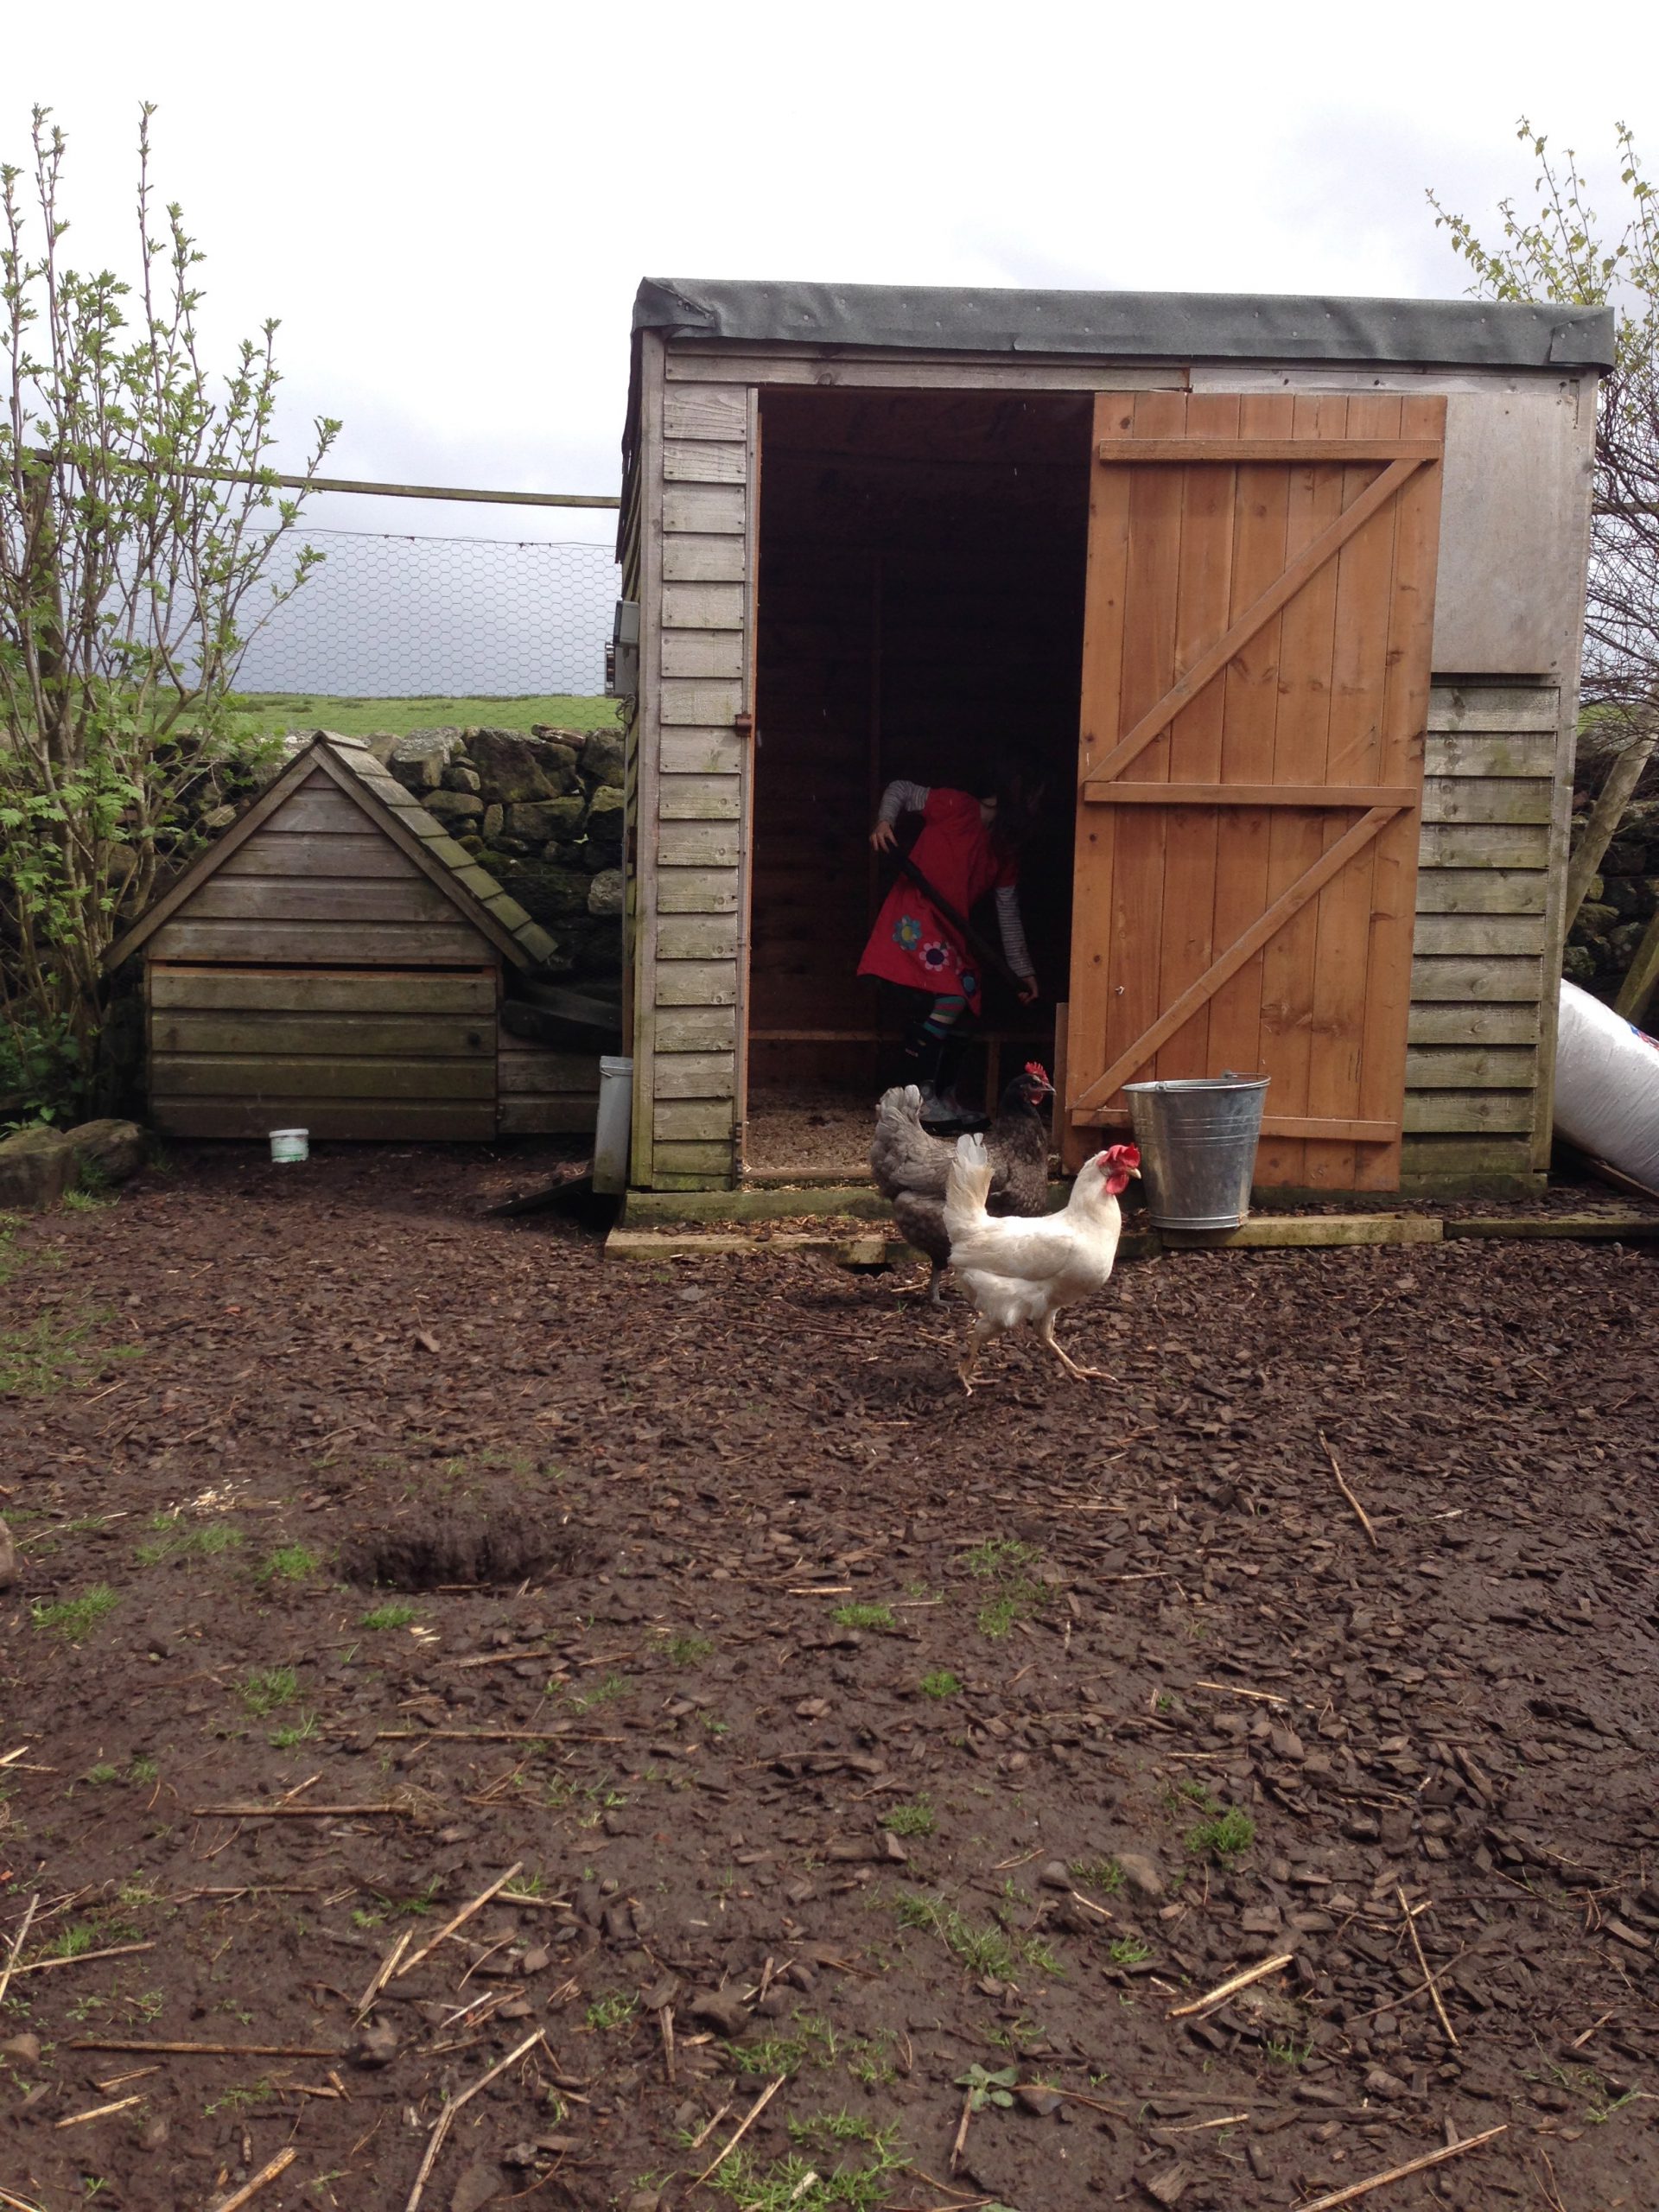
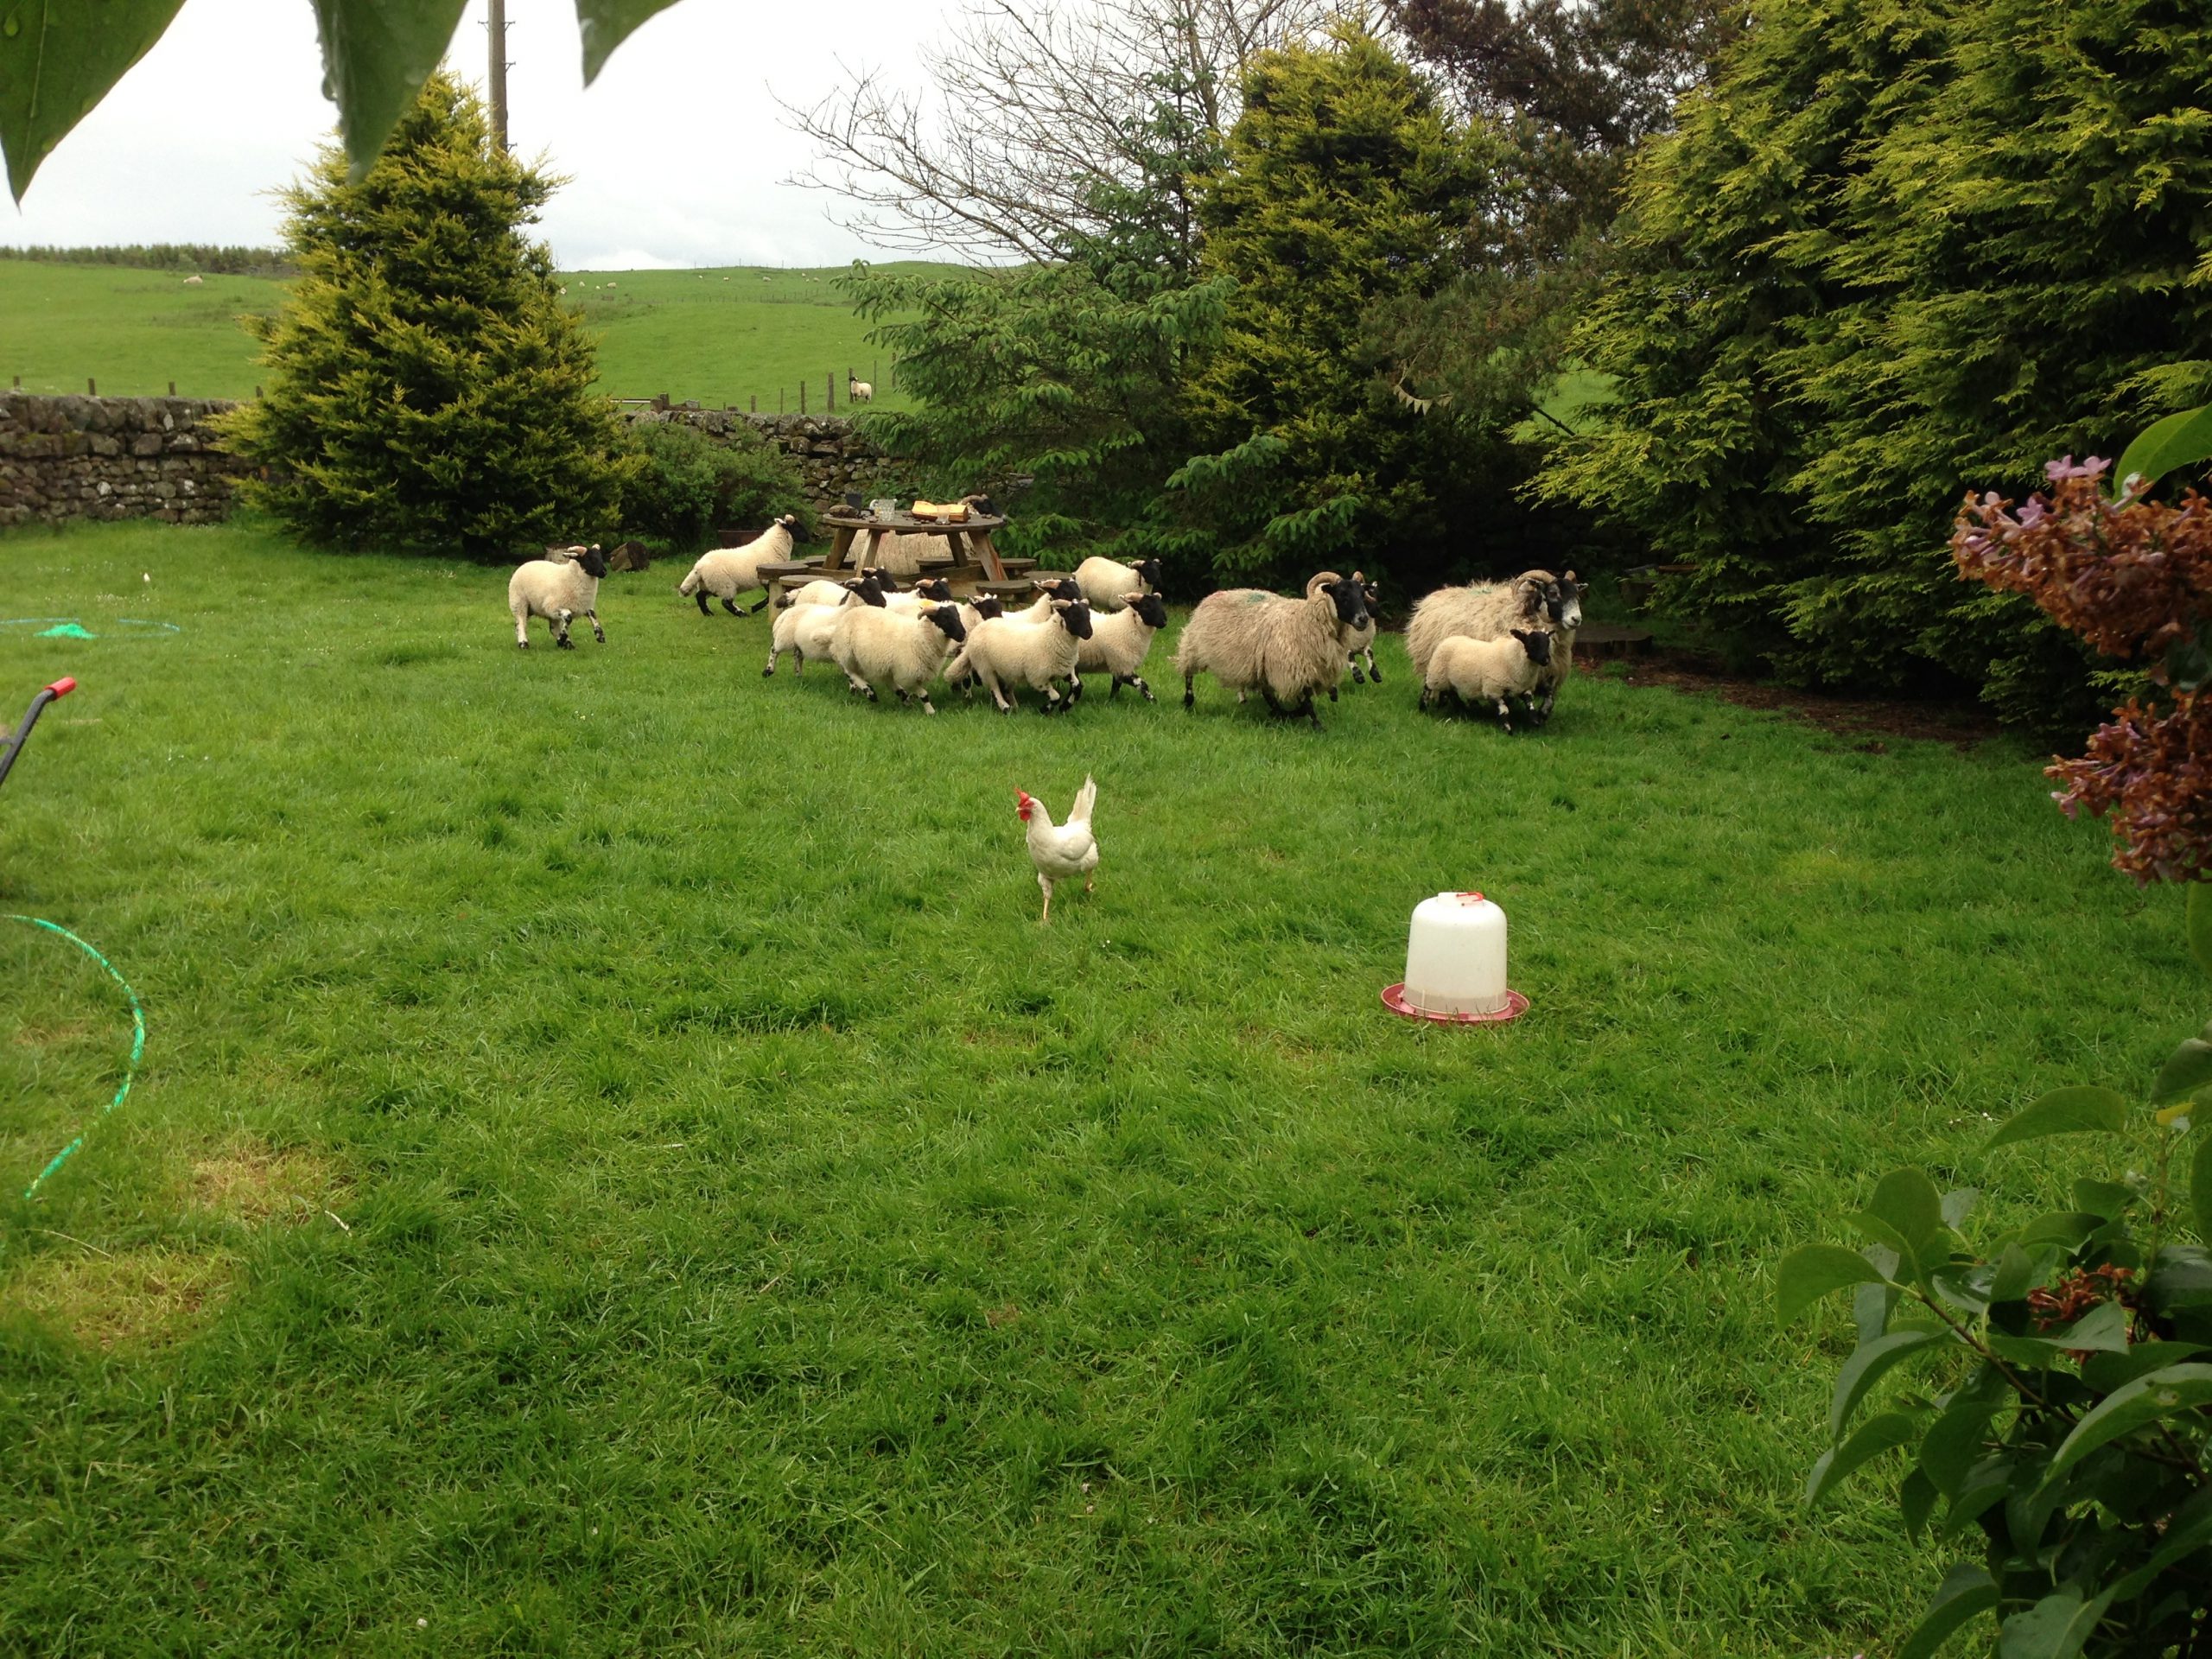
We had this awesome chicken for about 6 or 7 years, she was an amazing character, always stood out from the flock and did her own thing. She insisted on getting involved whenever I was doing anything outside, and used to run about 100m to greet me at the gate whenever I came home.
This post looks at creating and maintaining HTTPS/SSL/TLS Certificates for multiple WordPress sites running on the same host.
Some background…
This website is one of several different domains/sites/blogs hosted on my single Google Cloud server, with one public IP address shared for all websites. I’m using WordPress Multisite to do this, based on a very well put together Appliance provided by Bitnami.
WordPress Multisite allows me to cheaply, easily and efficiently serve multiple sites from the one host and IP address, sharing the same host resources (CPU, Mem, Disk) which is great but makes seting up HTTPS/SSL Certificates a little different to the norm – the same cert has to validate multiple sites in multiple domains.
I’d banged my head against this for a while and looked at many different tools and tech (some of which are mentioned below) to try and sort this out previously, but finally settled on the following process which works very well for my situation.
“WordPress is the world’s most popular blogging and content management platform. With WordPress Multisite, conserve resources by managing multiple blogs and websites from the same server and interface.”
CERT PROVIDER
Let’s Encrypt is a free, automated, and open Certificate Authority created by the Linux Foundation in collaboration with the Internet Security Research Group. There are many other certificate providers available, but I’m using this one.
Once lego is set up, you can request multiple certs like this – just make sure to change the --domains="whatever" entries and add as many as you need. Remember all of your sub domains (www. etc) too.
sudo lego --tls --email="my@email.com"--domains="donaldsimpson.co.uk" --domains="www.donaldsimpson.co.uk" --domains="www.someothersite.com" --domains="someothersite.com" --path="/etc/lego" run
Noe you’ve got the certs, move them in to place and chmod them etc:
By this point I was happy that the nice new HTTPS certs were finally working reliably for all of my sites, but was aware that Google and external links would still try to get in through HTTP URLs.
After trying a few WordPress plugins that sounded like they should correct this neatly for me, I settled on JSM’s Force SSL/HTTPS plugin. As the name suggested, it quickly and easily redirects all incoming HTTP requests to HTTPS. It was simple to install and setup and works very well with WordPress Multisite too – thanks very much JSM!
CRONJOB
Now that the process works, the certificates need updated every 90 days which would be a bit of a pain to remember and do, so adding a simple script to a cron job saves some hassle.
Helm and Tiller – what they are, when & why you’d maybe use them
Helm and Tiller – prep, install and Helm Charts
Deploying Jenkins via Helm Charts
and WordPress w/MariaDB too
Wrap up
The below are mostly my technical notes from this session, with some added blurb/explanation.
Helm and Tiller – what they are, when & why you’d maybe use them
From the Helm site:
“Helm helps you manage Kubernetes applications — Helm Charts help you define, install, and upgrade even the most complex Kubernetes application. Charts are easy to create, version, share, and publish — so start using Helm and stop the copy-and-paste.”
Helm is basically a package manager for Kubernetes applications. You can choose from a large list of Stable (or not so!) ready made packages and use the Helm Charts to quickly and easily deploy them to your own Kubernetes Cluster.
This makes light work of some very complex deployment tasks, and it’s also possible to extend these ready-made charts to suit your needs, and to write your own Charts from scratch, or pass your own values to override default ones, or… many other interesting options!
For this session we are looking at installing Helm, reviewing some example Helm Charts and deploying a few “vanilla” ones to the cluster we created in the first half of the session. We also touch upon the life-cycle of Helm Charts – it’s similar to dockers – and point out some of the ways this could be extended and customised to suit your needs – more on this at a later date hopefully.
Helm and Tiller – prep, install and Helm Charts
First, installing Helm – it’s as easy as this, run on your laptop/host that’s running the Minikube k8s we setup earlier:
Tiller is the client part of Helm and is deployed inside your k8s cluster. It’s set to be removed with the release of Helm 3, but the basic functionality wont really change. More details here https://helm.sh/blog/helm-3-preview-pt1/
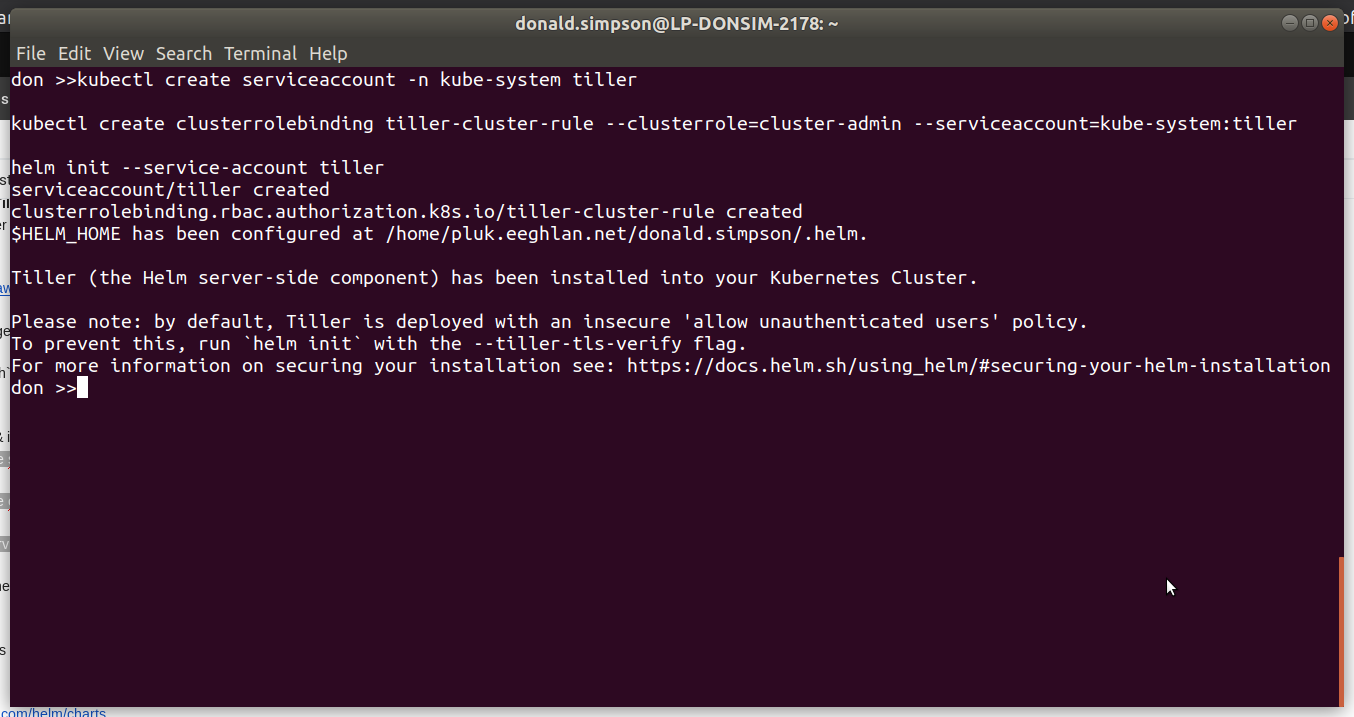
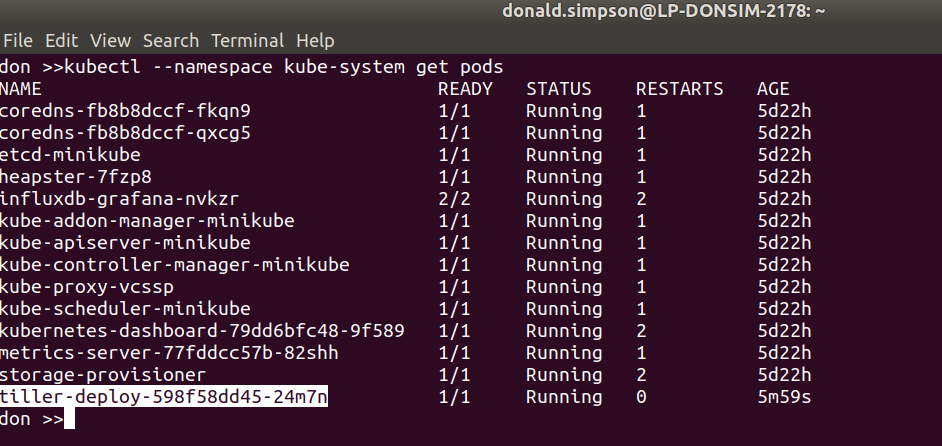
Next we do the Tiller prep & install – add RBAC for tiller, deploy via helm and take a look at the running pods:
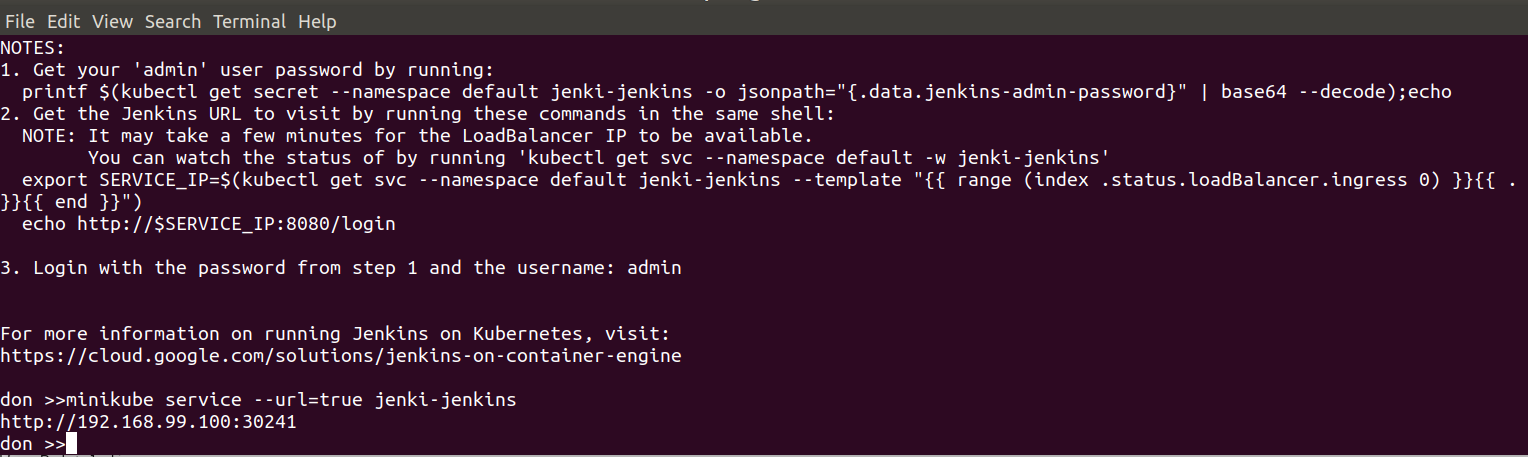
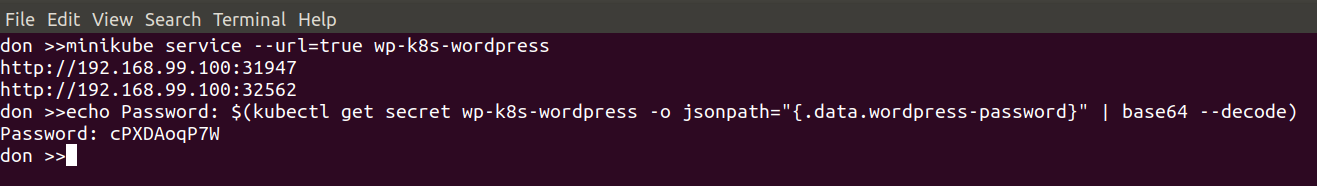
now get the URL for the Jenkins service from Minikube:
minikube service --url=true jenki-jenkins
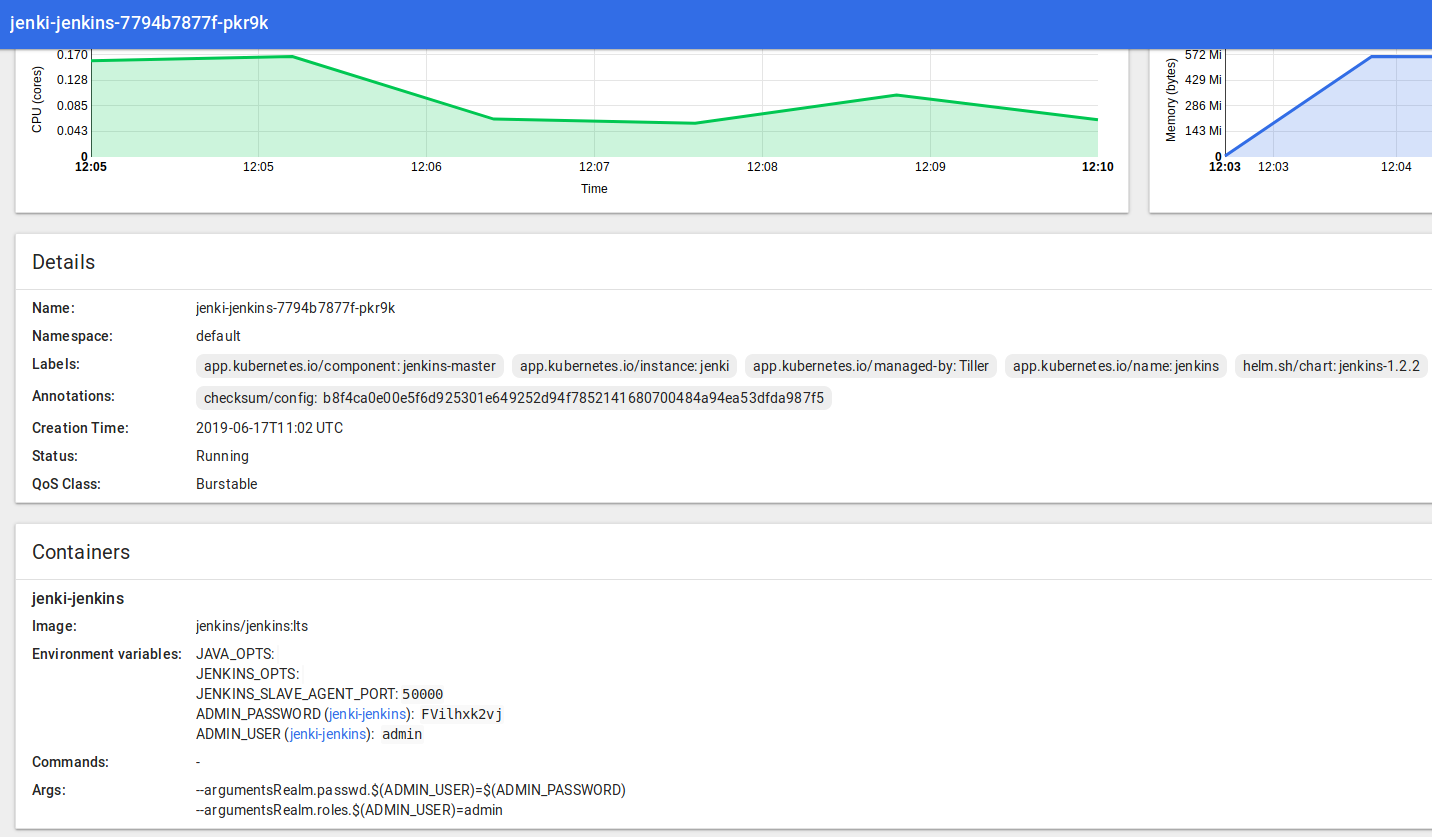
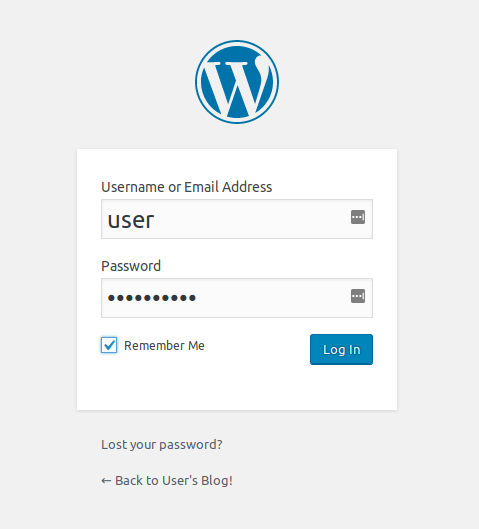
Hit that URL in your browser, and grab the password in UI from Pods > Jenki and log in to Jenkins with the user “admin”:
That’s a Jenkins instance deployed via Helm and Tiller and a Helm Chart to our Kubernetes Cluster running inside Minikube via a VirtualBox VM… all done in a few minutes. And it’s all customisable, repeatable, highly scaleable and awesome.
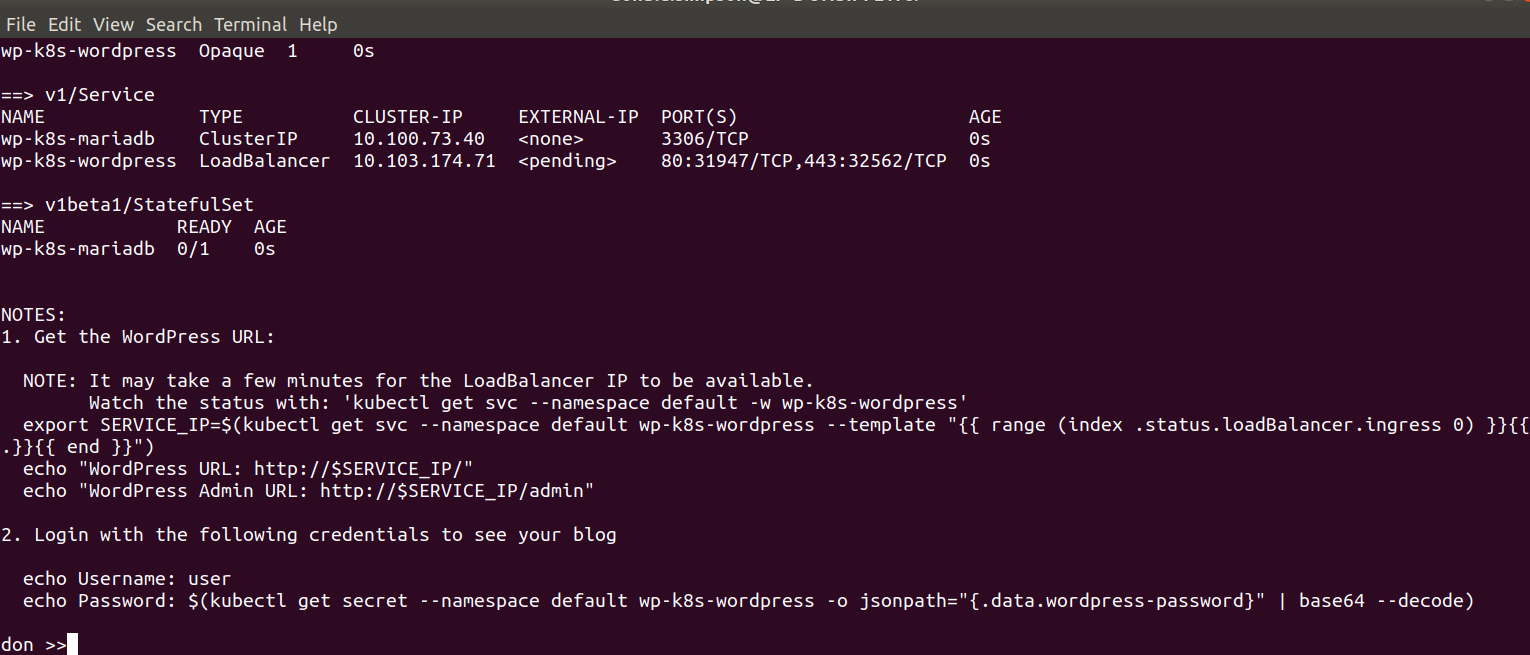
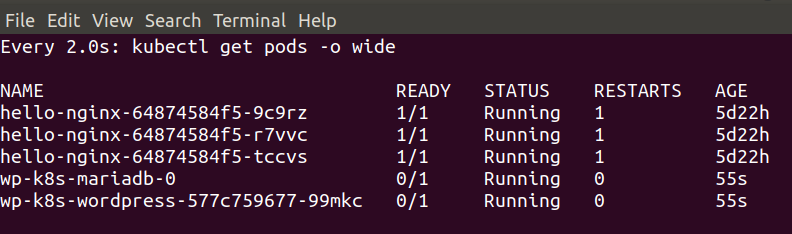
and WordPress w/MariaDB too
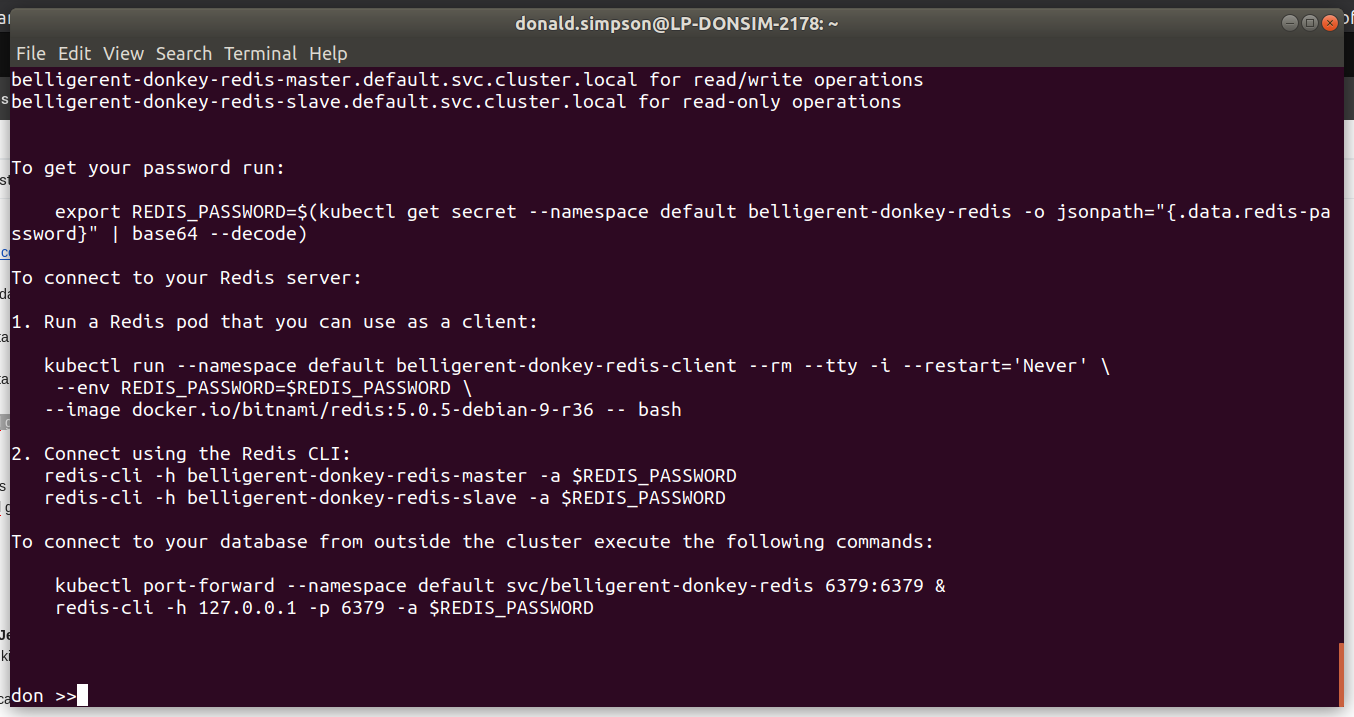
This was the “bonus demo” if my laptop wasn’t on fire – and thanks to some rapid cleaning up it managed fine – showing how quickly we could deploy a functional WordPress with MariaDB backend to our k8s cluster using the Helm Chart.
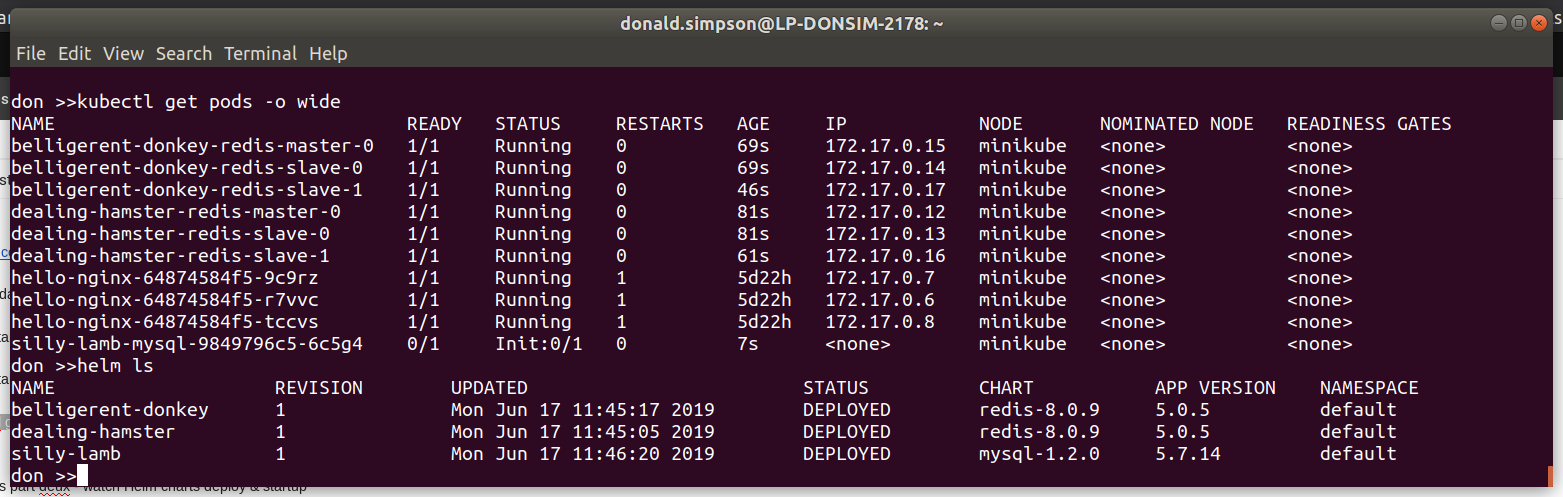
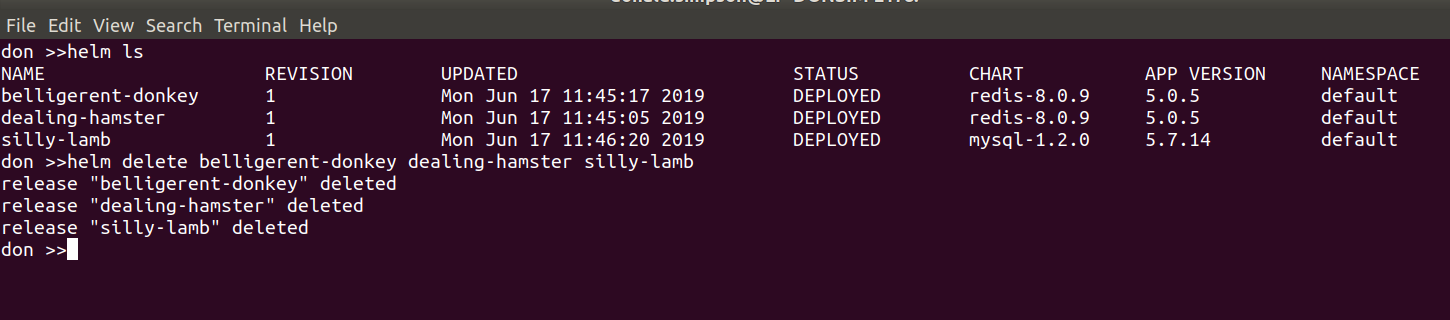
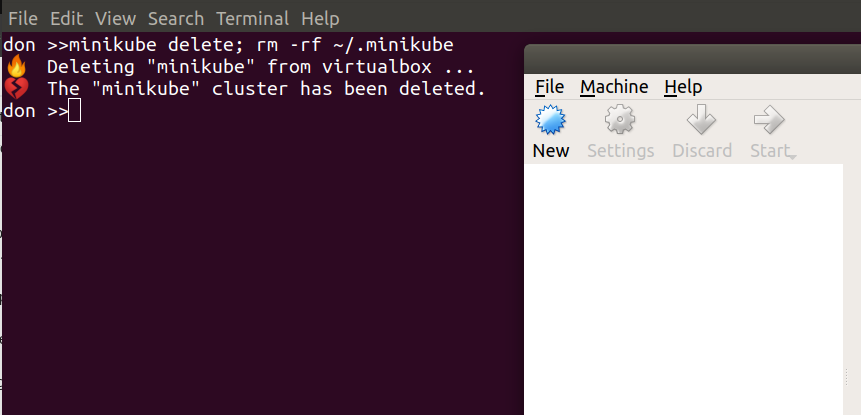
To prepare for this I did a helm ls to see all the things I had running. then helm delete --purge jenki, gave it a while to recover then had to do
kubectl delete pods <jenkinpod>
before starting the WordPress Chart deployment with
That’s it – we covered a lot in this session, and plan to use this as a platform to explore Helm in more detail later, writing our own Helm Charts and providing our own customisations to them.
Update: this follow-on post runs through setting up Jenkins with Helm then creating Jenkins Pipelines that dynamically provision dockerised Jenkins Agents:
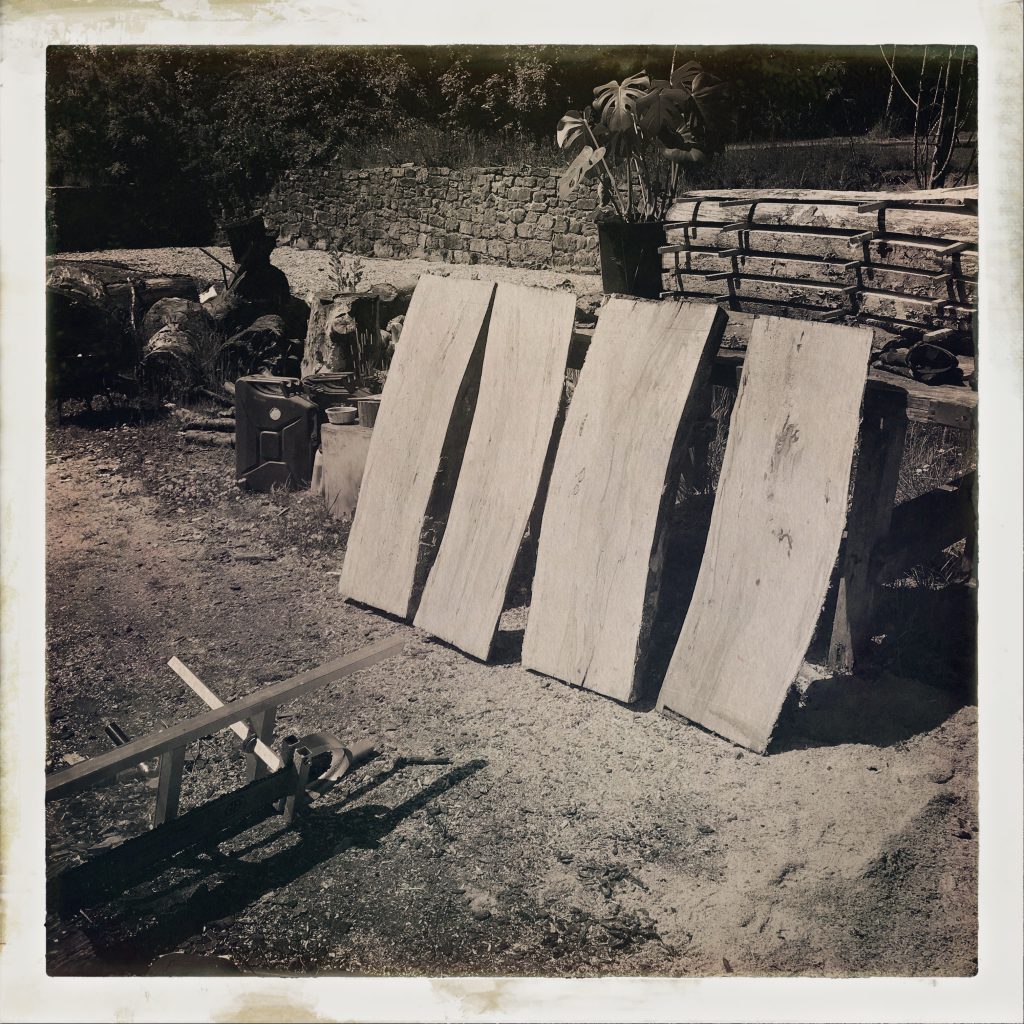
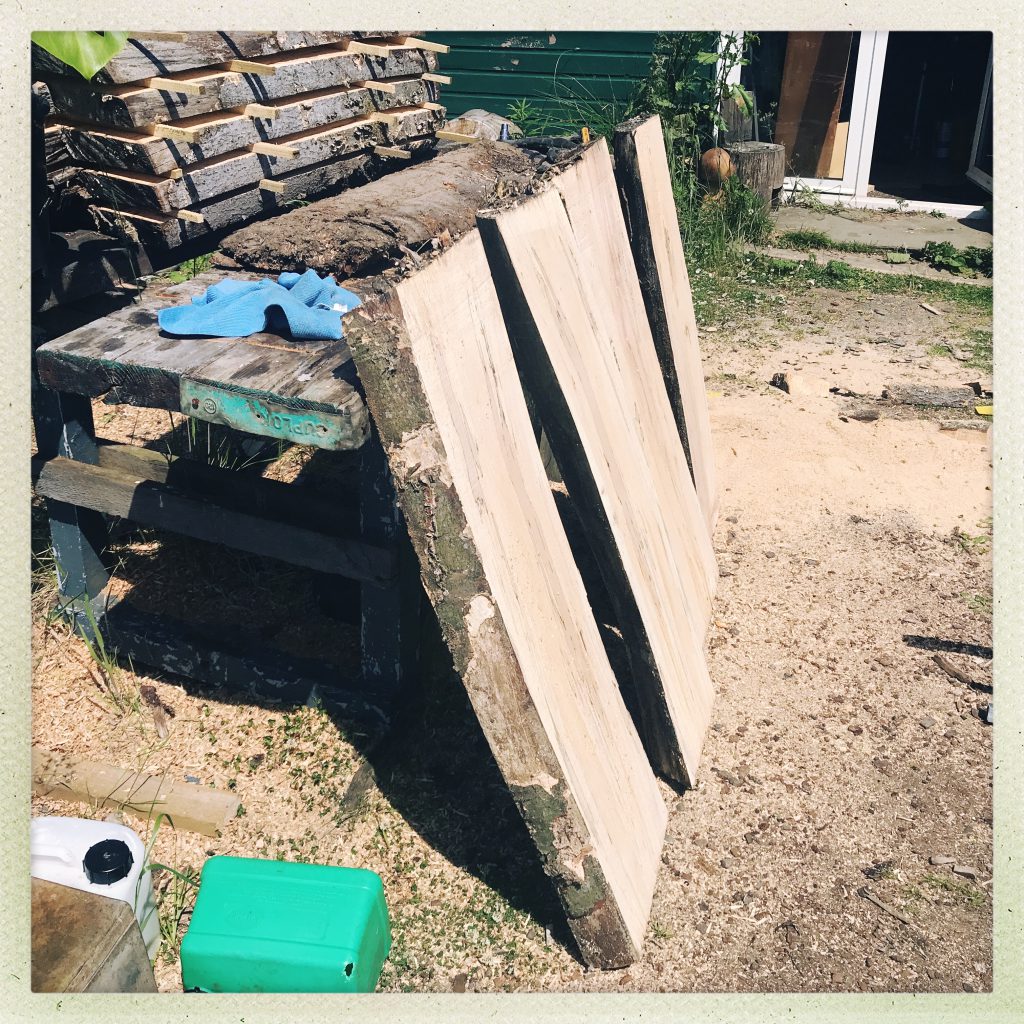
Here are some pics and updates on my recent attempts at milling my own wood. This had been on my wood-related TODO list for a long time. The aim was to free up some room in my woodpile by creating planks that I can then try and make things out of – and to have some fun doing so.
All of the wood is local beech, I’m using up old trunks first but plan to do some green milling later, including milling another fallen tree with a nice straight trunk “in situ” then bringing the planks home to dry.
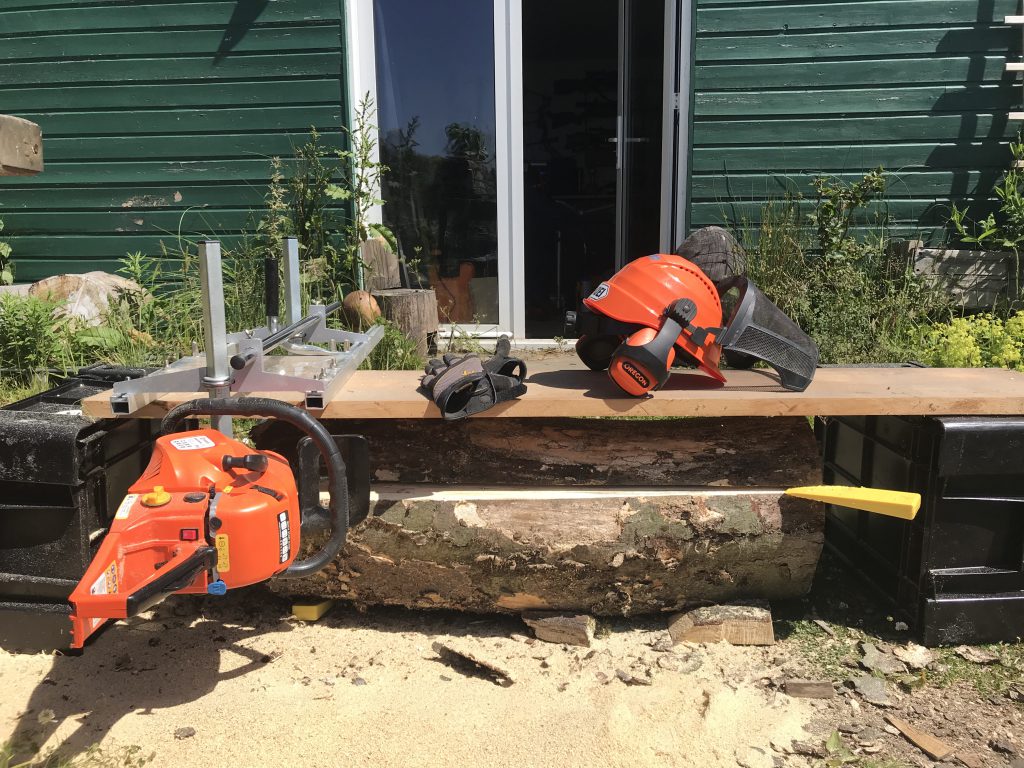
Tools & Setup
Chainsaw: you need a powerful chainsaw for milling, especially if you want to run a long enough bar to mill wider trunks, which I hope to do later. I really really wanted a large Husqvarna or Stihl but the cost for something of the right spec for this job was waaaay over my budget.
Searching for >60cc chainsaws I found this one by Parker:
£80-odd quid for a 62cc Chinese chainsaw with 2 year guarantee and some extras bits ‘n pieces!?! Sounds far too good to be true, but further reading led me to reviews of similar cheap gear being used, mostly with good results, and folk referring to it as Chinese Milling, or “Chilling” 🙂
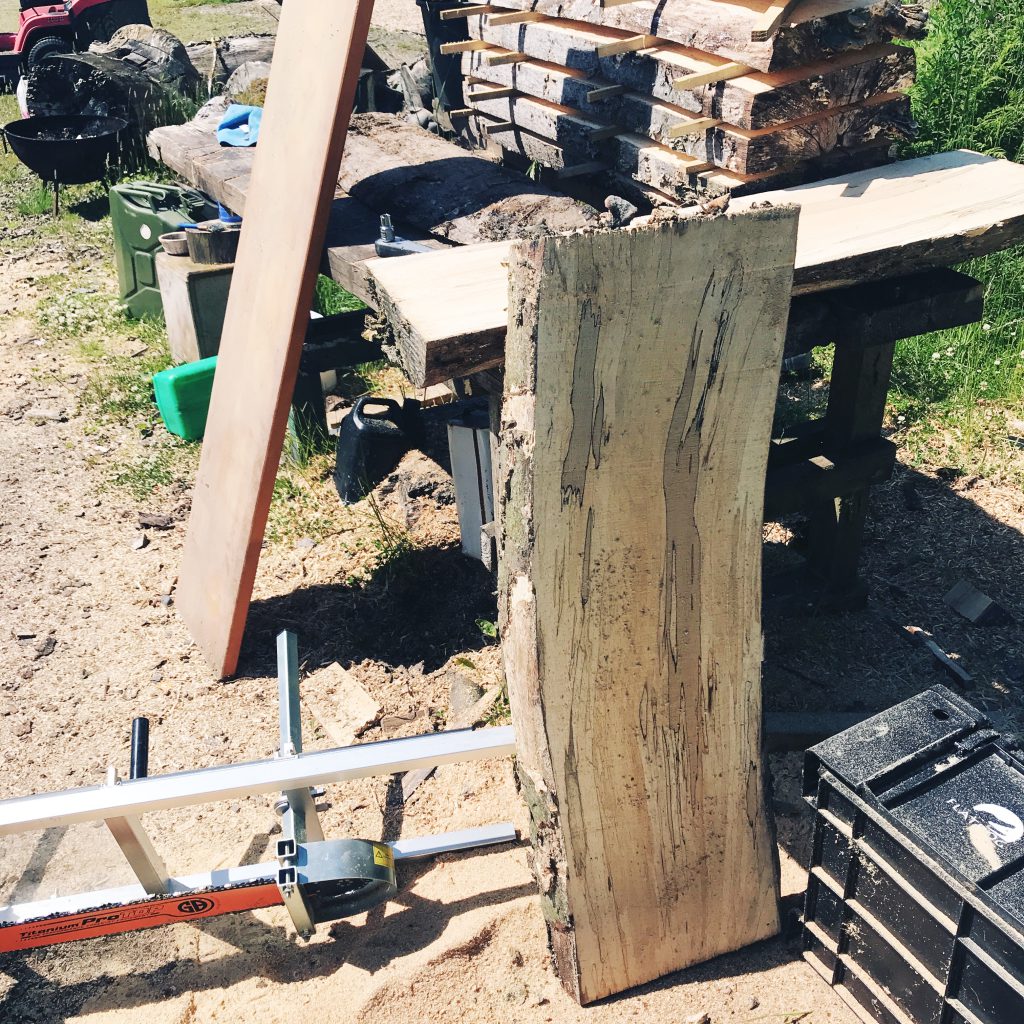
Bar & Chain: the 20″ bar that came with the Parker was ok but too small and the chains were cross-cut. I ordered a 28″ bar and Archer ripping chain from these guys – very happy with the parts and the service:
Pics of the end result – cheapo Chinese saw, 28″ bar, ripping chain and EcoMill together:
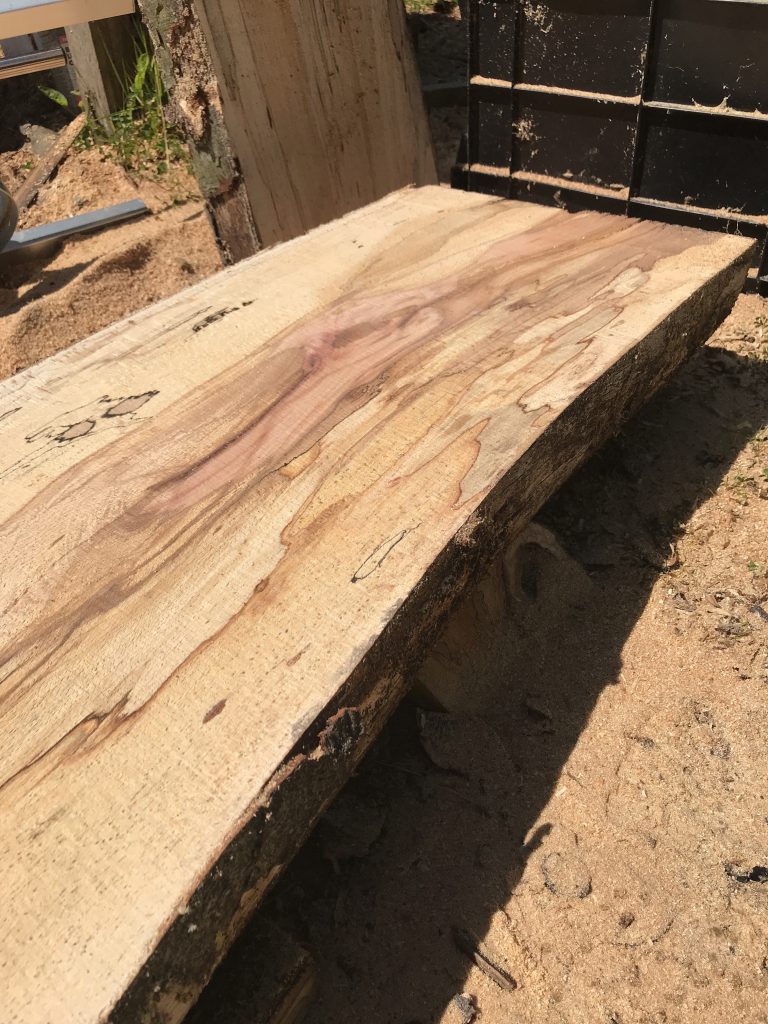
First attempt
The first cut is not only the deepest, but the most important and most difficult too – I tried the old approach of screwing a straight plank to the top of the log, then running the saw/mill over this to give me a flat initial cut.
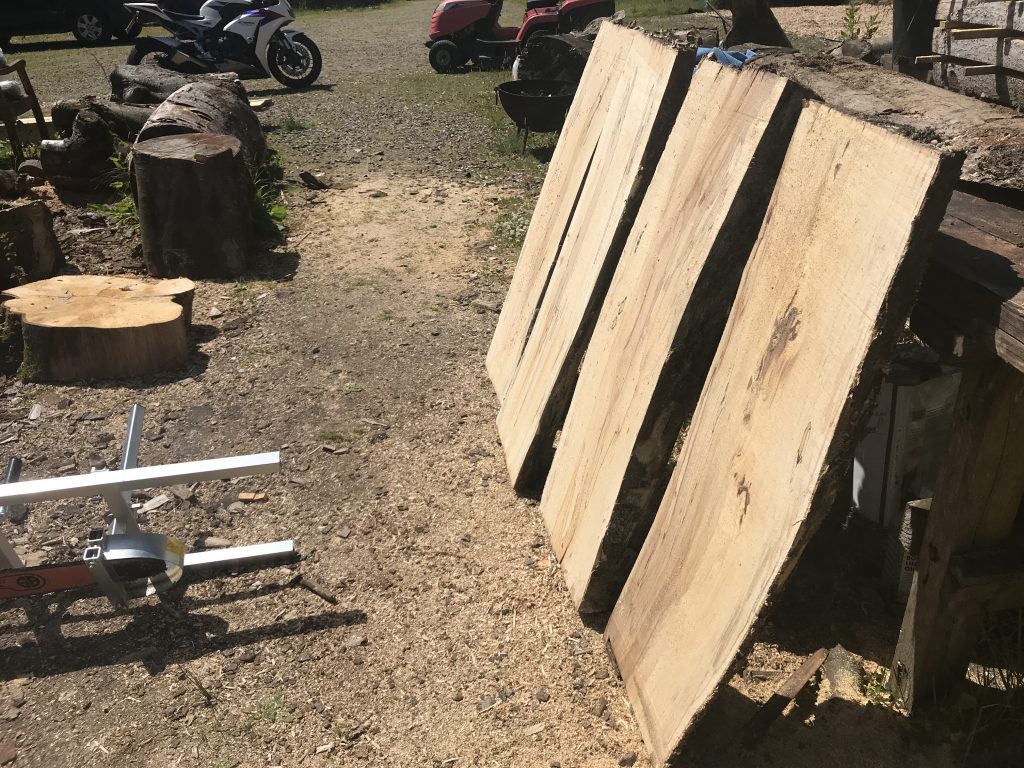
It went ok, but I think the log rolled a little towards the end – it was only small so easy done. This means that all subsequent cuts follow the same slight curve – the planks are still ok, but a lesson learned. These planks are narrow enough to run through my planer/thicknesser later anyway.
The waste/kerf from the ripping chain is noticeably smaller (narrower) and much finer than with a cross-cut chain. The saw runs surprisingly well and starts really easily. It makes a fair bit of noise but for the money it’s superb. I didn’t try to rush or force the cut, pretty much let the chain pull itself through, and I am very happy with the results.
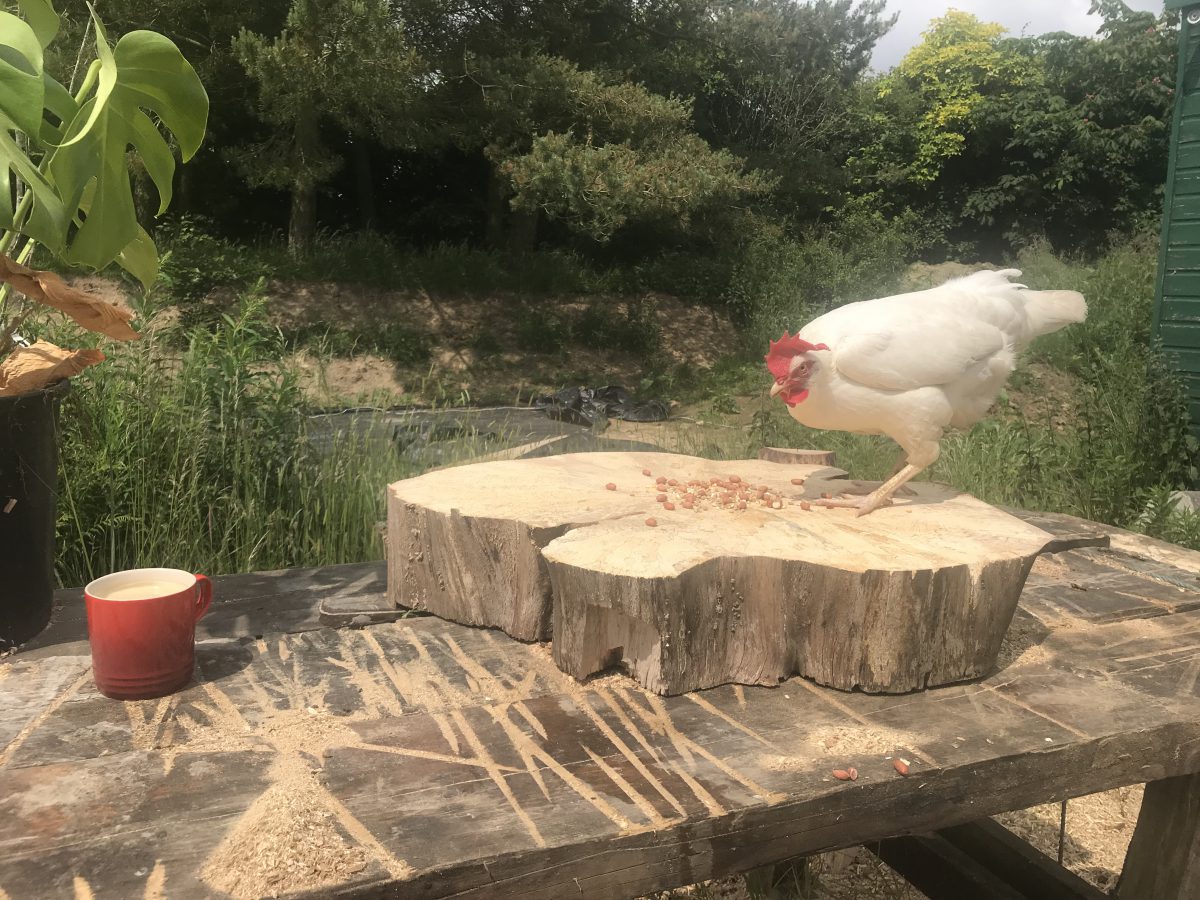
Pics of the first small-scale test – the chicken was grudgingly impressed.
“Not too bad… for a first attempt.”
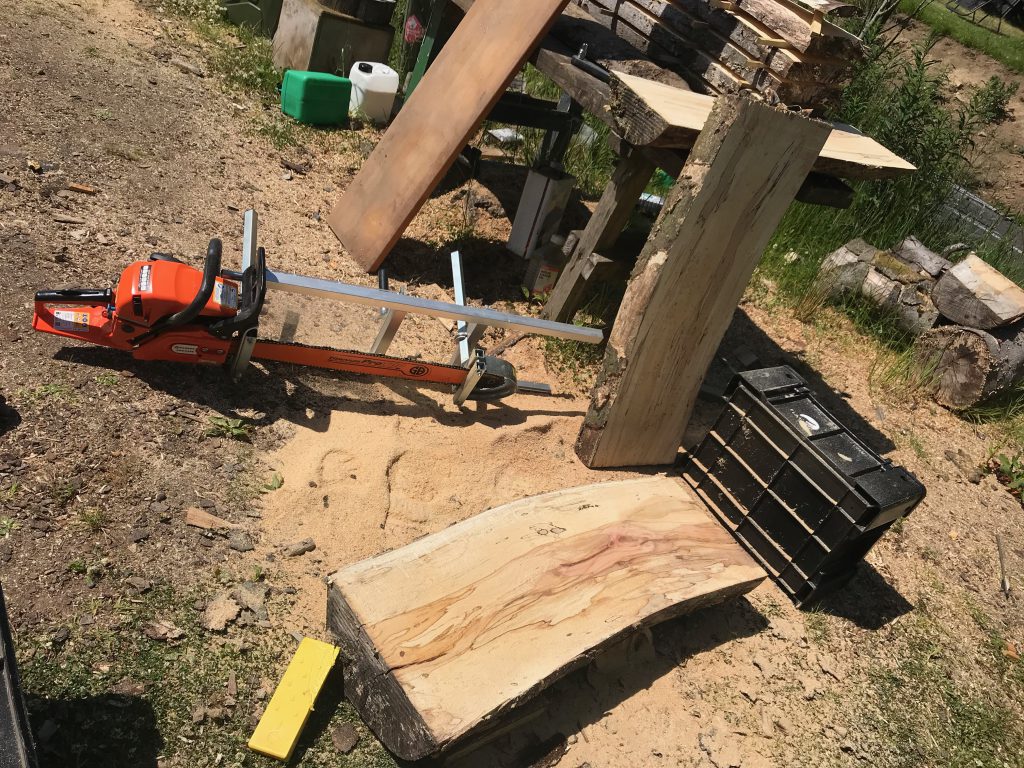
Second attempt
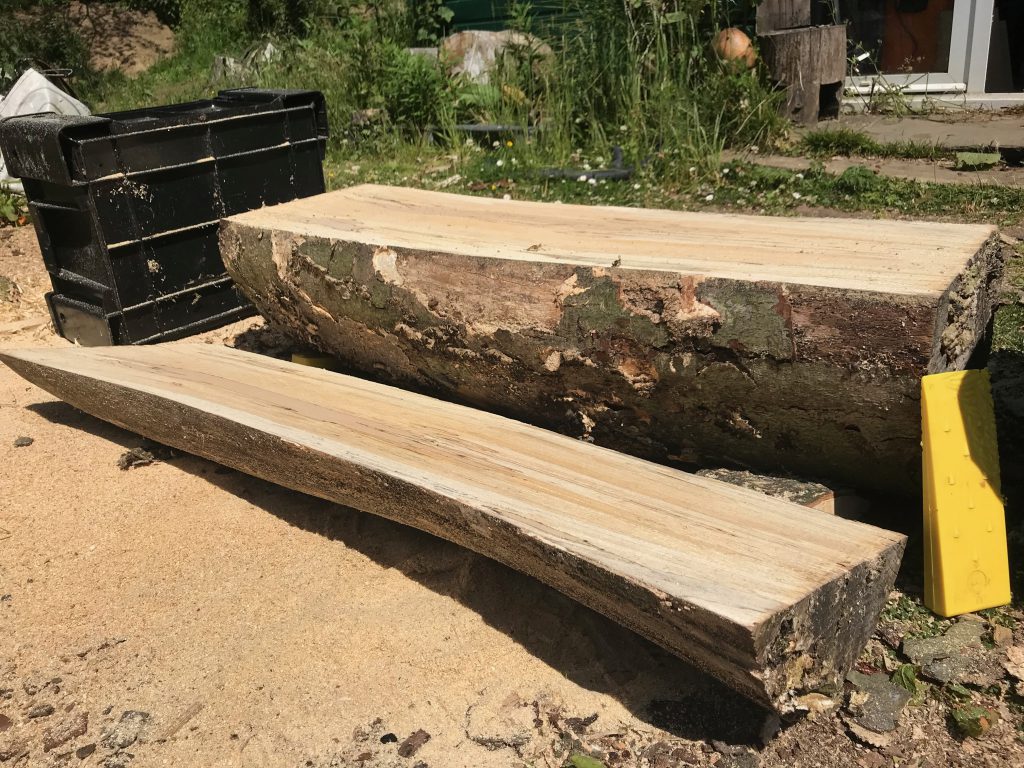
This time I tried using a bigger plank sitting on a crate at either end for the first cut, with the log sitting unattached underneath but secured with a load of wedges to stop it rolling/moving. This took longer to set up but worked much better.
First cut setup
Just cut…
Flattening Sled/Jig
Here are pics of a similar-ish setup I use to flatten large slabs. It’s a “jig” made from a couple of clamped planks (from my daughters old bed), with a “sled” made from a couple of 30mm angle iron sections joined together with Gorilla Tape & wooden blocks to keep it the right width and stop it coming off the rails. All of this keeps the router level while I run it from side to side, moving the sled up and down the jig to flatten the wood.
The router bit is a “1/2-Inch Shank 2-Inch Cutting Diameter Double Flute Carbide Tipped Cleaning Bottom Router Bit Cutter“… so there you go. It’s now done quite a lot of work and still cuts quickly and easily.
This setup is very versatile – I used it to create these too: