Kubernetes – with Minikube and Helm – part 1

Intro:

This is the first of two posts on Kubernetes and Helm Charts, focusing on setting up a local development environment for Kubernetes using Minikube, then exploring Helm for package management and quickly and easily deploying several applications to the cluster – NGINX, Jenkins, WordPress with a MariaDB backend, MySQL and Redis.

The content is taken from the practical/demo session I wrote and published in Github here:

https://github.com/AutomatedIT/presentations/blob/master/minikube_demo.md

for this Meetup session we ran in Edinburgh in June 2019:

“Kubernetes – getting started with Minikube, Helm and Tiller” https://www.meetup.com/Automated-IT-Solutions/events/261623765/

<ramble>

One of the key objectives and challenges here was getting a useful local Kubernetes environment up and running as quickly and easily as possible for as wide an audience as we could- there’s so much to the Kubernetes ecosystem that it’s very easy to get side-tracked, and we could have (happily) spent a long time discussing the myriad of alternative possible solutions.

We plan to go “deeper” on all of this in future sessions and have an in-depth Helm session in the works, but for this session we were focused on creating a practical starting point.

</ramble>

Don

What is covered here:

  • Minikube – what it is (& isn’t) & why you’d use it (or not)
  • Kubernetes and Minikube components and concepts
  • setup for Mac and Linux
  • creating a first Kubernetes cluster in Minikube
  • minikube addons – what they are and how they can help you
  • minikube docker env – using DOCKER_HOST with minikube VM
  • Kubernetes dashboard with Heapster and Metrics Server – made easy by Minikube
  • kubectl – some examples and alternatives
  • example app – “hello (Kubernetes) world” minikube style with NGINX, scaling your world

and the second post covers:

  • Helm and Tiller – what they are, when & why you’d maybe use them
  • Helm and Tiller – prep, install and Helm Charts
  • Deploying Jenkins via Helm Charts
  • and WordPress w/MariaDB too
  • wrap up

Minikube – what it is (& isn’t) & why you’d use it (or not)


What it is, why you’d use it etc.

Local development of k8s – runs a single node Kubernetes cluster in a Virtual Machine on your laptop/PC.

All about making things easy for local development, it is not a production solution, or even close to it.

There are many other ways to run k8s, they all have their pros and cons and use cases. The slides from the Meetup covered this in more detail and include links for further info – they are available here:

Kubernetes and Minikube components and concepts

The (above) slides also cover this section:
Kubernetes components and concepts
what it solves
how Minikube works


Setup for Mac and Linux

There are three things you need to set up for this, they are:
VirtualBox: https://www.virtualbox.org/wiki/Downloads
Minikube: https://kubernetes.io/docs/tasks/tools/install-minikube/
kubectl: https://kubernetes.io/docs/tasks/tools/install-kubectl/

Using Ubuntu for example:

curl -Lo minikube https://storage.googleapis.com/minikube/releases/v1.1.0/minikube-linux-amd64 && chmod +x minikube && sudo cp minikube /usr/local/bin/ && rm minikube

curl -LO https://storage.googleapis.com/kubernetes-release/release/v1.14.0/bin/linux/amd64/kubectl

`chmod +x ./kubectl

`sudo mv ./kubectl /usr/local/bin/kubectl`

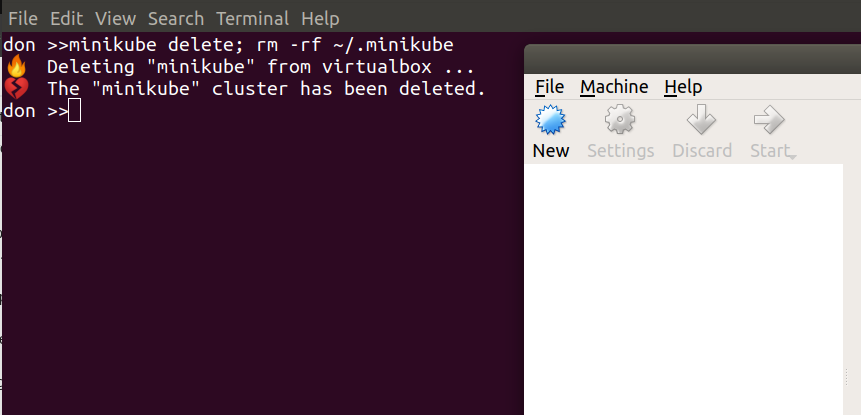
Cleanup/prep – if required, remove any previous cluster & settings

`minikube delete; rm -rf ~/.minikube`

Creating a first Kubernetes cluster in Minikube

Here we create a first Kubernetes cluster with Minikube, then take a look around in & outside of the VM.

With the above initial setup done, it’s as simple as running this in a shell:

minikube start

Note you could optionally give this Cluster a name, if you are likely to have more than one for different branches of development for example. This is also where you could specify the VM provider if you want to use something other than VirtualBox – there are more details here:

https://kubernetes.io/docs/setup/learning-environment/minikube/#starting-a-cluster

This should produce output like the following, and it may well take a few minutes as the VM is downloaded and started, then a stack of Docker images are started up inside that….

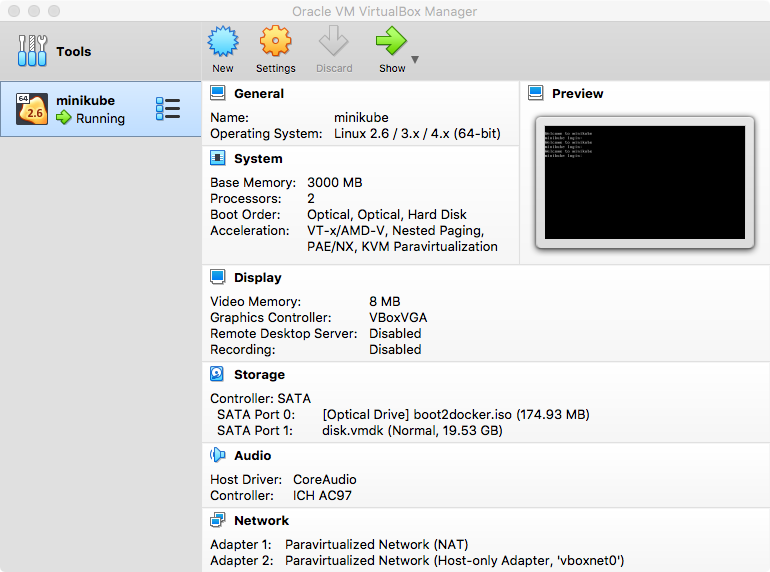
At this point you should be able to see the minikube VM running in the VirtualBox GUI:

Now it’s running, we can connect from our local shell directly to the one inside the running VM by simply issuing:

minikube ssh

This will put you inside the VM where the Kubernetes Cluster is being run, and we can see and interact with the running components, for example:

docker images

should show all of the downloaded images:

and you could do this to see the running containers:

docker ps

Quitting out of the VM puts us back on the local host, where we can use kubectl to query the status of the Minikube cluster – the initial setup has told kubectl about the Minikube-managed Kubernetes Cluster, meaning there’s no other setup required here:

kubectl cluster-info

kubectl get nodes

kubectl describe nodes

minikube addons – what they are and how they can help you

Show some of the ways minkube makes things easier for local dev

First, take a moment to look around these two local folders:

ls -al ~/.minikube; ls -al ~/.kube

These are where Minikube keeps its settings and the VM Image, and where kubectl settings are persisted – and updated by Minikube.

With Minikube you’ve often got the option to either use kubectl directly, or to use some Minikube built-in features to make your life easier.

Addons are one of these features, allowing you to very easily add – or remove – functionality from the cluster like this:

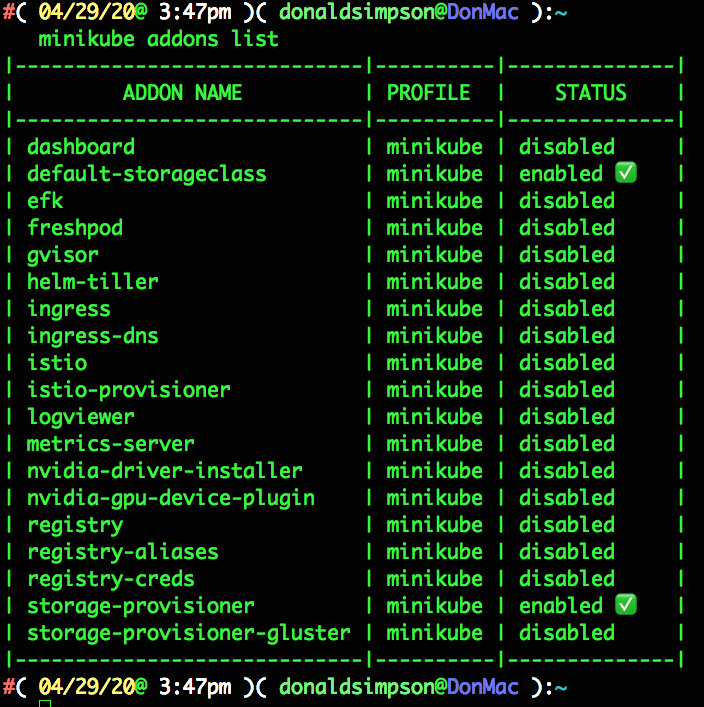
minikube addons list

minikube addons enable heapster

minikube addons enable metrics-server

With those three lines we’ve taken a look at the available addons and their current status, and selected to enable both heapster and the metrics server. This was done to give us cpu and mem stats in the Kubernetes Dashboard, which we will set up in a moment. The output should look something like this:

minikube config view

shows the current state of the config – i.e. what changes have been made, so we can keep a track of them easily.

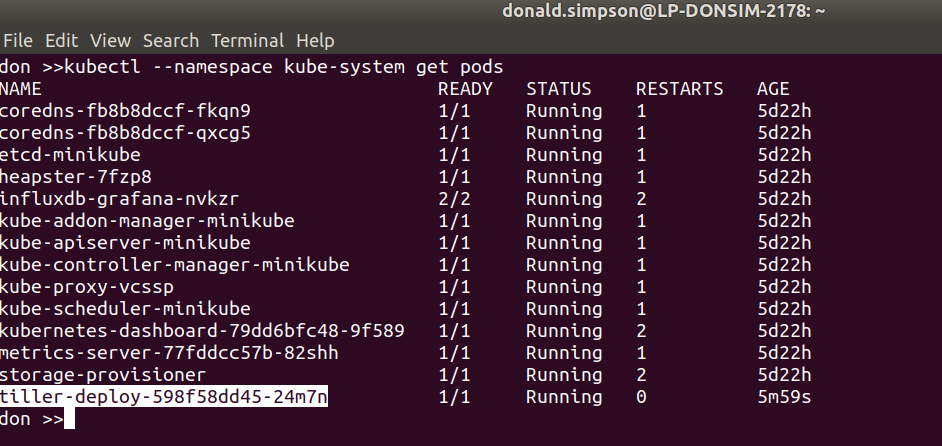
kubectl --namespace kube-system get pods

now we can enable the dashboard:

minikube addons enable dashboard

and check again to see the current state

minikube addons list

we’ll connect to the Dashboard and take a look around in a moment, but first…

minikube docker env – using the DOCKER_HOST in you minikube VM – how & why


Minikube docker-env – setup local docker client to use minikube docker host

We’re going to look at connecting our local docker client to the docker host inside the Minikube VM. This is made easy by:

minikube docker-env

if you run that command on its own it wiull show you what settings it will export and you can set them by doing:

eval ${minikube docker-env}

From then on, in that shell, your local docker commands will use the docker host inside Minikube.

This is very useful for debugging and local development – when you change and deploy anything to your Kubernetes Cluster, you can easily tail the logs or check for errors or issues. You can also do all of this via the dashboard or kubectl too if you prefer, but it’s another handy and powerful feature from Minikube.

The following image shows the result of running this command:

eval $(minikube docker-env) && docker ps | grep -i metrics

so we can now use our local docker client to run docker commands like…

docker ps

docker ps | grep -i metrics

docker logs -f <some container id>

etc.

Kubernetes dashboard with Heapster and Metrics Server – made easy by Minikube

Minikube k8s dashboard – here we will start up the k8s dashboard and take look around.

We’ve delayed starting the dashboard up until after we enabled the metrics-server & heapster components we deployed earlier. By doing it in this order, the dashboard will automatically detect and use these components, giving us cpu & mem stats and a nicer looking dash, with no additional config required.

Starting the dashboard simply involved running

minikube dashboard

and waiting for a minute…

That should fire up your browser automatically, then you can take a look around at things like Default namespace > Nodes

and in the namespace kube-system > Deployments

and kube-system > Pods

You can see the logs and statuses of everything running in your k8s cluster – from the core components we covered at the start, to the dashboard, metrics and heapster we enabled recently, and the application we’re going to deploy and scale up soon.

kubectl – some examples and alternatives

# kubectl command line – look at kubectl and keep an eye on things
kubectl get deployment -n kube-system

kubectl get pods -o wide -n kube-system

kubectl get services

kubectl

example app – “hello (Kubernetes) world” minikube style with NGINX, scaling your world

Now we’ll deploy the most basic application we can – a “Hello World” style NGINX docker image.

It’s as simple as this, where nginx is the name of the docker image you want to deploy, hello-nginx is the label you want to give it, and port 80 is where you want it to listen:

kubectl run hello-nginx --image=nginx --port=80

that shouldn’t take long, and you can watch the progress like this:

kubectl get pods -o wide

We can then expose the deployment using NodePort:

kubectl expose deployment hello-nginx --type=NodePort

then we can ask Minikube to provide the URL for Ingress:

minikube service --url=true hello-nginx

and hitting that URL in your browser should show the obvious:

“Welcome to nginx!

If you see this page, the nginx web server is successfully installed and working. Further configuration is required.”

you can keep an eye on the Service with

kubectl get svc

while we scale to x3 replicas:

kubectl scale --replicas=3 deployment/hello-nginx

and take a look at what happens with

kubectl get deployment

kubectl get pods -o wide

or check in the Dashboard to see something like this:

and monitor what’s going on in our “hello world” NGINX app with kubectl then scale it down to 0 or 1 or whatever you like…

kubectl get deployment

kubectl get pods -o wide

kubectl scale --replicas=0 deployment/hello-nginx

Next post – Helm & Tiller onwards…

Meetup – Kubernetes with Minikube and Helm Charts

We are presenting a Kubernetes-related Meetup on Wednesday 5th June in Edinburgh.

This time we explore setting up a local development environment for Kubernetes using Minikube and Helm Charts. We will deploy NGINX to the Cluster and scaled it up and down, then use Helm Charts to deploy Jenkins, WordPress and MariaDB.
if you’d like to join in please book a space via our Meetup (below) – it’s free, and the Peoples Postcode Lottery are kindly hosting the event and providing the beer and pizza too! Wednesday 5th June 2019 from 6:30 PM in the Peoples Postcode Lottery offices at 28 Charlotte Square in Edinburgh.

Kubernetes – getting started with Minikube, Helm and Tiller

Wednesday, Jun 5, 2019, 6:30 PM

Wemyss House
28 Charlotte Square Edinburgh, GB

38 Members Went

In collaboration with Hays and the People’s Postcode Lottery, Automated IT Solutions are running a Meetup on Kubernetes with Minikube, Helm and Tiller. The session starts off with an overview of the main Kubernetes concepts and components, then runs through building your own local Kubernetes Cluster with Minikube. After deploying and scaling our fi…

Check out this Meetup →


I have been planning this session for ages, and hope that it will become the basis for several future talks and ideas, including deploying Blockchain to a Kubernetes cluster, then adding a Ruby and Sinatra based application that will use it.

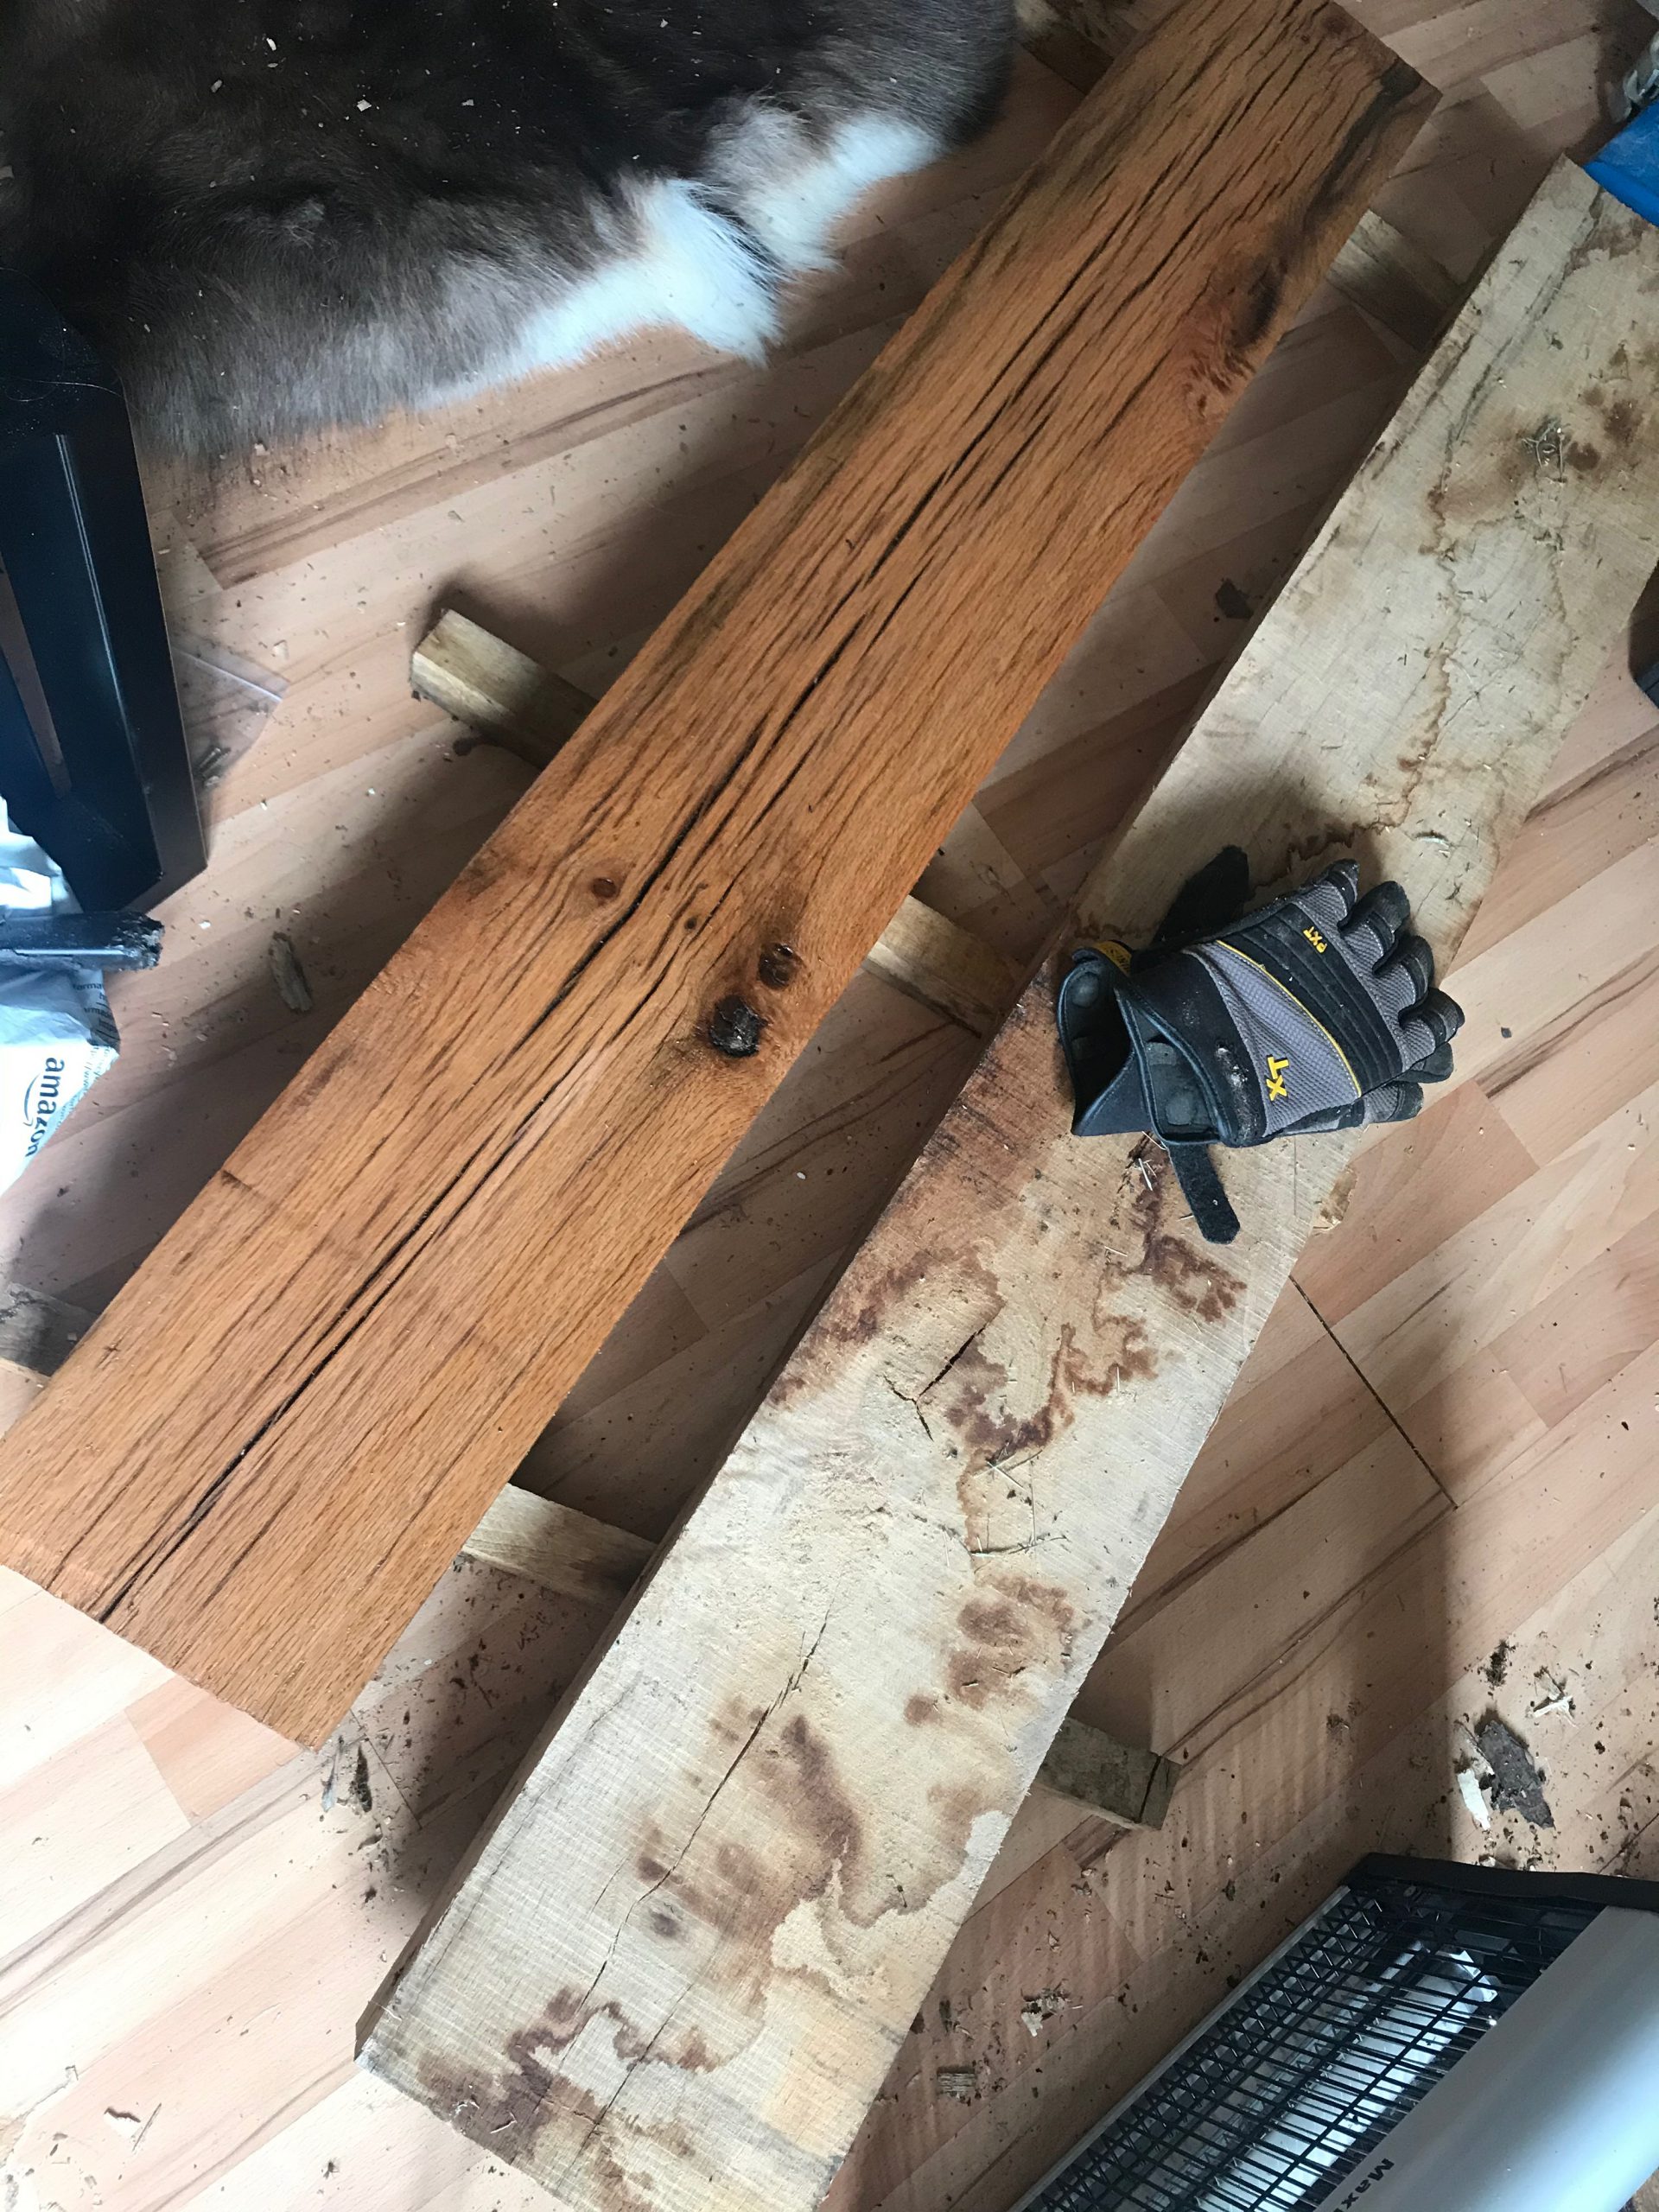
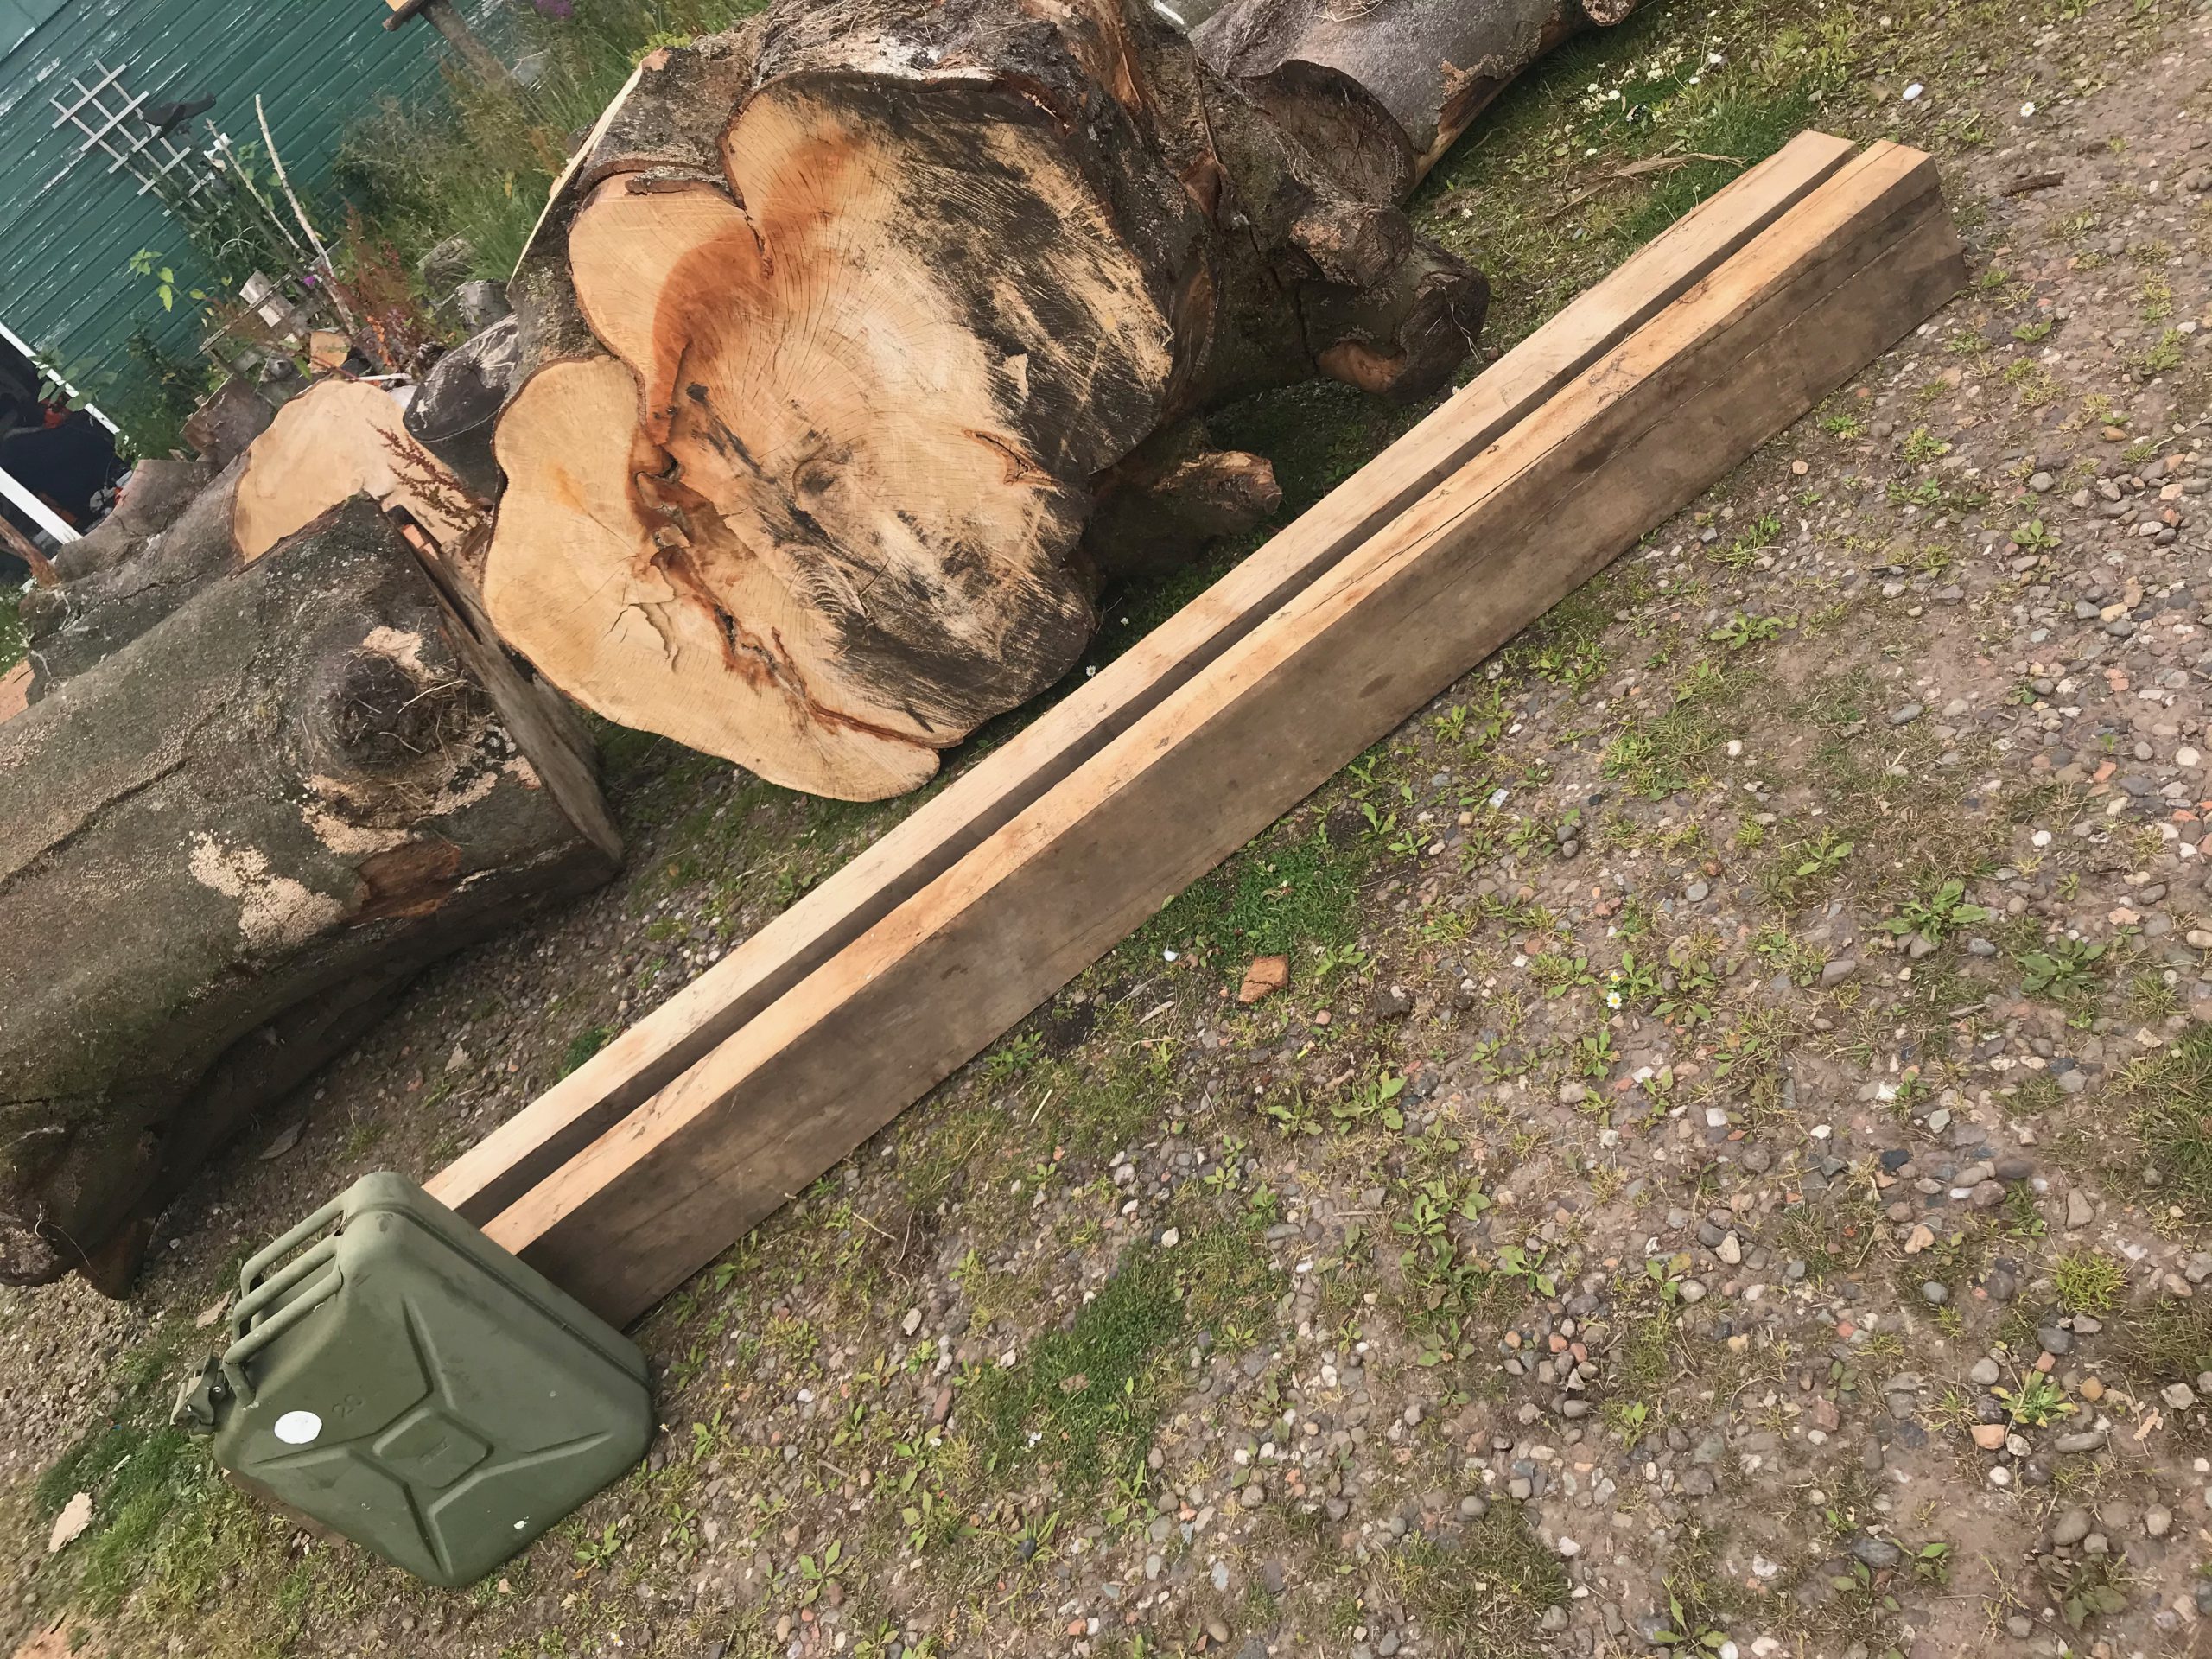
Big spalted beech bowl

Some pics of a recently turned beech bowl.

This was made from a wind-fallen tree I chopped up about 3 years ago. I sealed the ends of some of the nicer logs and left them outside to dry out slowly.

This is the first bowl made from one of these logs, and I’m very pleased with the result – really nice spalting and not too many cracks, plus it was nice and easy to carve on the lathe too.

The unsorted selection of pics below show it on the lathe and on the log it came from, with the random traffic lamp for scale…

Beech Tree 2019

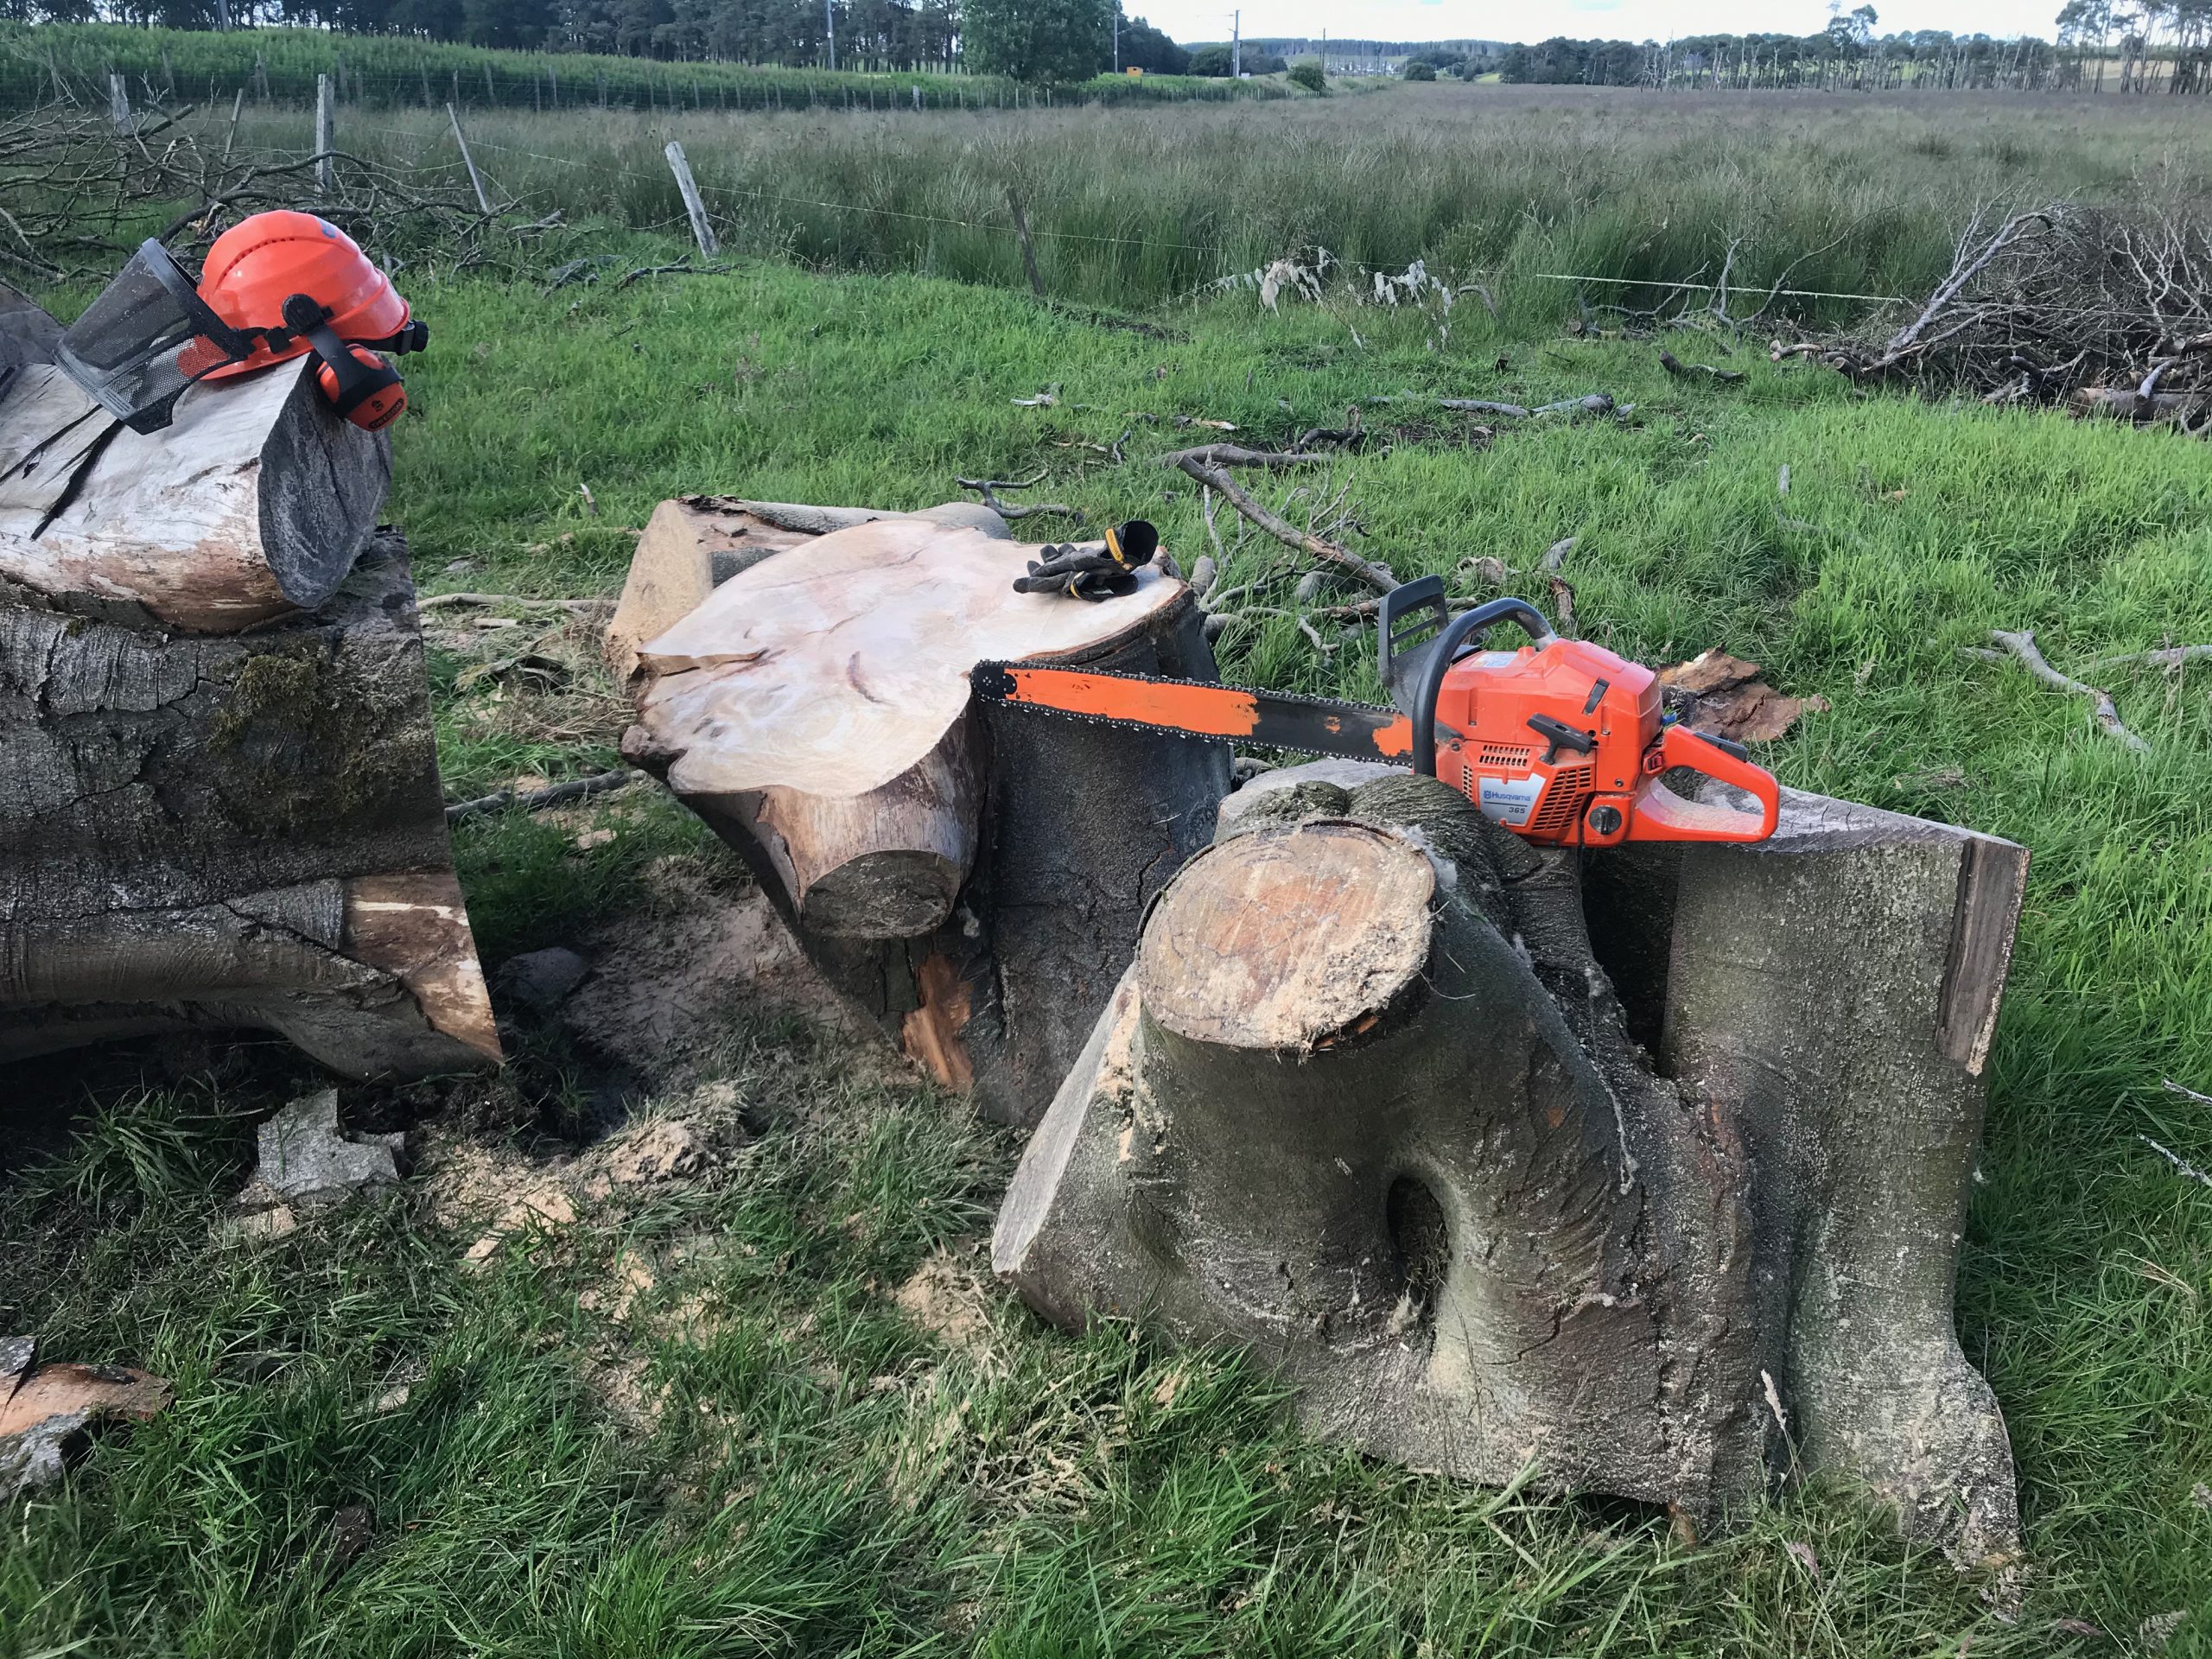
Recording progress on a large wind-fall Beech tree a neighbour has kindly let me have.

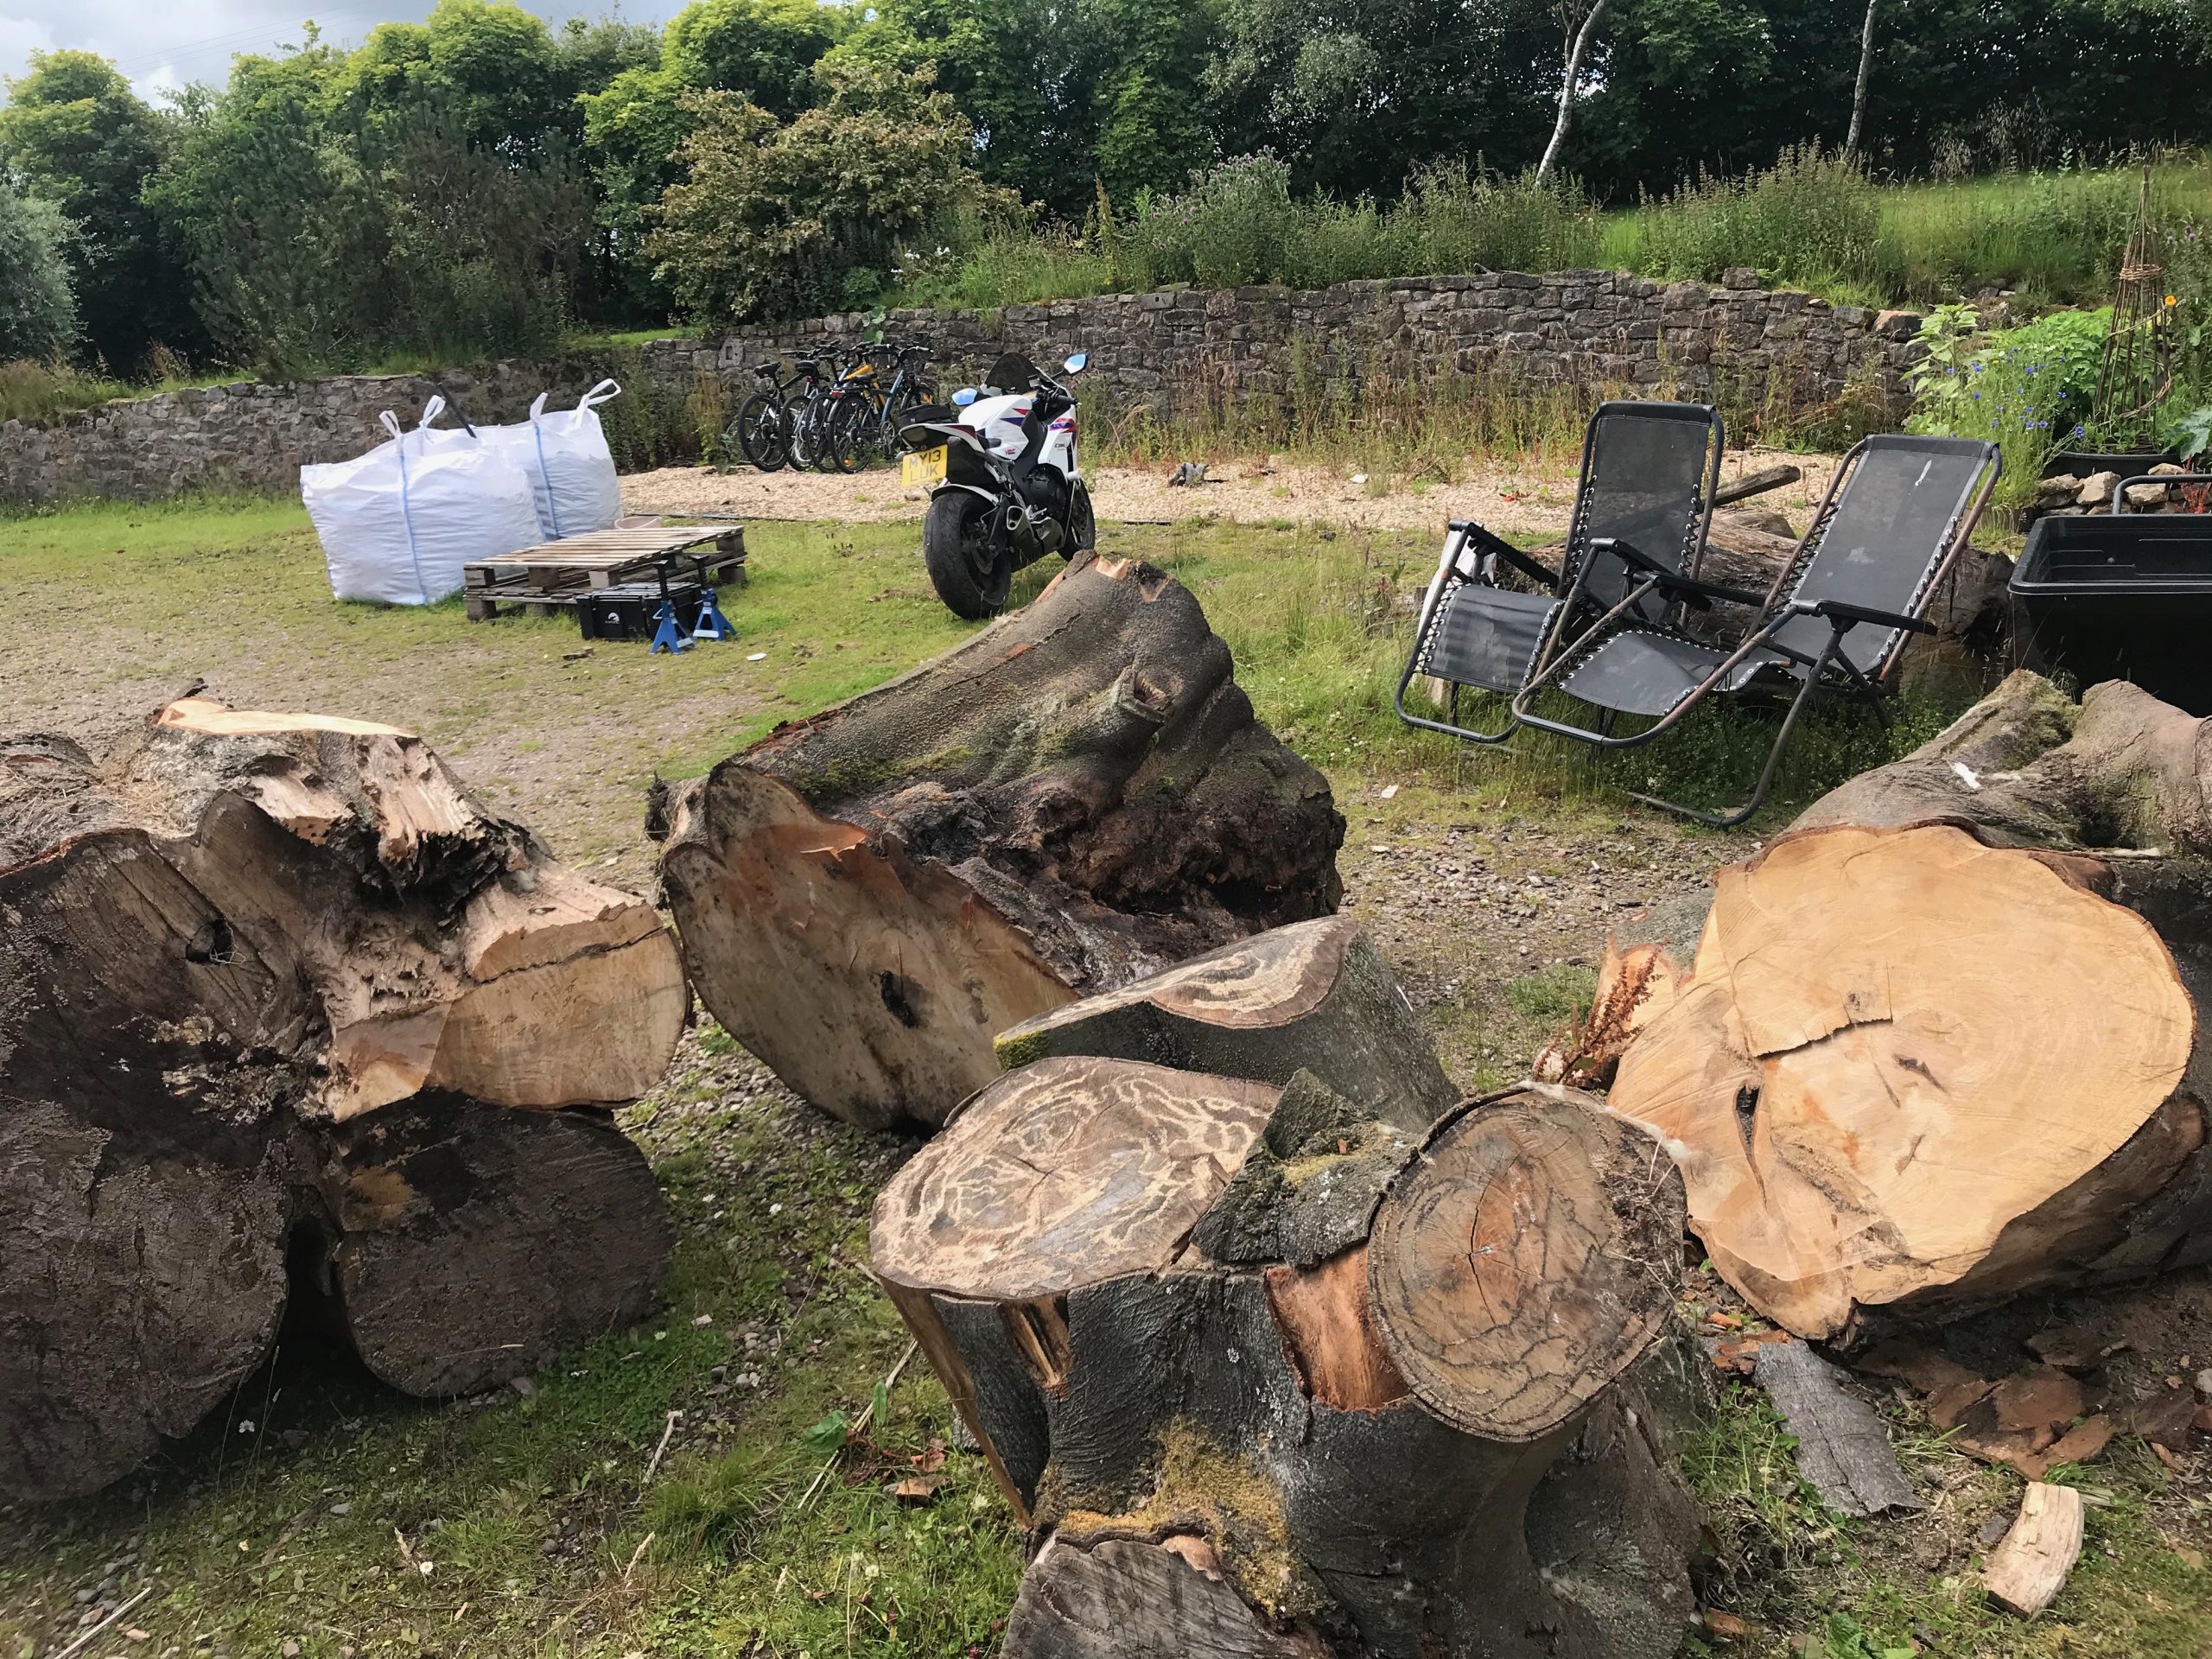
Most of this will be chopped up for firewood for next winter, but hopefully some of it will become bowls, planks, spoons, stools or other stuff over the next year – plan is to update this post with progress as that happens…

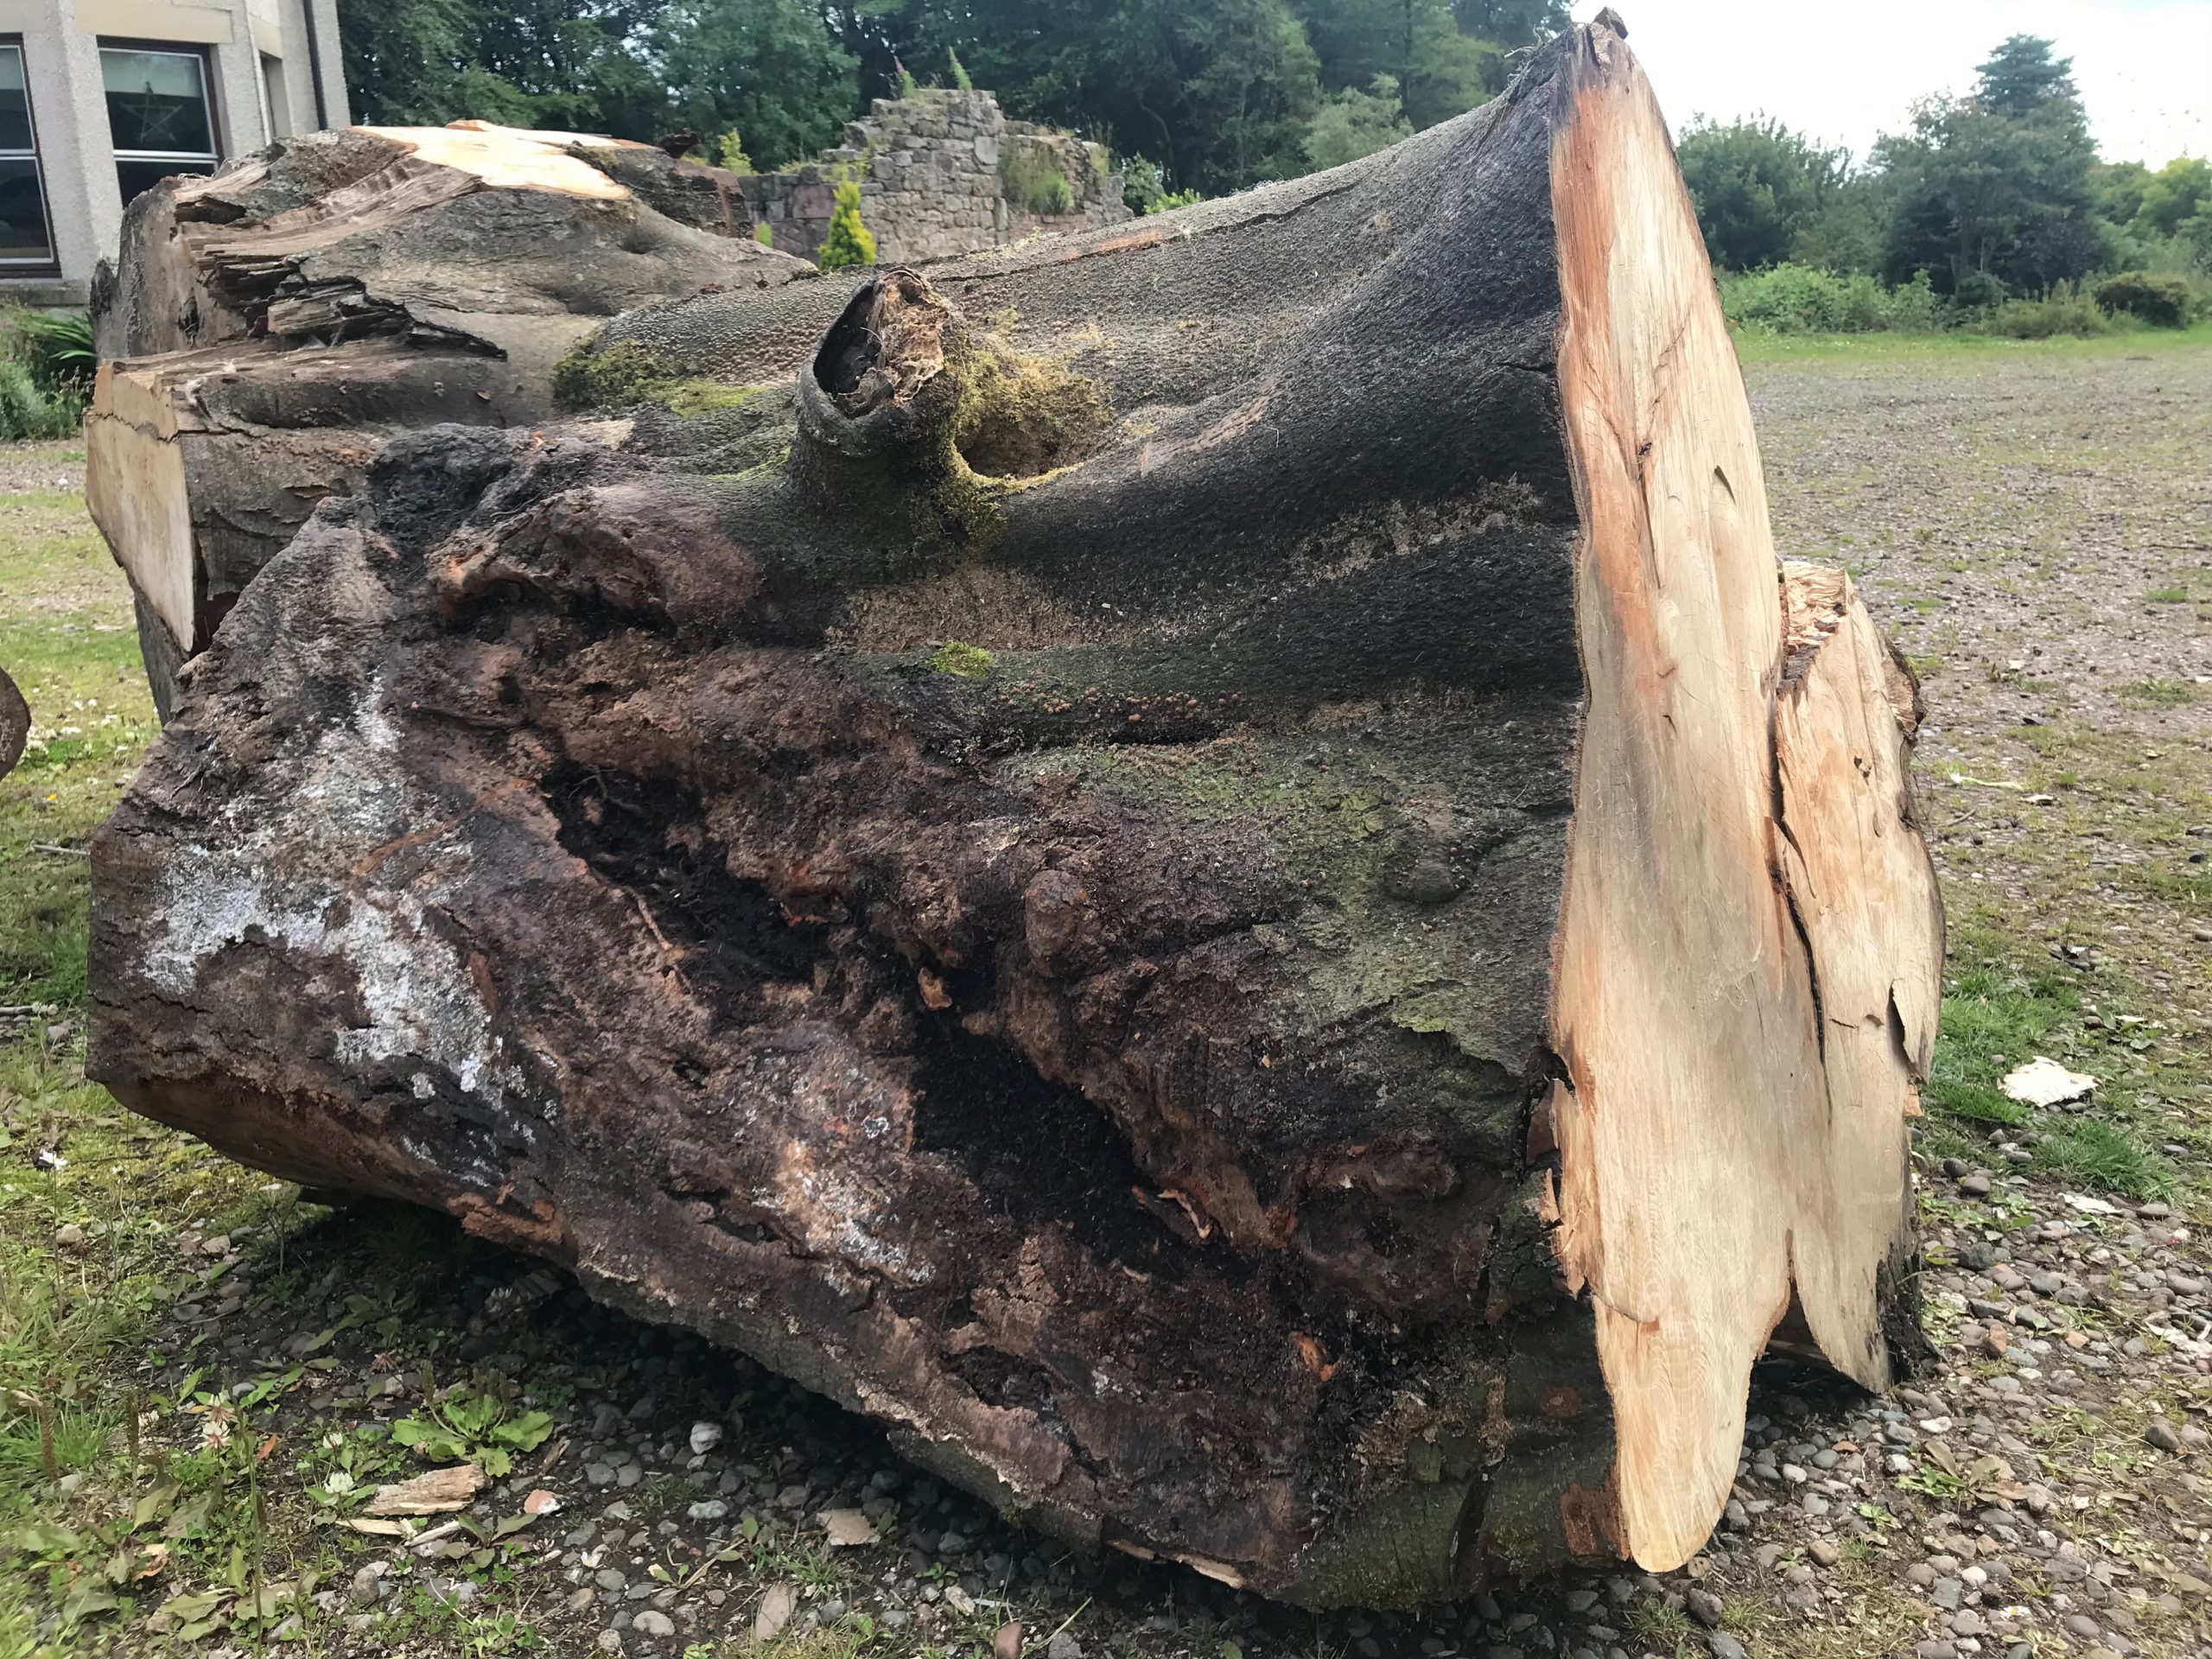
Some pics of the early stages and first few cuts:

This attempt at a panoramic pic shows the size of the tree better, pity I cut off the top of the photo though 🙁

Most of the first day was spent clearing the branches and chopping off the small bits in preparation to get at the multiple trunk sections next time.

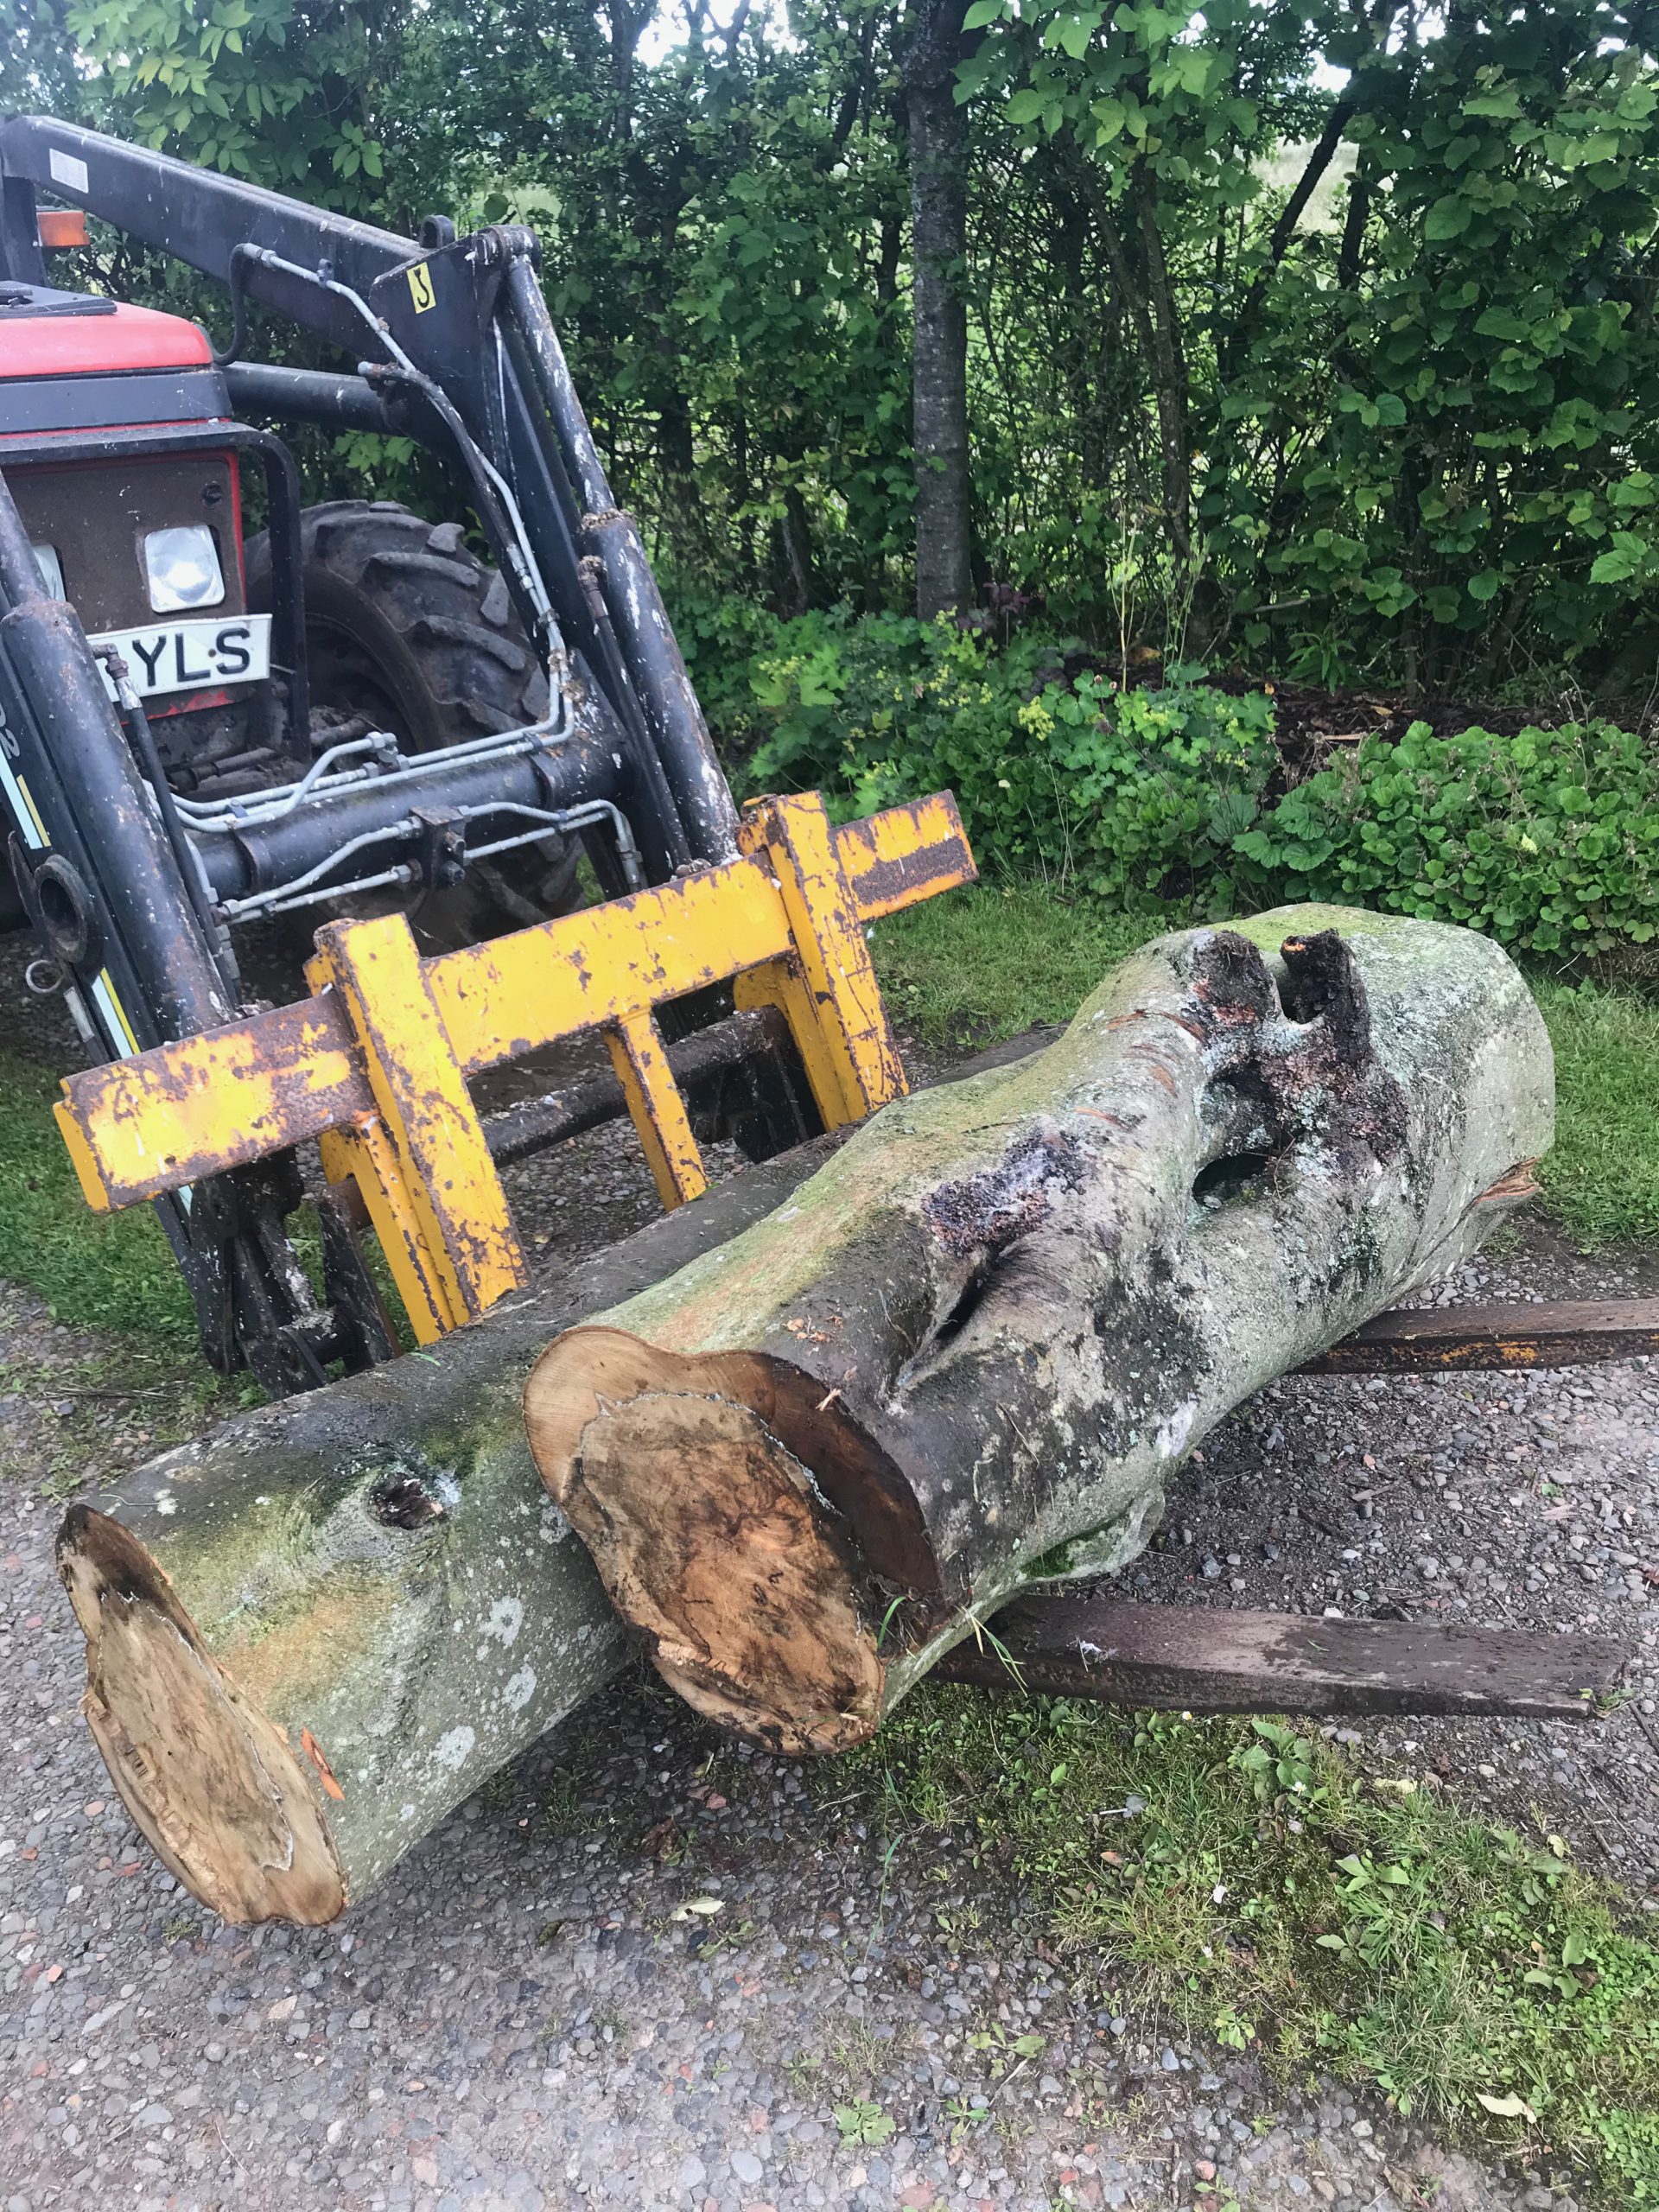
And some shots of the first few tractor loads brought home and added to the woodpile – still nice and green….

Jenkins Global Pipeline Libraries – a v.quick start guide

This post runs through the steps required to start using Global Pipeline Libraries in your Jenkins Pipelines.

There are many reasons you may want to use this functionality, the main attraction for me is to provide centralised libraries that perform common functions for multiple instances of Jenkins. This removes a lot of complexity from the pipelines and also reduces code repition; for example, you may have 10 Jenkins instances all performing the same general task, each using slightly diferent code. If you want to update how this task is done, you may have to find and update each instance. Alteratively, using this approach, you can update the central version and know that all of your Jenkins Pipelines that consume it will be udpated.

There are many posts about these all over the ‘net, but they mostly seemed overly complex, too specific and none too helpful to me – I just wanted to know how to get the most basic example possible working quickly on my dev Jenkins instance, so I could see how they work in practice and take it from there.

That’s what this post covers – getting a simple “Hello World” type example library published and made available in Jenkins, then calling it very easily from within a Pipeline job with the expected results. More detail and advanced usage to come later… these are a very powerful addition to Jenkins pipelines and once you see how they work, you may also see benefits to migrating some of your common tasks over to them.

This is done in three simple and logical steps:

Create a Library and Publish it

Tell Jenkins about your nice new library

Calling the Global Library from my Jenkins Pipeline


The first step is to…

Create your Library and publish it somewhere.

I have reused one of my existing GitHub repos: https://github.com/DonaldSimpson/groovy.git for this example, but most version control systems should do just as well.

That’s all that’s needed for this most-basic example – here is the code in plain text, as taken from the guide here:

#!/usr/bin/env groovy
def call(String name = 'human') {
    // Any valid steps can be called from this code, just like in other
    // Scripted Pipeline
    echo "Hello, ${name}."
}

It is important to note that the file is in a “vars” directory, this is the naming convention Jenkins expects to find your groovy libraries within, and is best followed.

A. Note

Next step is to:

Tell Jenkins about your nice new library

This is done by going to Manage Jenkins then Configure System, then scrolling down to Global Pipeline Libraries and defining a new instance of one, just like this:

The settings used here are:

Name: mycommonlibs // any “friendly” name you’d like to reference these libraries by

Default version: master // or use a branch or version number if you prefer

I then checked the three tick boxes, especially the Load implicitly which removes the need to load Libraries explicitly in your Jenkinsfile (you can do this, and it may be very useful depending on your needs, but I want simple and easy for now).

The final section tells Jenkins where this Library is:

https://github.com/DonaldSimpson/groovy.git

and I provide a user to access GitHub with.

That is all that is needed to set up a Library and tell Jenkins all about it.

Note that anyone with write access to the location of your defined Libraries will effectively have full access to your Jenkins instance – if they can update the code that’s being run…

W. Arning

And finally, it’s time for a test drive…

Calling the Global Library from my Jenkins Pipeline:

    sayHello ()
    sayHello 'Donald'

To end up with a mega-basic Pipeline that looks like this:

When this Jenkins Pipeline job is run, it generates the following output:

Summary

Which as you can see means that Jenkins has pulled in the Shared Library from GitHub, resolved and called the sayHello() method from the remote common library, called it again with a passed parameter (‘Donald‘) and produced the expected results. Yay. How neat and how easy was that?
There’s a whole lot more you can do with Global Pipeline Libraries in Jenkins. From this point you can easily add complexity and functionality to build up a library of powerful and useful utilities that will greatly improve the quality and manageability of your Pipelines. I generally start by finding common tasks and patterns and externalise those to shared libraries.

I plan to expand on some of these points in a later post, but hopefully this shows how to quickly and easily start using them.

Cheers,

Don

Kubernetes – Dashboard with Heapster stats

Previous related posts:

Introduction/background

It’s pretty easy to deploy a functional Kubernetes dashboard to a Kubernetes Cluster, either using the stable Helm Chart or the official Kubernetes Dashboard project directly.

What was a little trickier, was getting live stats for my cluster – cpu and mem load etc – to show up inside the dashboard, so that you can see the status of the various deployments and pods on your cluster at a glance from one central location.

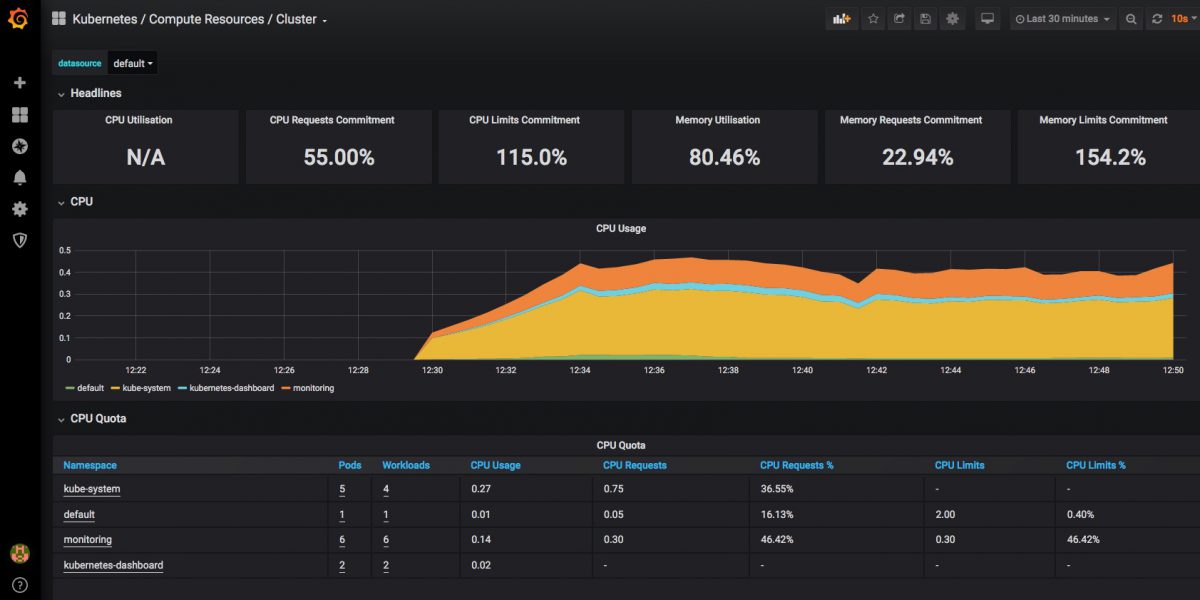
This combination of tools also makes it easy to add on Grafana dashboards that display whatever cluster stats you want from InfluxDB or Prometheus via Heapster, producing something along these lines:

Image
Image

This post documents the steps I took to get things working the way I want them.

Adding Heapster to a Kubernetes Cluster

I’ve used Heapster before and found it did everything I wanted without any problem, especially with an InfluxDB backend, but it’s now being deprecated and replaced with the new metrics-server (and others), which at the time I was doing this doesn’t integrate with the kubernetes dashboard so wouldn’t give me the stats I was looking for., which are this kind of thing…

and this

Note that it’s slightly easier to get Heapster stats working first, then when you add on the dashboard it’ll pick them up.

Heapster can be installed using the default project here, but it will not work with the current/latest version of Kubernetes Dashboard like that, and some changes are needed to make the two play nicely together.

I followed the steps in this very helpful post: https://brookbach.com/2018/10/29/Heapster-on-Kubernetes-1.11.3.html

and created my own fork of the official Heapster repo with the recommended changes then made to it, so now I can then simply (re)apply those settings whenever I rebuild my Cluster, and things should keep working.

My GitHub repo for this is here:

https://github.com/DonaldSimpson/heapster

and after cloning it (with the needed changes already done in that repo) locally I applied those files as described in the above post:

$ kubectl create -f ./deploy/kube-config/rbac/

then

$ kubectl create -f ./deploy/kube-config/influxdb/

Note that it may take a while for things to start happening…

The simplest test to see when/if Heapster is working is to check with kubectl top against a node or pod like so:

ansible@umaster:~$ kubectl top node umaster
NAME CPU(cores) CPU% MEMORY(bytes) MEMORY%
umaster 144m 3% 3134Mi 19%

ansible@umaster:~$ kubectl top node ubuntu01
NAME CPU(cores) CPU% MEMORY(bytes) MEMORY%
ubuntu01 121m 6% 2268Mi 59%
ansible@umaster:~

If you get stats something like the above back things are looking good, but if you get a “no stats available” message, you’ve got some fundamental issues. Time to go check the logs and look for errors. I had quite a series of them until I made the above changes, including many access verboten errors like:

reflector.go:190] k8s.io/heapster/metrics/util/util.go:30: Failed to list *v1.Node: nodes is forbidden: User “system:serviceaccount:kube-system:heapster


Kubernetes Dashboard with user & permissions sorted

Next, I deployed the dashboard as simply as this:

https://github.com/kubernetes/dashboard
kubectl apply -f https://raw.githubusercontent.com/kubernetes/dashboard/v1.10.1/src/deploy/recommended/kubernetes-dashboard.yaml

but will probably use the Helm Chart for the kubernetes-dashboard next, which I think uses the same project.

Once deployed, I needed to edit

kubectl -n kube-system edit service kubernetes-dashboard

as per here:
https://github.com/kubernetes/dashboard/wiki/Accessing-Dashboard—1.7.X-and-above
and change

 type: ClusterIP 

to

type: NodePort

And I also applied these changes to create a Cluster Role and Service Admin account:

ansible@umaster:~/ansible01$ cat <<EOF | kubectl create -f -
apiVersion: rbac.authorization.k8s.io/v1beta1
kind: ClusterRoleBinding
metadata:
name: kubernetes-dashboard
labels:
k8s-app: kubernetes-dashboard
roleRef:
apiGroup: rbac.authorization.k8s.io
kind: ClusterRole
name: cluster-admin
subjects:
kind: ServiceAccount
name: kubernetes-dashboard
namespace: kube-system
EOF

I then restarted the dashboard pod to pick up the changes:

kubectl delete pod kubernetes-dashboard-57df4db6b-4tcmk --namespace kube-system

Now it should be time to test logging in to the Dashboard. If you don’t have a service endpoint created already/automatically, you can find and do a quick test via the current NodePort by running

kubectl -n kube-system get service kubernetes-dashboard

Then hit your cluster IP with that PORT in your browser and you should see a login page like:

Presenting the next hurdle… how to log in to your nice new Dashboard and see all the shiny new info and metrics!

Run
sudo kubectl -n kube-system get secret
and look/grep for something starting with “kubernetes-dashboard-token-” that we created above. Then do this to get the token to log in with full perms:


sudo kubectl -n kube-system describe secret kubernetes-dashboard-token-rlr9m

or whatever unique name you found above – hitting tab after the last “-” should work if you have completion set up.

That should give you a TOKEN you can copy and log in to the Dashboard with.

You should now have full access in the dashboard, no more permissions errors, and be able to see the stats provided by Heapster too.

My TODO list to finish off this part of the project properly includes:

  • exposing the dashboard as a service on a suitable free port
  • resetting the cluster
  • running through things again to ensure it all works first time
  • see if using the Helm chart provides any benefits
  • adding in monitoring and alerting via Grafana.

If you’re interested in monitoring and metrics for Kubernetes, this post takes things further: Kubernetes – Operators for monitoring with Prometheus and Grafana dashboards

Pin It on Pinterest