Intro
My notes on setting up Frigate NVR for a home CCTV setup.
The main focus of this post is on object detection (utilising a Google Coral TPU) and configuring notifications to Amazon Fire TVs (and other devices) via intregration with HomeAssistant.
There’s a lot to cover and no point in reproducing the existing documentation, you can find full details & info on setting up the main components here:
ZoneMinder
Google Coral Edge TPU
Frigate
HomeAssistant
Background
I used Zoneminder for many years to capture and display my home CCTV cameras. There are several posts – going back to around 2016 – on this site under the ZoneMinder category here
This worked really well for me all that time, but I was never able to setup Object Detection in a way I liked – it can be done in a number of different ways, but everything I tried out was either very resource intensive, required linking to Cloud services like TensorFlow for processing, or was just too flaky and unreliable. It was fun trying them out, but none of them ever suited my needs. Integration and notification options were also possible, but were not straightforward.
So, I eventually took the plunge and switched to Frigate along with HomeAssistant. There was a lot to learn and figure out, so I’m posting some general info here in case it helps other people – or myself in future when I wonder why/how I did things this way….
Hardware
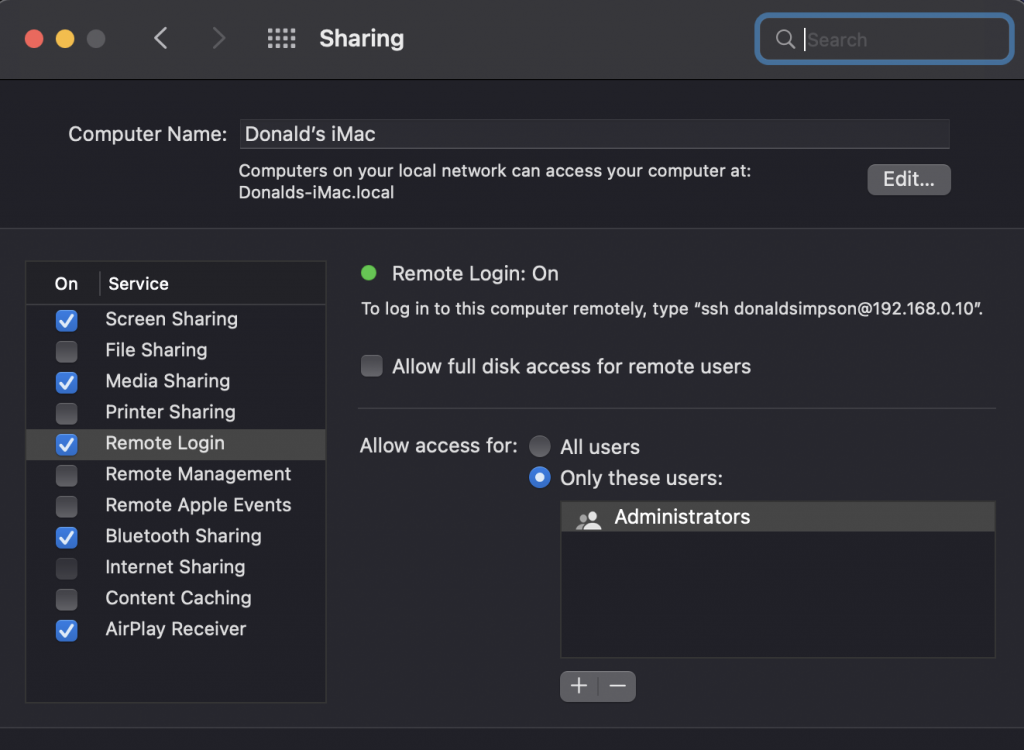
I have 4 CCTV cameras, these are generic and cheap 1080p Network IP cameras, connected via Ethernet. I don’t permit them any direct access to the Internet for notifications, updates, event analysis or anything.
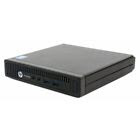
I ran ZoneMinder (the server software that manages and presents the feeds from the cameras) on various hardware over the years, but for the Frigate and HomeAssistant setup I have gone for an energy-efficient and quiet little “server” – an HP ProDesk 600 G1 Mini – it’s very very basic and very low powered… and cost £40 on eBay:
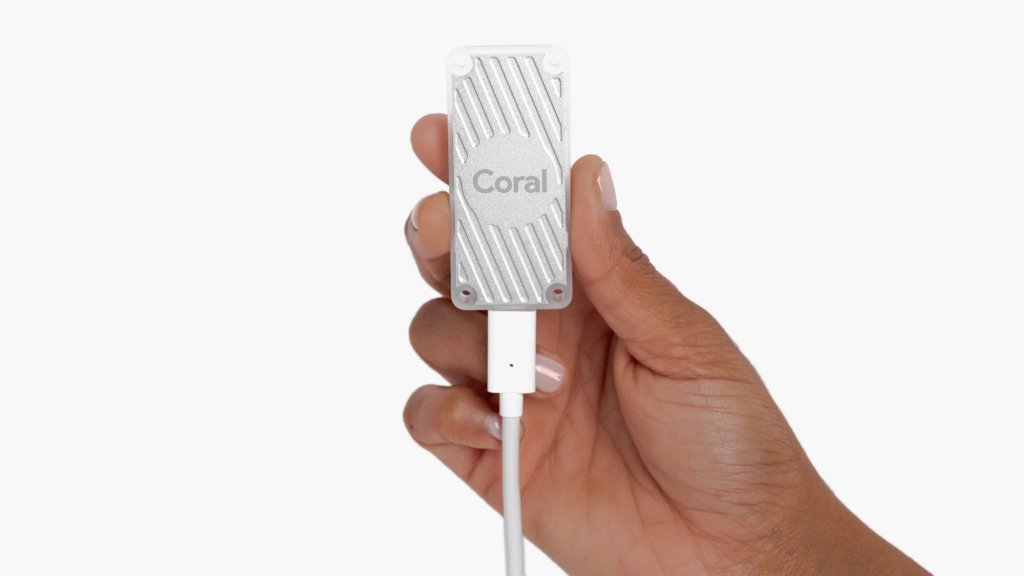
After testing Object Detection using the CPU (this is waaaay too much load for the CPU to cope with longer-term, but really helps to test proves the concept) I have since added a Google Coral Edge TPU to the host via USB. This enables me to offload the detection/inference work to the TPU and spare the little CPU’s energy for other tasks:
Objectives
My key goals here were to:
- Setup and trial Frigate – to see if it could fit my requirements and replace ZoneMinder
- Add Object Detection – without having to throw a lot of hardware at it or use Cloud Services like TensorFlow
- Integrate with HomeAssistant – I’d been wanting to try this for a while, to integrate my HomeKit devices with other things like Sonos, Amazon Fire TVs, etc
Note that you do not need to use HomeAssistant or MQTT in order to use or try Frigate, it can run as a standalone insatnce if you like. Frigate also comes with its own web interface which is very good, and I run this full-screen/kiosk mode on one of my monitors.
Setup and trial Frigate: setting up Frigate was easy, I went for Ubuntu on my host and installed Docker on that, then configured Frigate and MQTT containers to communicate. These are both simply declared in the Frigate config like this:
mqtt:
host: 192.168.0.27
detectors:
coral:
type: edgetpu
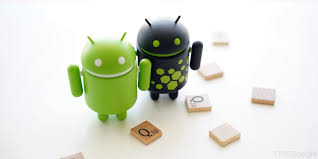
device: usbAdd Object Detection: with Frigate, this can be done by a Google Coral Edge TPU (pic above) – more info here: https://coral.ai/products/accelerator/ and details on my config below. I first trialled this using the host CPU and it ‘worked’ but was very CPU intensive: adding the dedicated TPU makes a massive difference and inference speeds are usually around 10ms for analysis of 4 HD feeds. This means the host CPU is free to focus on running other things (which is just as well given the size of the thing).
    objects:
      track:
        - person
        - dog
        - car
        - bird
        - cat
https://docs.frigate.video/configuration/objects
Integrate with HomeAssistant : Added the HomeAssistant Docker instance to my host, then ran and configured MQTT container for Frigate then configured Frigate + HomeAssistant to work together. This was done by first installing HACS in HA, then using the Frigate Integration as explained here:
https://docs.frigate.video/integrations/home-assistant/
Setup Notifications
Phone notifications – I have previosuly had (and posted about my) issues with CGNAT and expected I would need to set up and ngrok tunnel and certs and jump through all sorts of hoops to get HA working remotely.
HA offers a very simple Cloud Integration via https://www.nabucasa.com/
I trialled this and was so impressed I have already signed up for a year – it’s well worth it for me and makes things much simpler. Phone notifications can be setup under HomeAssistant > Settings > Automations and Scenes > Frigate Notifications – after installing the Frigate Notifications Bueprint via HACS.
I can now open HomeAssistant on my phone from anywhere in the World and view a dashboard that has live feeds from my CCTV cameras at home. I have also set it up to show recently detected objects from certain cameras too.
Amazon FireTV notifications – I have just setup the sending of notifications to the screen of my Amazon Fire TV, this was done by first installing this app on the device:
https://www.amazon.com/Christian-Fees-Notifications-for-Fire/dp/B00OESCXEK
Then installing
https://www.home-assistant.io/integrations/nfandroidtv/
on HA and configuring Notifications as described there. I now get a pop-up window on my projector screen whenever there’s someone at my front gate.
This is a quick (and poor quality) pic of my projector screen (and chainsaw collection) with an Amazon Fire TV 4k displaying a pop-up notification in the bottom-right corner:
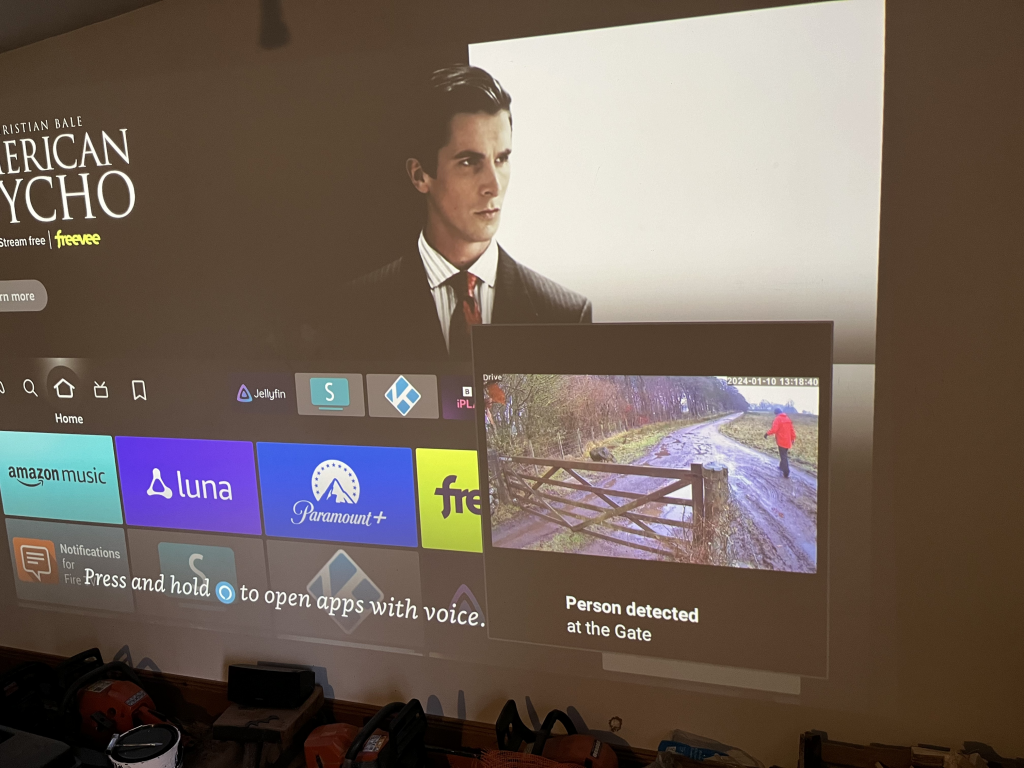
This means I now don’t need to leave a monitor on showing my CCTV feeds any more, as I am notified either via my mobile or on screen. And my notifications are only set up for specific object types – people & cars, and not for things it picks up frequently that I don’t want to be alerted on, like birds or passing sheep or cows.
Minor Apple Watch update – these notifications are also picked up on my Apple Watch, which is set to display my phone notifications. So I also get a short video clip of the key frames which is pretty awesome and works well.
My Frigate Config – here’s an example from the main “driveway” camera feed, this is the one I want to be montoring & ntoified about most. It’s using RTSP to connect, record and detect the listed object types that I am interested in:
  driveway:
    birdseye:
      order: 1
    enabled: True
    ffmpeg:
      inputs:
        - path: rtsp://THEUSER:THEPASSWORD@192.168.0.123:554/1
          roles:
            - detect
            - rtmp
        - path: rtsp://THEUSER:THEPASSWORD@192.168.0.123:554/1
          roles:
            - record
    detect:
      width: 1280
      height: 720
      fps: 5
      stationary:
        interval: 0
        threshold: 50
    objects:
      track:
        - person
        - dog
        - car
        - bird
        - cat
The full 24/7 recordings are all kept (one file/hour) for a few days then deleted and can be seen via HA under
Media > Frigate > Recordings > {camera name} > {date} > {hour}
Docker container start scripts
A note of the scripts I use to start the various docker containers.
This would be much better managed under Docker Compose or something, there are plenty of examples of that online, but I’d like to look at setting all of this up on Kubernetes so leaving this as rough as it is for now.
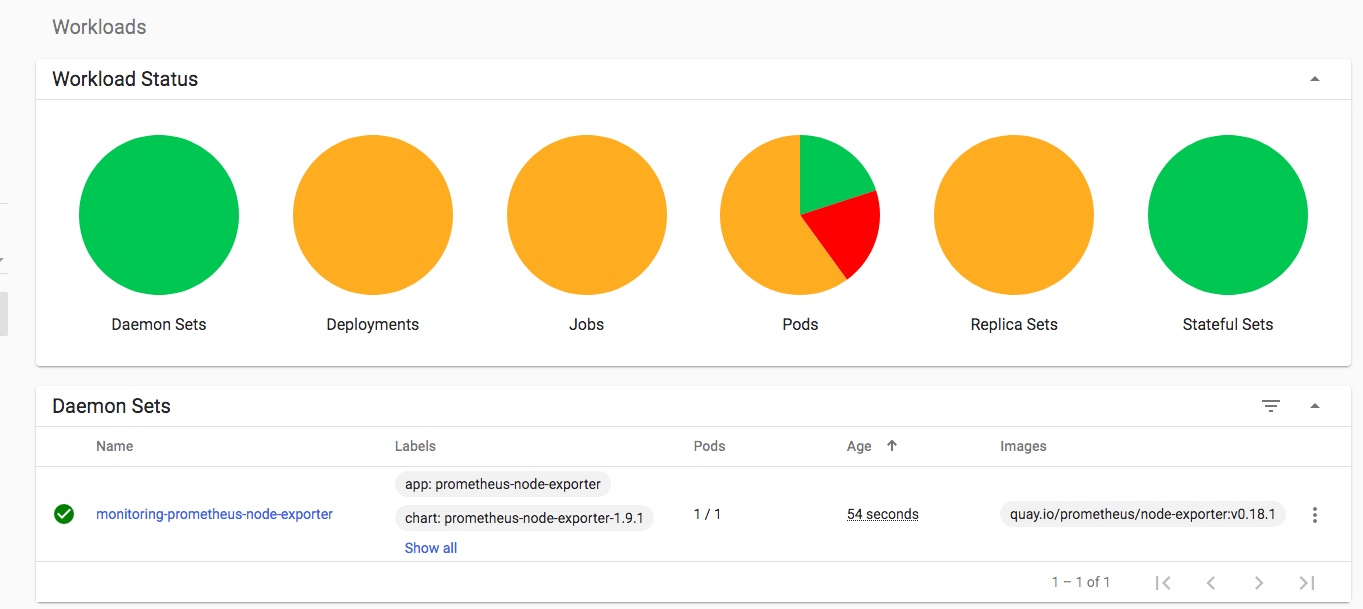
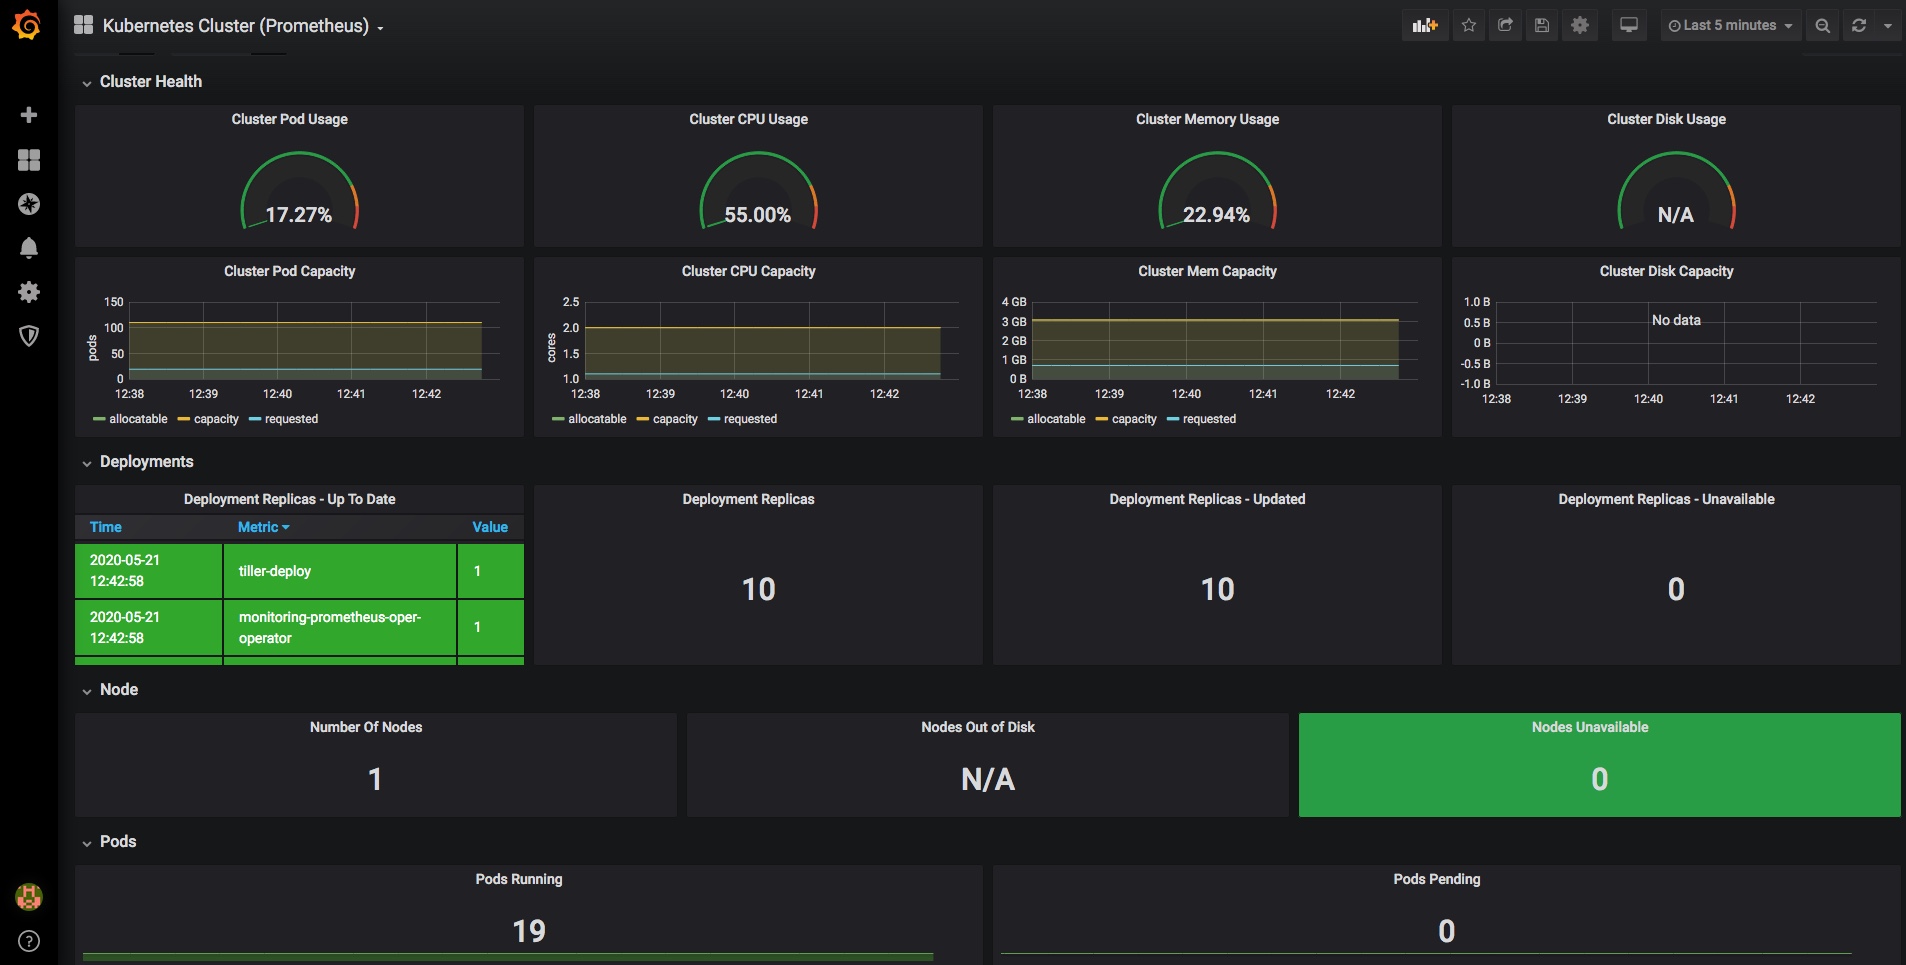
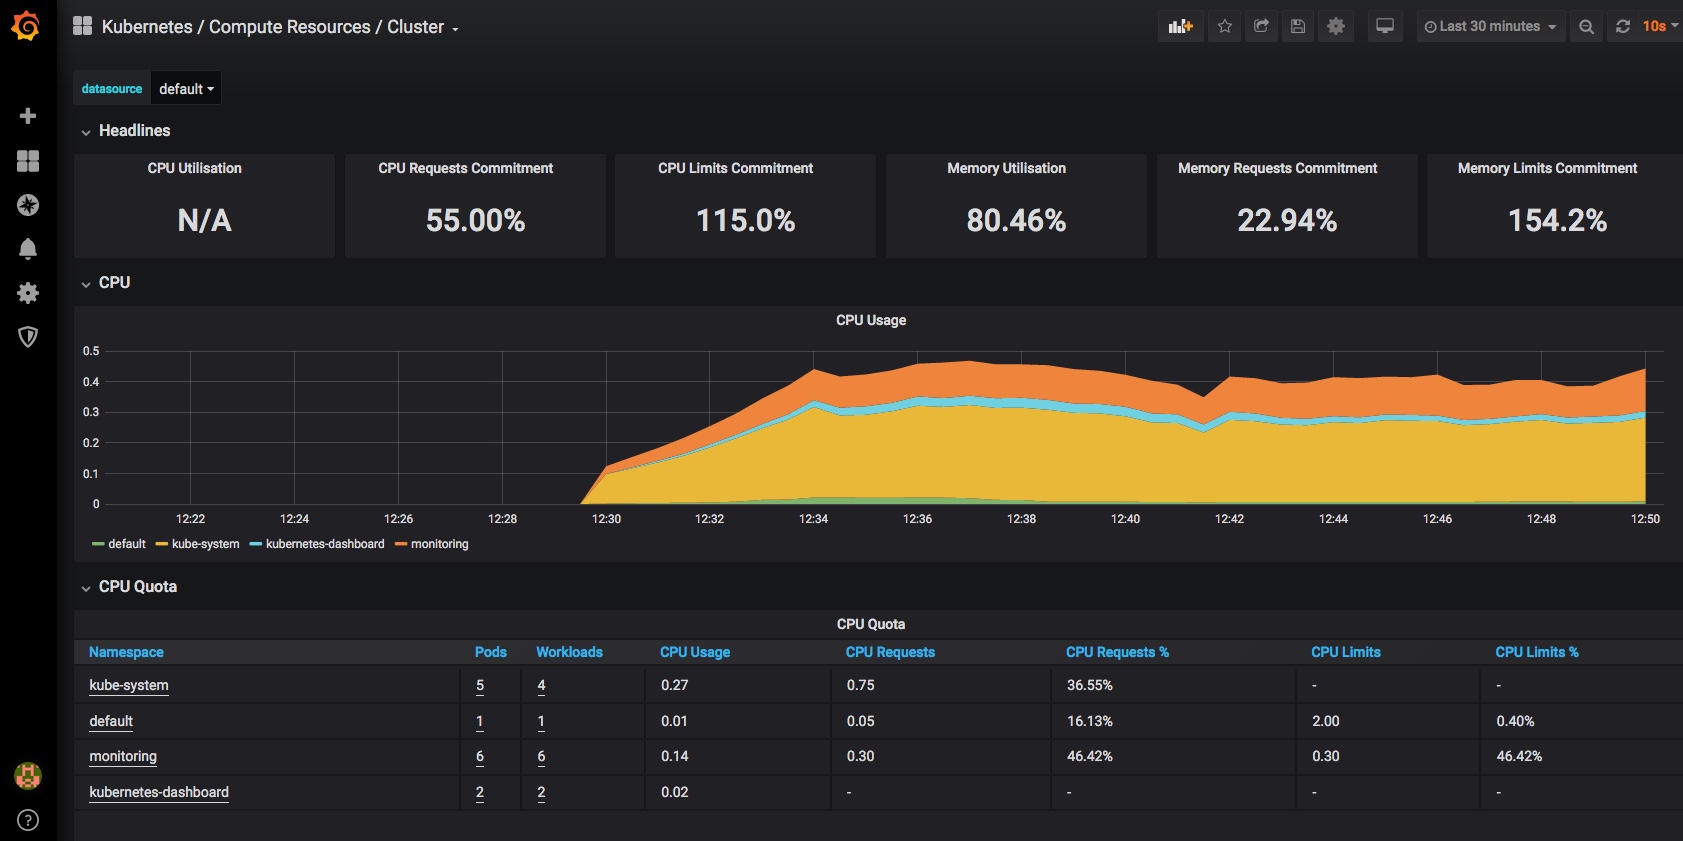
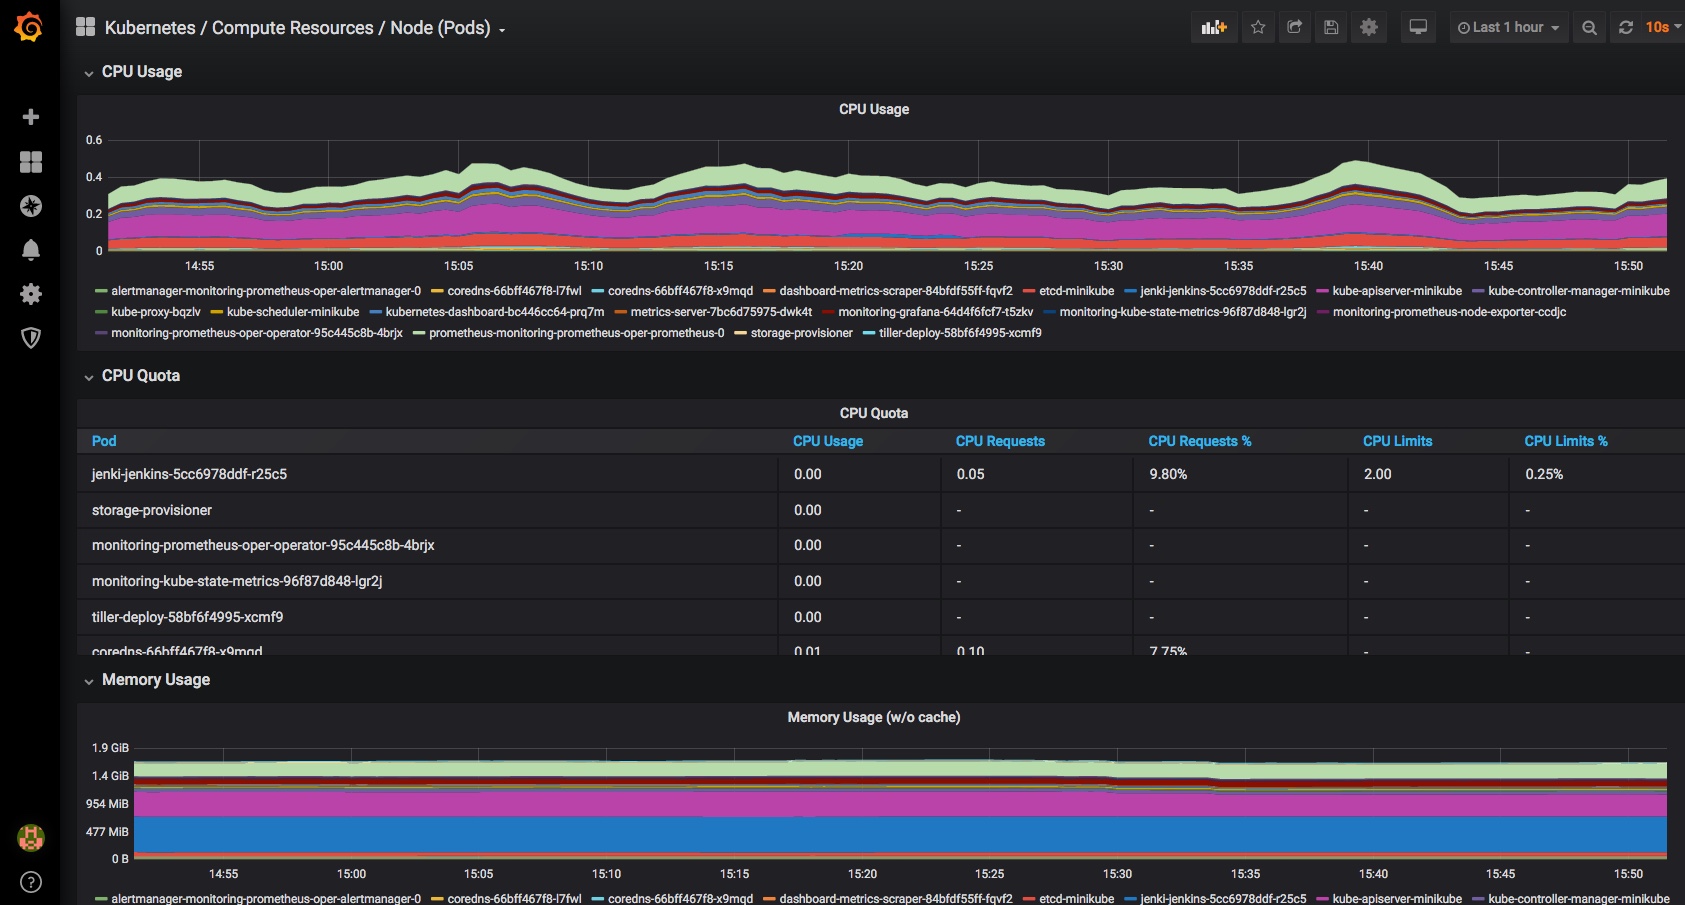
I am also running Grafana and NodeExporter at the moment to keep an eye on the stats, although things would probably look less worrying if I wasn’t adding to the load just to monitor them:
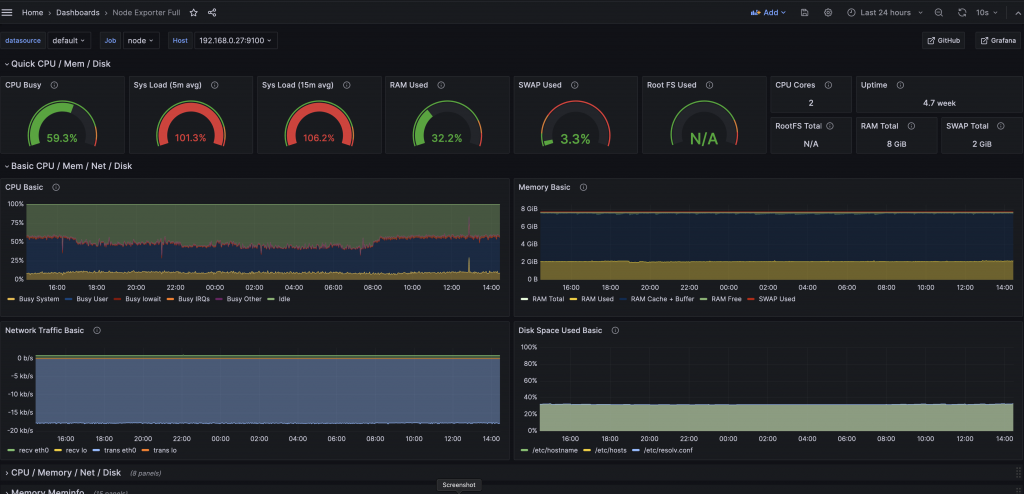
I’ll need to do something about that system load; it’s tempting to just get a second HP host & Coral TPU and put some of the load and half of the cameras on that – will see… a k8s cluster of them would be neat.
# Start Frigate containerdocker run -d \
--name frigate \
--restart=unless-stopped \
--mount type=tmpfs,target=/tmp/cache,tmpfs-size=1000000000 \
--device /dev/bus/usb:/dev/bus/usb \
--device /dev/dri/renderD128 \
--shm-size=80m \
-v /root/frigate//storage:/media/frigate \
-v /root/frigate/config.yml:/config/config.yml \
-v /etc/localtime:/etc/localtime:ro \
-e FRIGATE_RTSP_PASSWORD='password' \
-p 5000:5000 \
-p 8554:8554 \
-p 8555:8555/tcp \
-p 8555:8555/udp \
ghcr.io/blakeblackshear/frigate:stable
# Start homeassistant containerdocker run -d \
--name homeassistant \
--privileged \
--restart=unless-stopped \
-e TZ=Europe/Belfast \
-v /root/ha_files:/config \
--network=host \
ghcr.io/home-assistant/home-assistant:stable
# Start MQTT containerdocker run -itd \
--name=mqtt \
--restart=unless-stopped \
--network=host \
-v /storage/mosquitto/config:/mosquitto/config \
-v /storage/mosquitto/data:/mosquitto/data \
-v /storage/mosquitto/log:/mosquitto/log \
eclipse-mosquitto
# Start NodeExporter containerdocker run -d \
--name node_exporter \
--privileged \
--restart=unless-stopped \
-e TZ=Europe/Belfast \
-p 9100:9100 \
prom/node-exporter
# Start Grafana containerdocker run -d \
--name grafana \
--privileged \
--restart=unless-stopped \
-e TZ=Europe/Belfast \
-p 3000:3000 \
grafana/grafana