In the ever-evolving landscape of software development, ensuring the integrity and security of build artifacts is paramount. As CI/CD pipelines become more sophisticated, integrating cryptocurrency technologies can provide a robust solution for managing and securing build artifacts. This blog post delves into the concept of immutable build artifacts and how crypto technologies can enhance CI/CD pipelines.
Understanding CI/CD Pipelines
CI/CD pipelines are automated workflows that streamline the process of integrating, testing, and deploying code changes. They aim to:
Continuous Integration (CI): Automatically integrate code changes from multiple contributors into a shared repository, ensuring a stable and functional codebase.
Continuous Deployment (CD): Automatically deploy integrated code to production environments, delivering new features and fixes to users quickly and reliably.
The Importance of Immutable Build Artifacts
Build artifacts are the compiled binaries, libraries, and other files generated during the build process. Ensuring these artifacts are immutable—unchangeable once created—is crucial for several reasons:
Security: Prevents tampering and unauthorized modifications.
Reproducibility: Ensures that the same artifact can be deployed consistently across different environments.
Auditability: Provides a clear and verifiable history of artifacts.
Leveraging Crypto Technologies for Immutable Build Artifacts
Decentralization: Distributes data across multiple nodes, reducing the risk of a single point of failure.
Immutability: Ensures that once data is written, it cannot be altered or deleted.
Transparency: Provides a transparent and auditable history of all transactions.
Implementing Immutable Build Artifacts in CI/CD Pipelines
Generate Build Artifacts: During the CI process, generate the build artifacts as usual.
   # Example: Building a Docker image
   docker build -t my-app:latest .
Create a Cryptographic Hash: Generate a cryptographic hash (e.g., SHA-256) of the build artifact to ensure its integrity.
   # Example: Generating a SHA-256 hash of a Docker image
   docker save my-app:latest | sha256sum
Store the Hash on a Blockchain: Store the cryptographic hash on a blockchain to ensure immutability and transparency.
   # Example: Using a blockchain-based storage service
   blockchain-store --hash <generated-hash> --metadata "Build #123"
Retrieve and Verify the Hash: When deploying the artifact, retrieve the hash from the blockchain and verify it against the artifact to ensure integrity.
Verify the artifact’s integrity using the retrieved hash.
Deploy the verified artifact to the production environment.
Benefits of Using Immutable Build Artifacts
Enhanced Security: Blockchain’s immutable nature ensures that build artifacts are secure and tamper-proof.
Improved Reproducibility: Immutable artifacts guarantee consistent deployments across different environments.
Increased Transparency: Blockchain provides a transparent and auditable history of all build artifacts.
Conclusion
Integrating cryptocurrency technologies with CI/CD pipelines to manage immutable build artifacts offers a range of benefits that enhance security, reproducibility, and transparency. By leveraging blockchain’s decentralized and immutable nature, organizations can ensure the integrity and authenticity of their build artifacts, providing a robust foundation for their CI/CD processes.
As the software development landscape continues to evolve, embracing these cutting-edge technologies will be crucial for maintaining a competitive edge and ensuring the reliability and security of software deployments. By implementing immutable build artifacts, organizations can build a more secure and efficient CI/CD pipeline, paving the way for future innovations.
That post went as far as having a Kubernetes cluster up and running for local development. That was primarily focused on Mac, but once you reach the point of having a running Kubernetes Cluster with kubectl configured to talk to it, the hosting platform/OS makes little difference.
This second section takes a more detailed look at running Jenkins Pipelines inside the Kubernetes Cluster, and automatically provisioning Jenkins JNLP Agents via Kubernetes, then takes an in-depth look at what we can do with all of that, with a complete working example.
This post covers quite a lot:
Adding Helm to the Kubernetes cluster for package management
Deploying Jenkins on Kubernetes with Helm
Connecting to the Jenkins UI
Setting up a first Jenkins Pipeline job
Running our pipeline and taking a look at the results
What Next
Adding Helm to the Kubernetes cluster for package management
Helm is a package manager for Kubernetes, and like Minikube it is ideal for quickly setting up development environments, plus much more if you want to. Take a look through the Helm hub to see just some of the other things it can do.
On Mac you can use brew to install the local helm component:
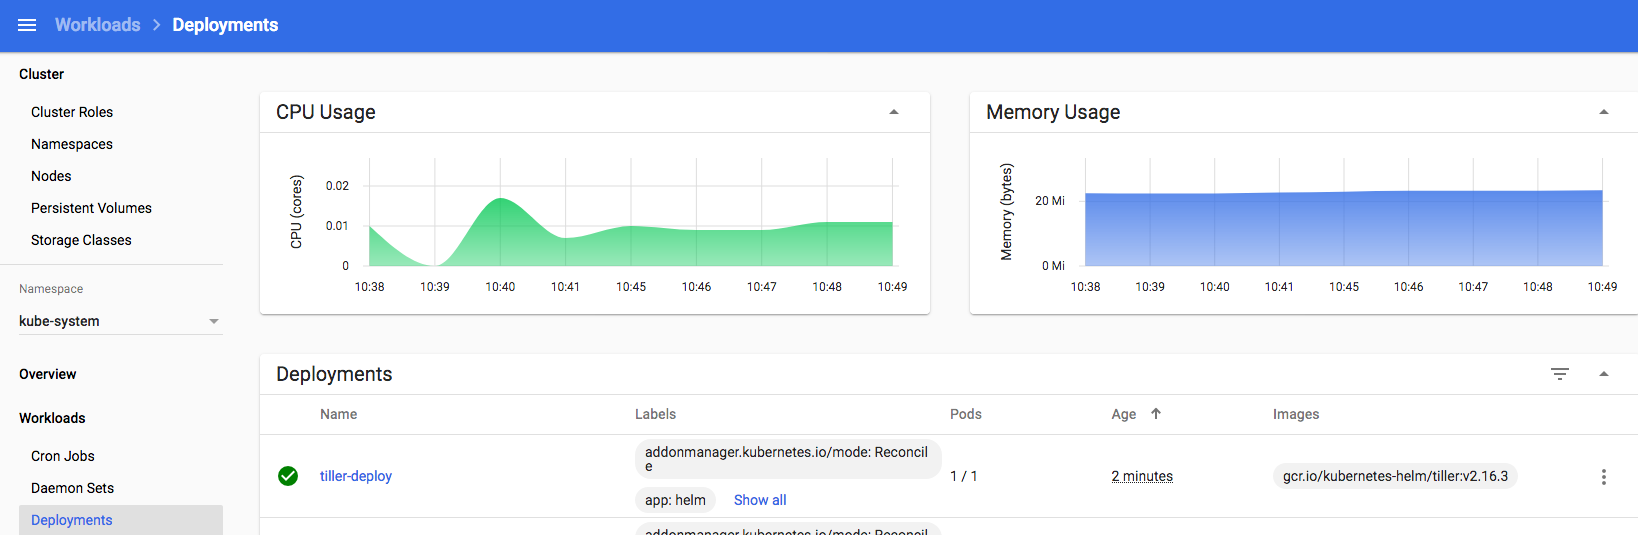
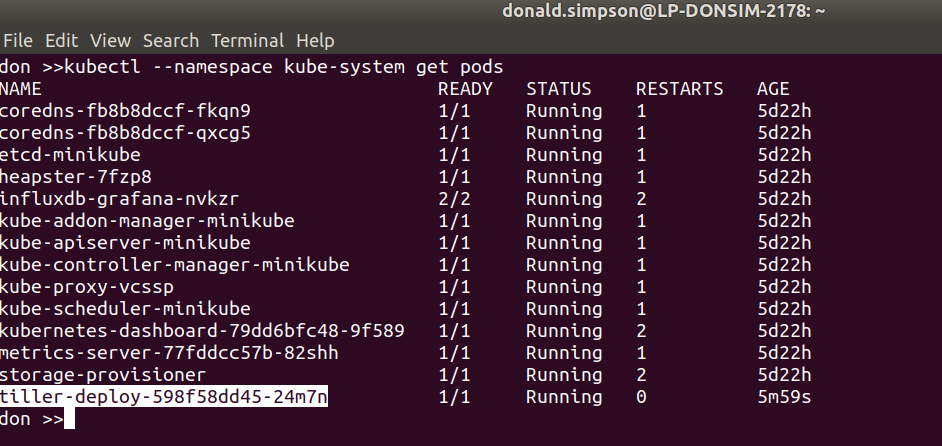
you should then see a tiller pod start up in your Kubernetes kube-system namespace:
Before you can use Helm we first need to initialise the local Helm client, so simply run:
helm init --client-only
as our earlier minikube addons command has configured the connectivity and cluster already. Before we can use Helm to install Jenkins (or any of the many other things it can do), we need to update the local repo that contains the Helm Charts:
helm repo update
Hang tight while we grab the latest from your chart repositories…
…Skip local chart repository
…Successfully got an update from the "stable" chart repository
Update Complete.
That should be Helm setup complete and ready to use now.
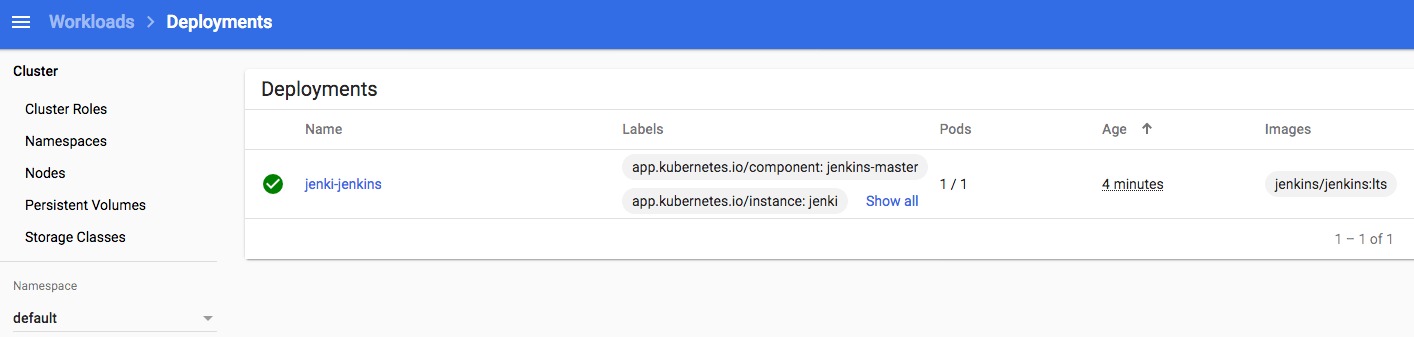
Deploying Jenkins on Kubernetes with Helm
Now that Helm is setup and can speak to our k8s instance, installing 100’s of software packages suddenly becomes very simple – including, Jenkins. We’ll just give the install a friendly name “jenki” and use NodePort to simplify the networking, nothing more is required for this dev setup:
obviously we’re skipping over all the for-real things you may want for a longer lived Jenkins instance, like backups, persistence, resilience, authentication and authorisation etc., but this bare-bones setup is sufficient for now.
Connect to the Jenkins UI
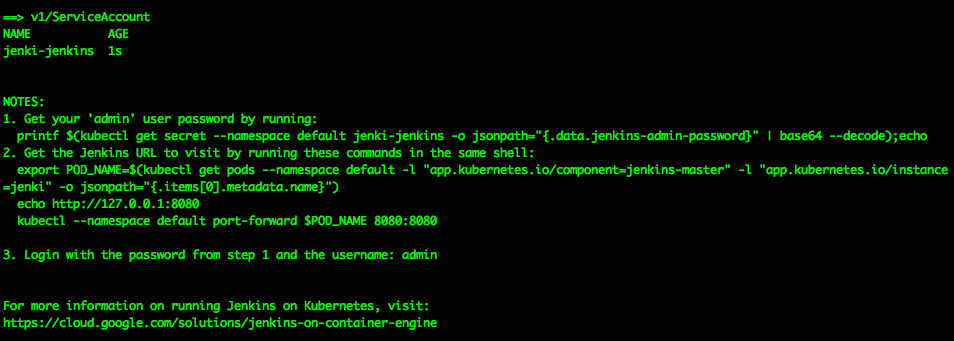
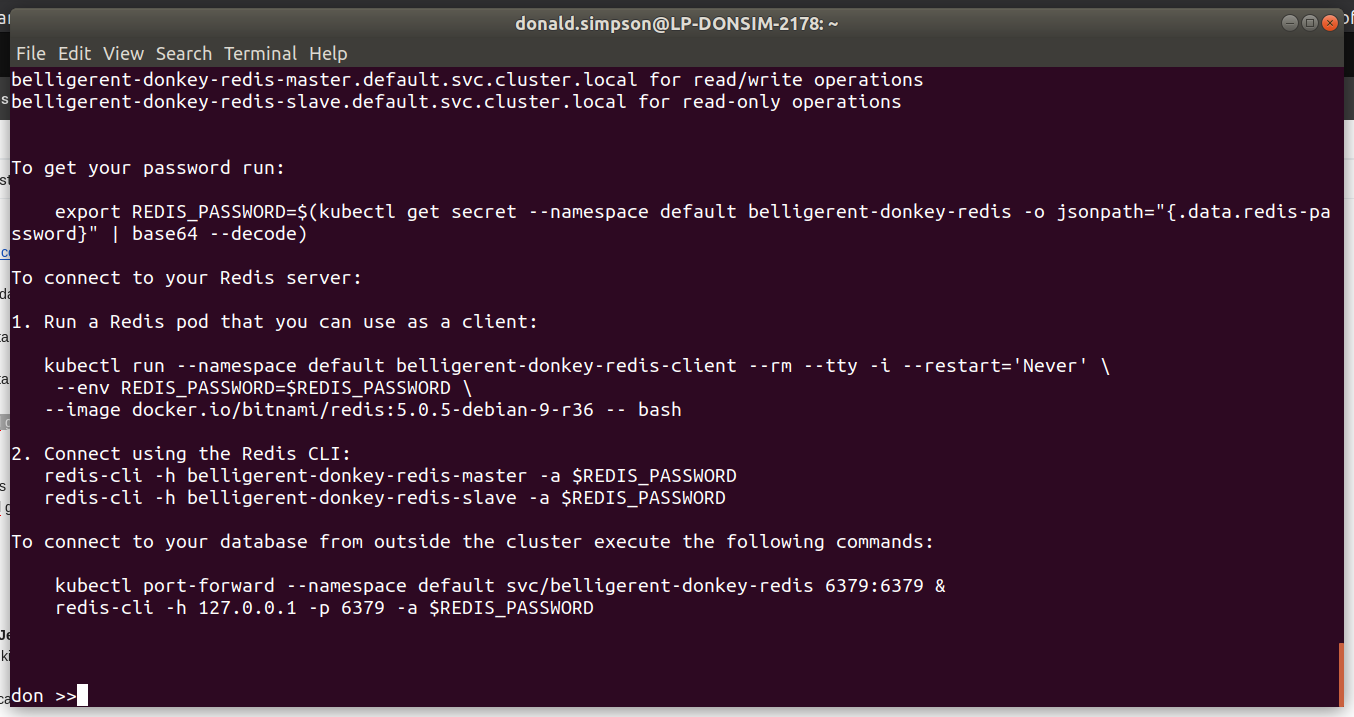
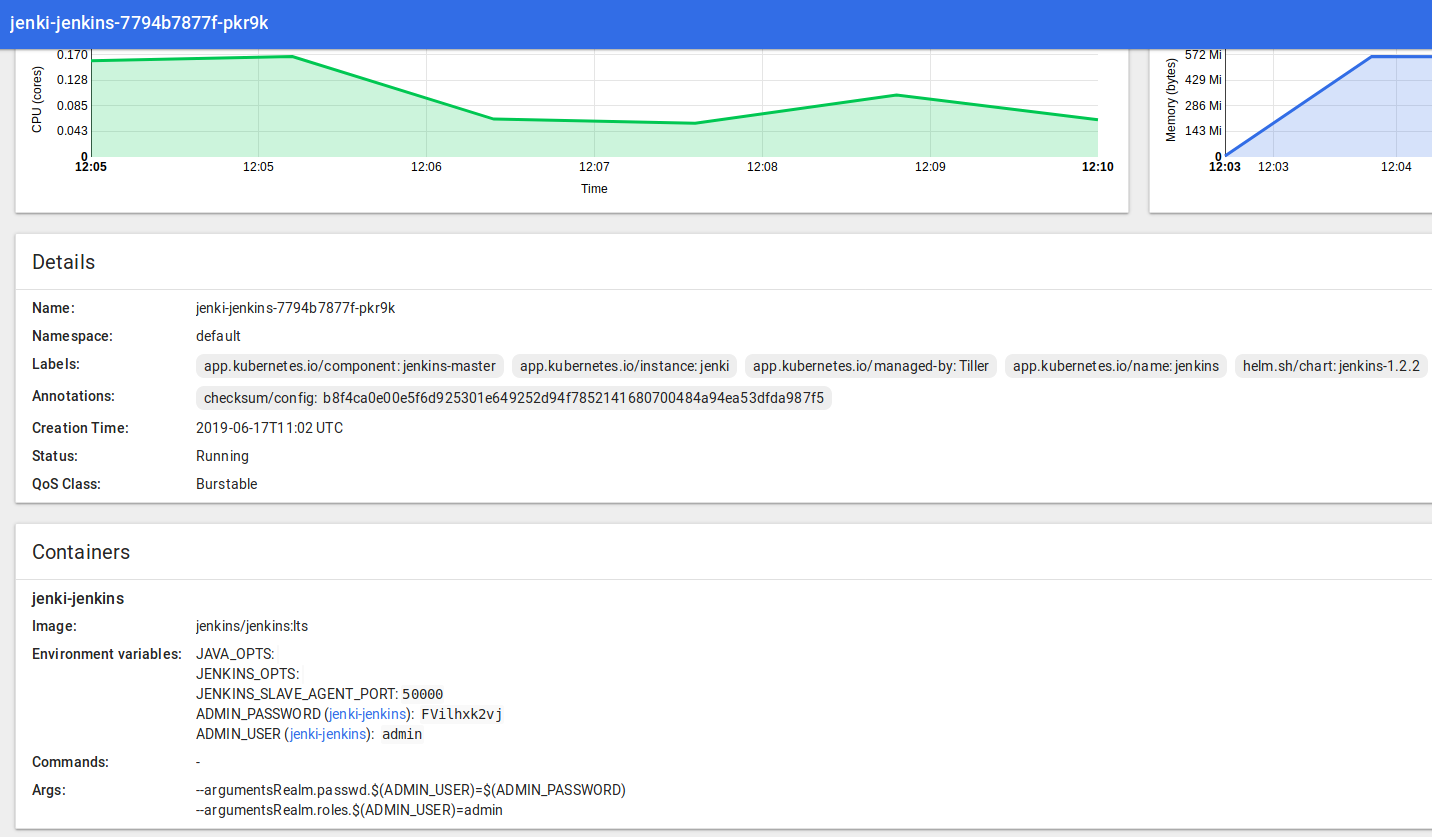
The Helm install should spit out some helpful info like this, explaining how to get the Jenkins Admin password and how to connect to the UI:
Get your ‘admin’ user password by running: printf $(kubectl get secret –namespace default jenki-jenkins -o jsonpath=”{.data.jenkins-admin-password}” | base64 –decode);echo
Get the Jenkins URL to visit by running these commands in the same shell: export POD_NAME=$(kubectl get pods –namespace default -l “app.kubernetes.io/component=jenkins-master” -l “app.kubernetes.io/instance=jenki” -o jsonpath=”{.items[0].metadata.name}”) echo http://127.0.0.1:8080 kubectl –namespace default port-forward $POD_NAME 8080:8080
Login with the password from step 1 and the username: admin
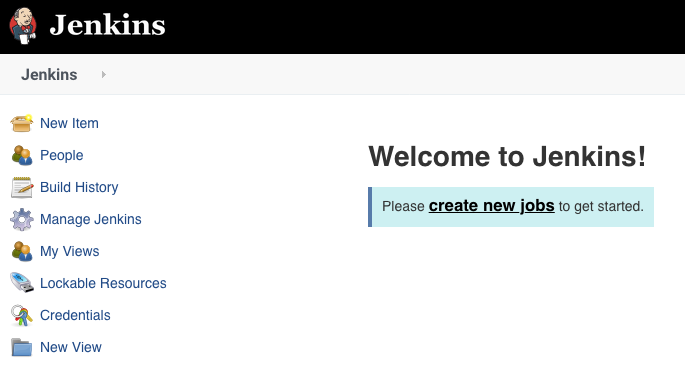
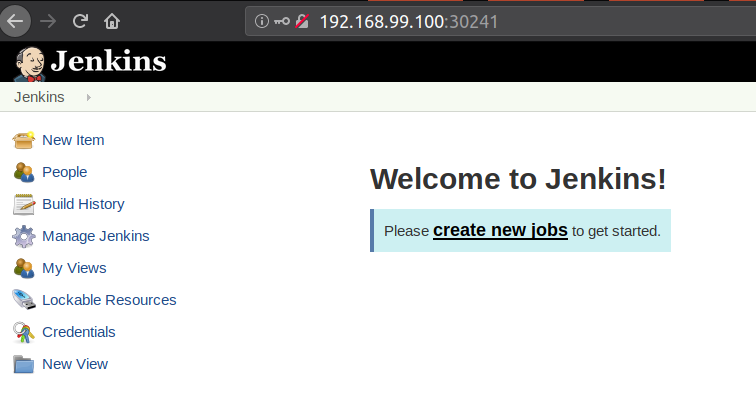
After following the steps to get the admin password and hit the Jenkins URL http://127.0.0.1:8080 in your desktop browser, you should see the familiar “Welcome to Jenkins!” page…
Pause a moment to appreciate that this Jenkins is running in a JVM inside a Docker container on a Kubernetes Pod as a Service in a Namespace in a Kubernetes Instance that’s running inside a Virtual Machine running under a Hypervisor on a host device….
turtles all the way down
there are many things I’ve skipped over here, including looking at storage, auth, security and all the usual considerations but the aim has been to quickly and easily get to this point so we can start developing the pipelines and processes we’re really wanting to focus on.
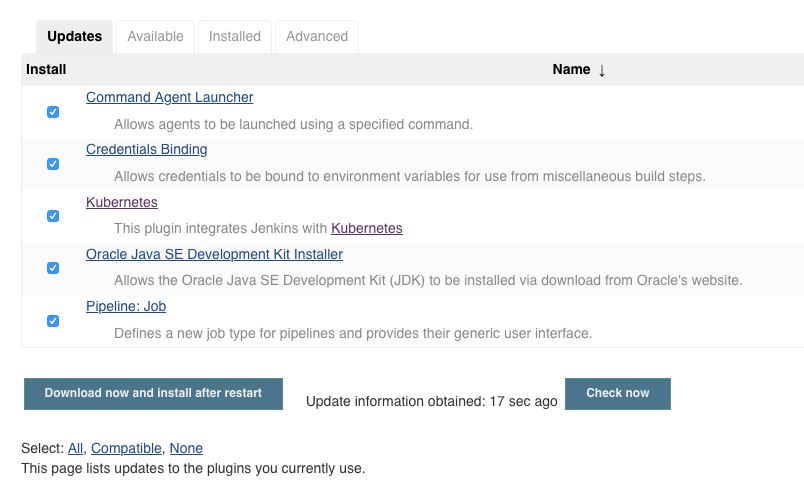
Navigating to Manage Jenkins then Plugins Manager should show some updates already available – this proves we have connectivity to the public Jenkins Update Centre out of the box. The Kubernetes Jenkins plugin is the key thing I’m looking for – select and update if required:
If you go to http://127.0.0.1:8080/configure you should see a link at the foot of the page to the new location for “Clouds”: http://127.0.0.1:8080/configureClouds/ – that should already be configured with sufficient settings for Jenkins to use your Kubernetes cluster, but it’s worthwhile taking a look through the settings and options there. No changes should be required here now though.
Setup a first Jenkins Pipeline job
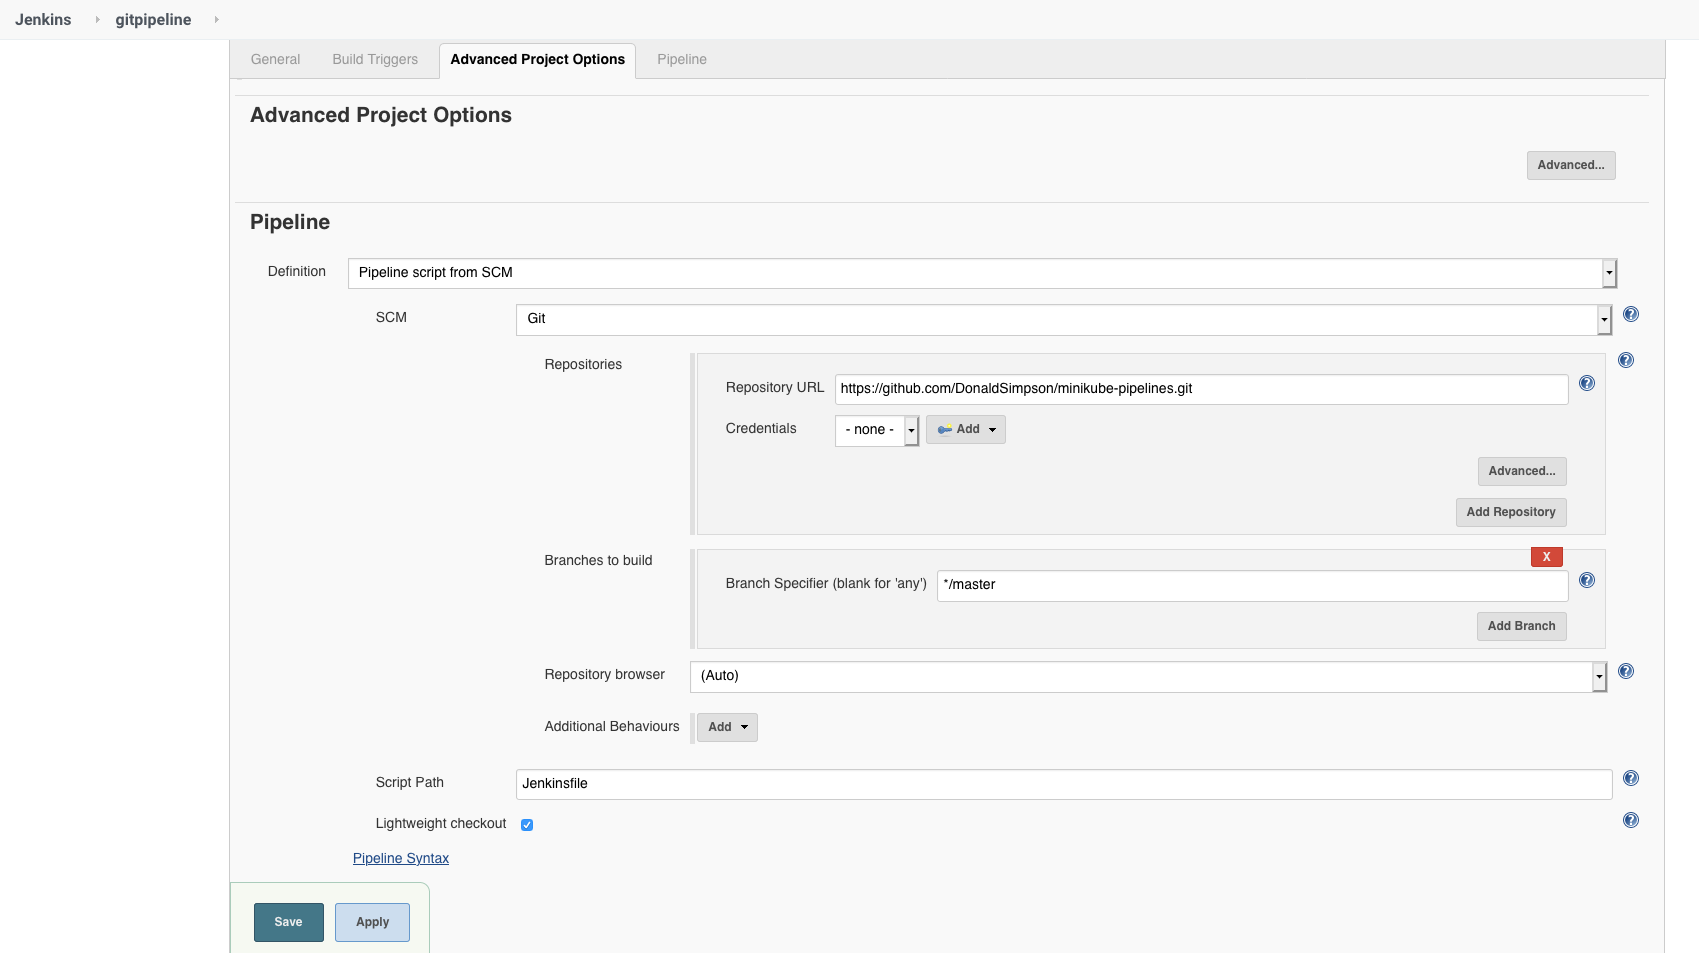
Create a new Jenkins Pipeline job and add the following settings as shown in the picture below…
In the job config page under “Pipeline”, for “Definition” select “Pipeline script from SCM” and enter the URL of this github project which contains my example pipeline code:
This file has been heavily commented to explain every part of the pipeline and shows what each step is doing. Taking a read through it should show you how pipelines work, how Jenkins is creating Docker Containers for the different Stages, and give you some ideas on how you could develop this simple example further.
Run it and take a look at the results
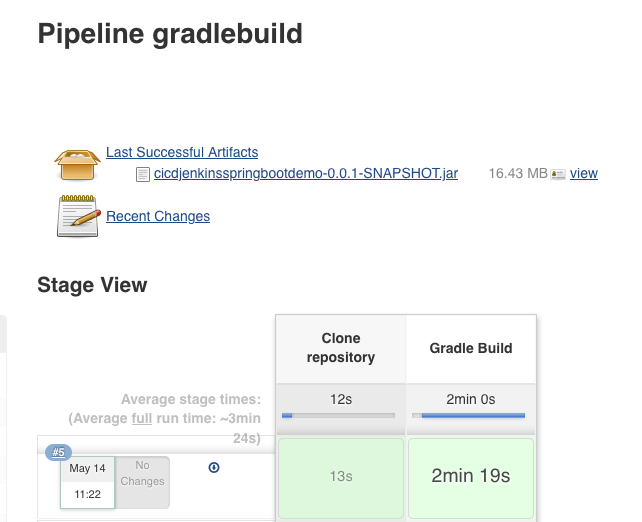
Save and run the job, and you should (eventually) see something like this:
The jobs Console Output will have a ton of info, showing everything from the container images being pulled, the git repo being cloned, the very verbose gradle build output and all the local files.
So in summary, what just happened?
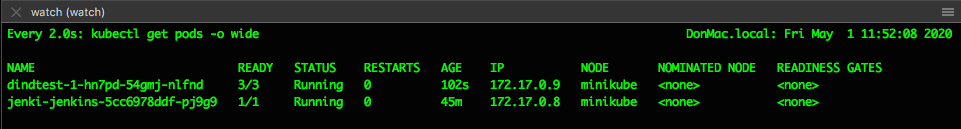
Jenkins connected to Kubernetes via the Kubernetes plugin and its settings
A gradle Docker container was started and connected as a Jenkins JNLP Agent, running as another k8s pod
The gradle build stage was run inside that gradle container, using the source files checked out from git in the previous Stage
The newly built JAR file was archived so we could use it later if wanted
The pipeline ends, and k8s will clean up the containers
This pipeline could easily be expanded to run that new JAR file as an application as demonstrated here: https://github.com/AutomatedIT/springbootjenkinspipelinedemo/blob/master/Jenkinsfile#L5, or, you could build a new Docker image containing this version of the JAR file and start that up and test it and so on. You could also automate this so that whenever the source code is changed a build is triggered that does all of this automatically and records the result… hello CI/CD!
What next?
From the above demo you can hopefully see how easy it is to create an end to end pipeline that will automatically provision Jenkins Agents running on Kubernetes for you.
You can use this functionality to quickly and safely develop pipeline processes like the one we have examined, that run across multiple Agents, using each for a particular function/step in your workflow, leaving the provisioning and housekeeping work to the underlying Kubernetes cluster. With this, you can build or pull docker images, run them, test them, start them up as other Jenkins JNLP Agents and so on, all “as code” and all fully automated.
And after all that… ?
Being able to fire up Docker containers and use them as Jenkins Agents running on a Kubernetes platform is extremely powerful in itself, but you can go a step further and start using this setup to build, deploy and manage Kubernetes resources directly, too – from Jenkins Pipelines running on the same Kubernetes Cluster – or even from one Kubernetes to another.
We’ve seen during setup that we can use kubectl to manage the k8s cluster and its components – we can also do that from within containers and stages in our pipelines, wherever they are.
and contains an example pipeline and supporting files to build, lint, security scan, push to registry, deploy to Kubernetes, run, test and clean up the example “doncoin” application via a Jenkins pipeline running on Kubernetes.
It also includes outlines and suggestions for expanding things even further, in to a more mature and production-ready setup, introducing things like Jenkins shared libraries, linting and testing, automating vulnerability scanning within the pipeline, and so on.
Helm and Tiller – what they are, when & why you’d maybe use them
Helm and Tiller – prep, install and Helm Charts
Deploying Jenkins via Helm Charts
and WordPress w/MariaDB too
Wrap up
The below are mostly my technical notes from this session, with some added blurb/explanation.
Helm and Tiller – what they are, when & why you’d maybe use them
From the Helm site:
“Helm helps you manage Kubernetes applications — Helm Charts help you define, install, and upgrade even the most complex Kubernetes application. Charts are easy to create, version, share, and publish — so start using Helm and stop the copy-and-paste.”
Helm is basically a package manager for Kubernetes applications. You can choose from a large list of Stable (or not so!) ready made packages and use the Helm Charts to quickly and easily deploy them to your own Kubernetes Cluster.
This makes light work of some very complex deployment tasks, and it’s also possible to extend these ready-made charts to suit your needs, and to write your own Charts from scratch, or pass your own values to override default ones, or… many other interesting options!
For this session we are looking at installing Helm, reviewing some example Helm Charts and deploying a few “vanilla” ones to the cluster we created in the first half of the session. We also touch upon the life-cycle of Helm Charts – it’s similar to dockers – and point out some of the ways this could be extended and customised to suit your needs – more on this at a later date hopefully.
Helm and Tiller – prep, install and Helm Charts
First, installing Helm – it’s as easy as this, run on your laptop/host that’s running the Minikube k8s we setup earlier:
Tiller is the client part of Helm and is deployed inside your k8s cluster. It’s set to be removed with the release of Helm 3, but the basic functionality wont really change. More details here https://helm.sh/blog/helm-3-preview-pt1/
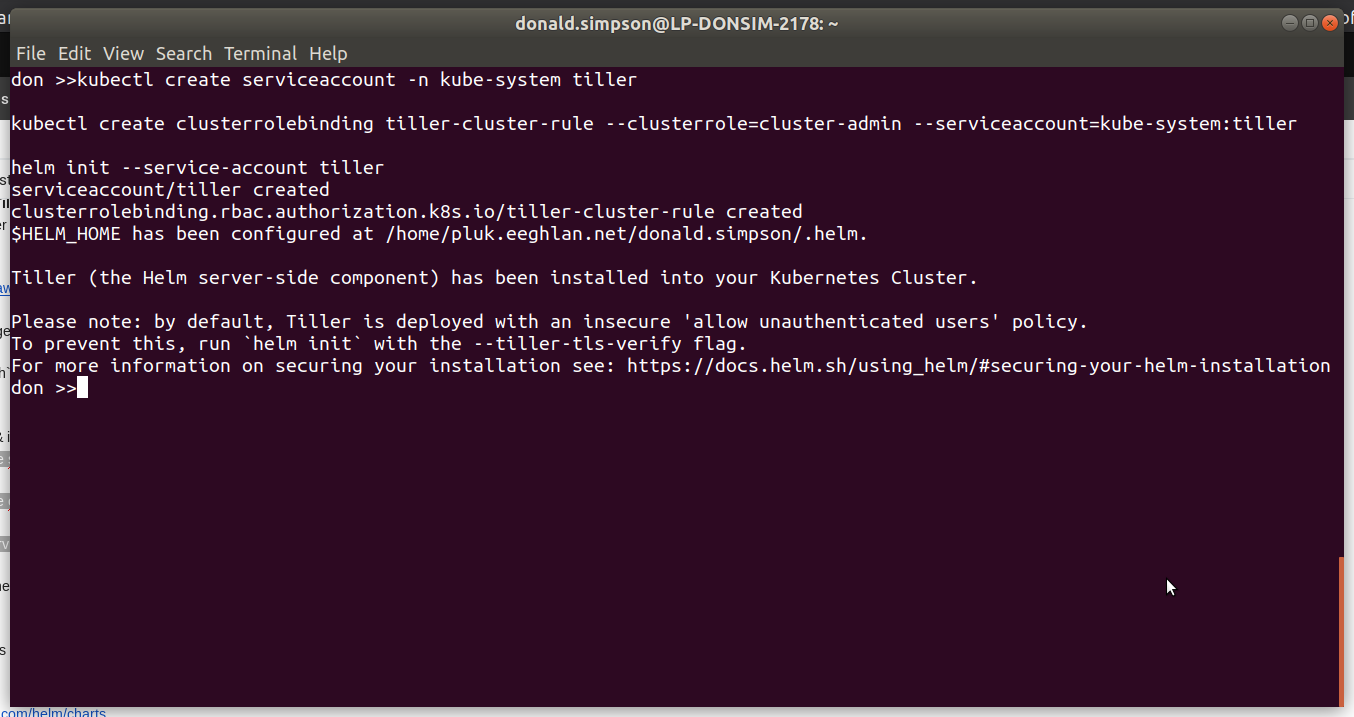
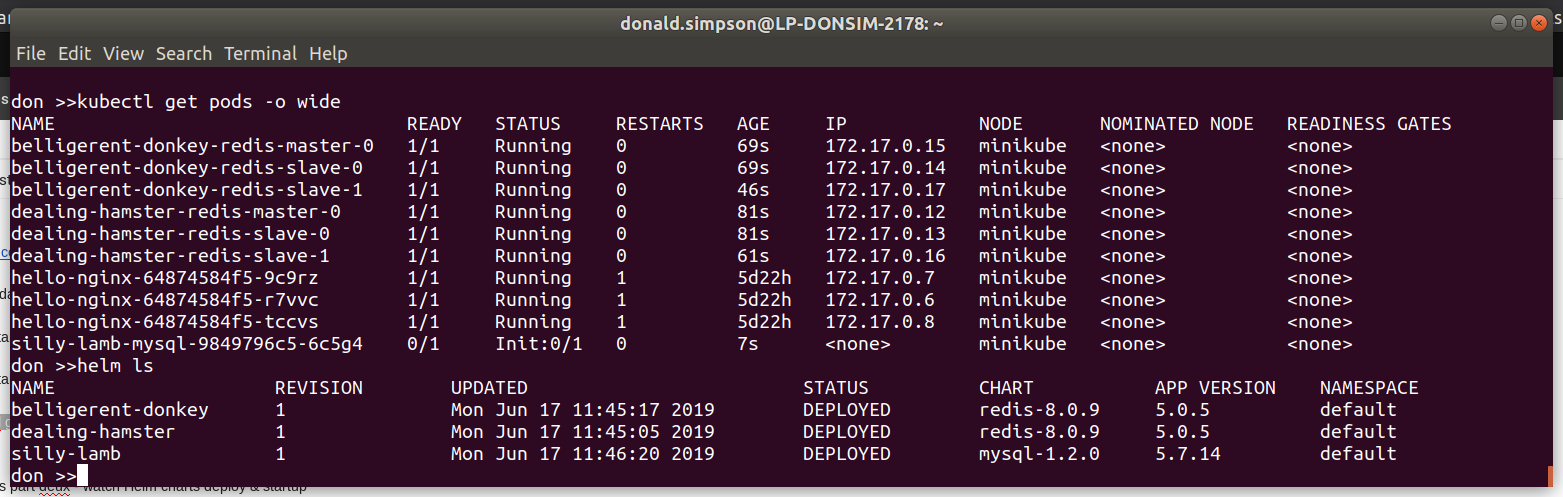
Next we do the Tiller prep & install – add RBAC for tiller, deploy via helm and take a look at the running pods:
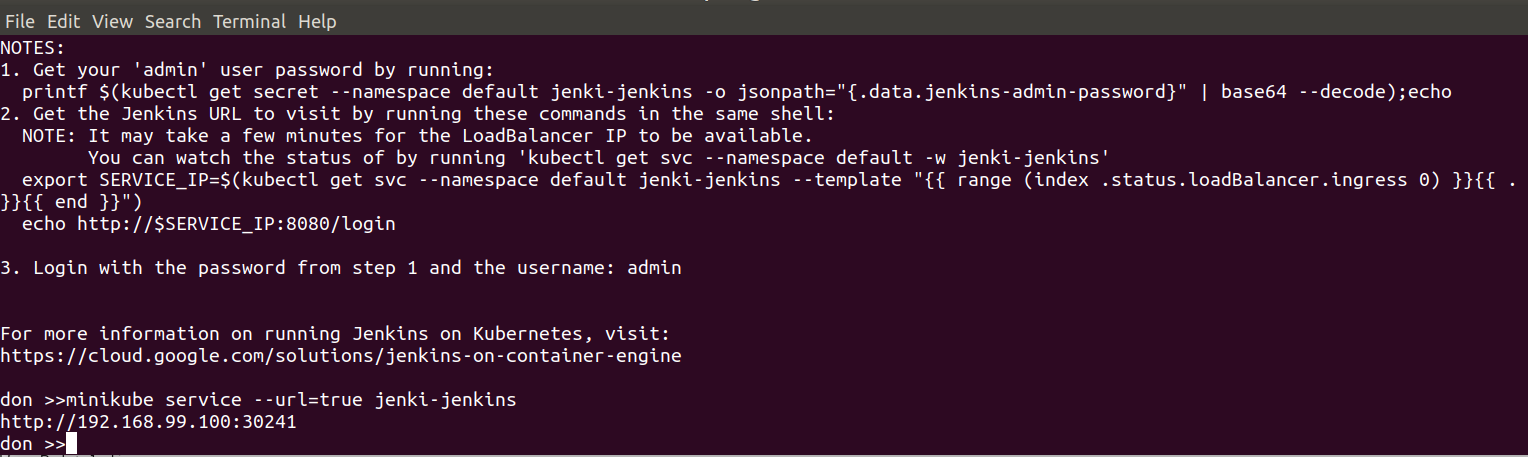
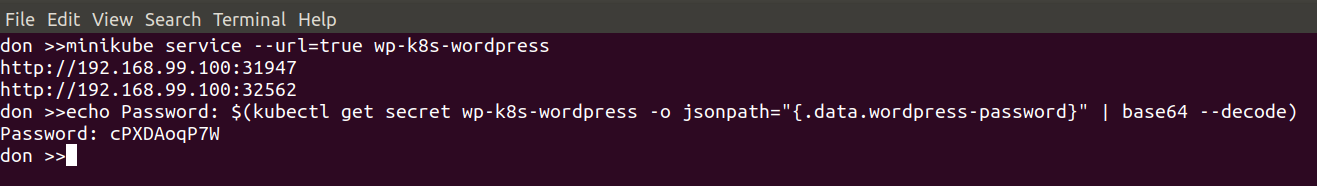
now get the URL for the Jenkins service from Minikube:
minikube service --url=true jenki-jenkins
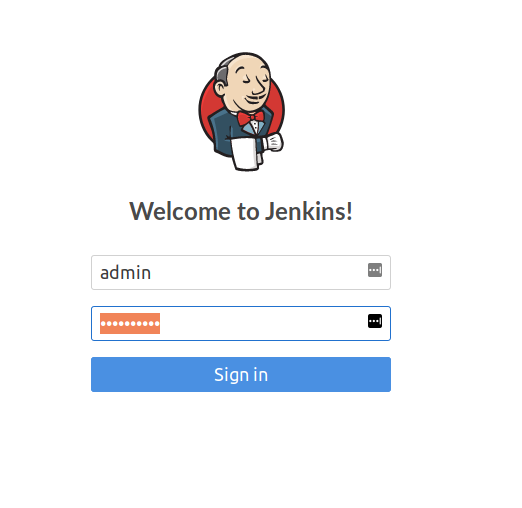
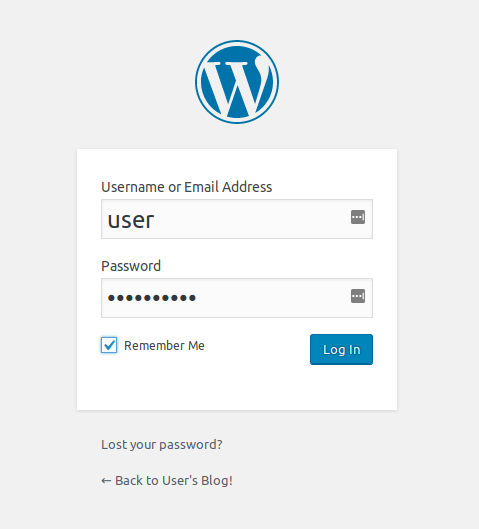
Hit that URL in your browser, and grab the password in UI from Pods > Jenki and log in to Jenkins with the user “admin”:
That’s a Jenkins instance deployed via Helm and Tiller and a Helm Chart to our Kubernetes Cluster running inside Minikube via a VirtualBox VM… all done in a few minutes. And it’s all customisable, repeatable, highly scaleable and awesome.
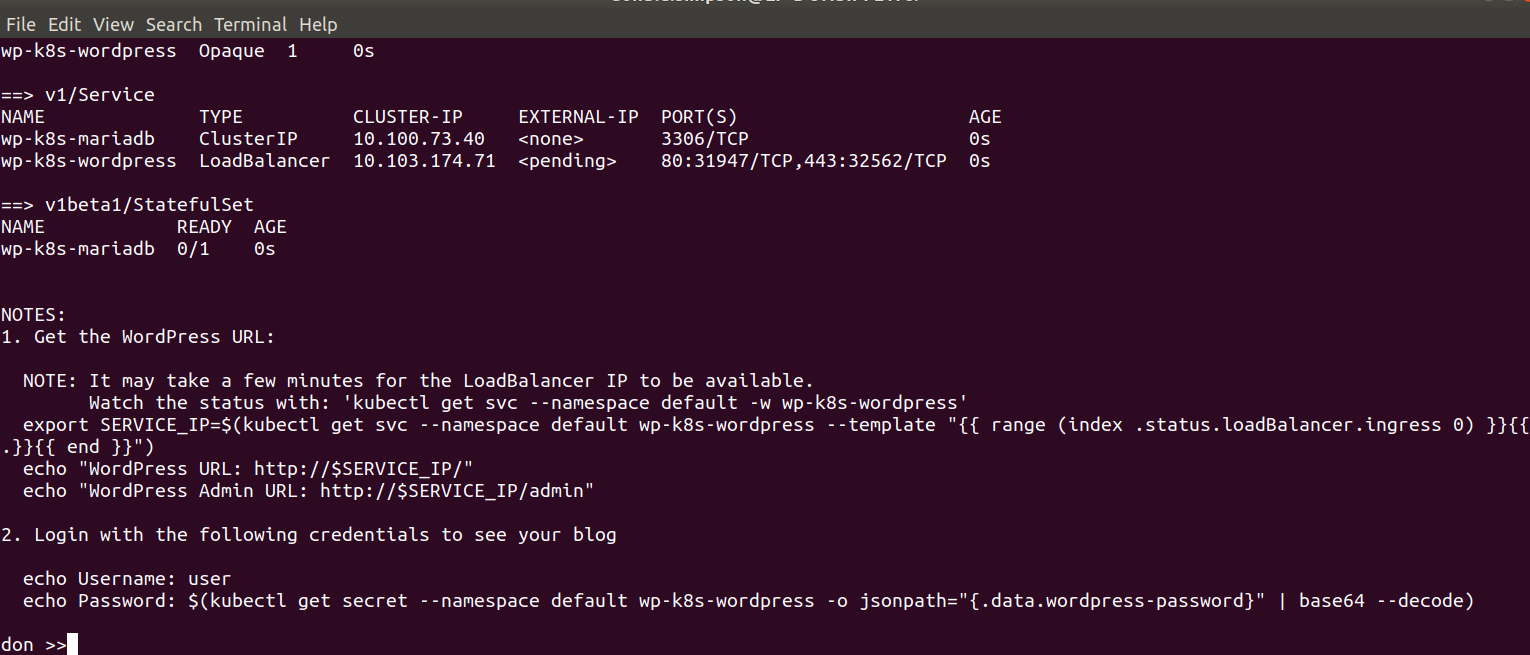
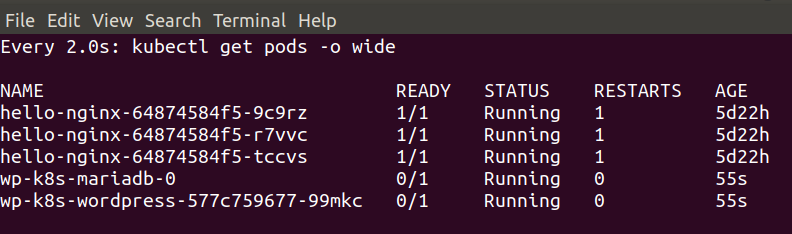
and WordPress w/MariaDB too
This was the “bonus demo” if my laptop wasn’t on fire – and thanks to some rapid cleaning up it managed fine – showing how quickly we could deploy a functional WordPress with MariaDB backend to our k8s cluster using the Helm Chart.
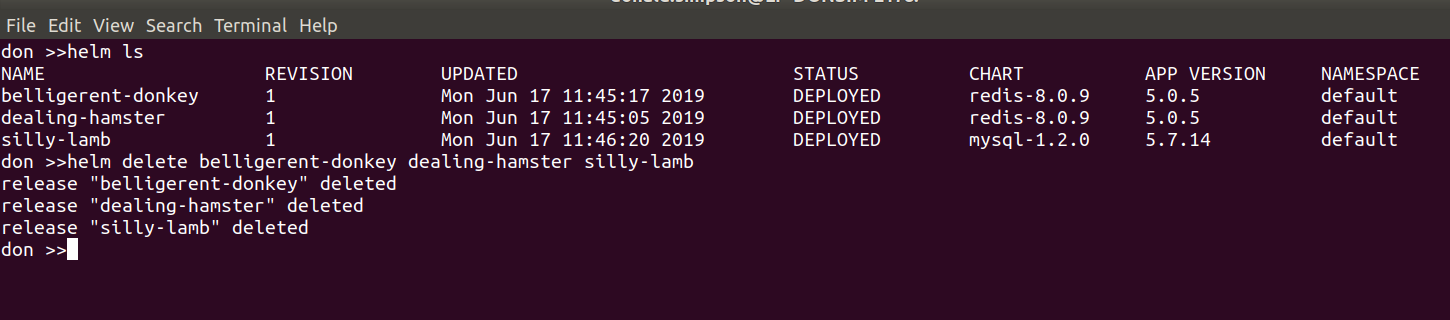
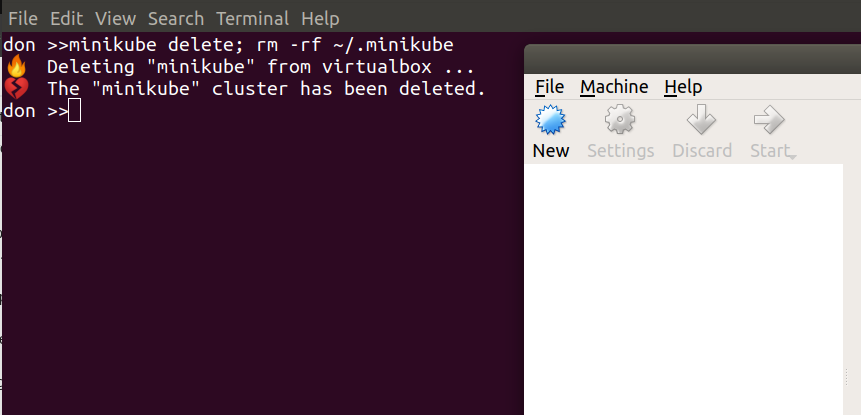
To prepare for this I did a helm ls to see all the things I had running. then helm delete --purge jenki, gave it a while to recover then had to do
kubectl delete pods <jenkinpod>
before starting the WordPress Chart deployment with
That’s it – we covered a lot in this session, and plan to use this as a platform to explore Helm in more detail later, writing our own Helm Charts and providing our own customisations to them.
Update: this follow-on post runs through setting up Jenkins with Helm then creating Jenkins Pipelines that dynamically provision dockerised Jenkins Agents:
This post runs through the steps required to start using Global Pipeline Libraries in your Jenkins Pipelines.
There are many reasons you may want to use this functionality, the main attraction for me is to provide centralised libraries that perform common functions for multiple instances of Jenkins. This removes a lot of complexity from the pipelines and also reduces code repition; for example, you may have 10 Jenkins instances all performing the same general task, each using slightly diferent code. If you want to update how this task is done, you may have to find and update each instance. Alteratively, using this approach, you can update the central version and know that all of your Jenkins Pipelines that consume it will be udpated.
There are many posts about these all over the ‘net, but they mostly seemed overly complex, too specific and none too helpful to me – I just wanted to know how to get the most basic example possible working quickly on my dev Jenkins instance, so I could see how they work in practice and take it from there.
That’s what this post covers – getting a simple “Hello World” type example library published and made available in Jenkins, then calling it very easily from within a Pipeline job with the expected results. More detail and advanced usage to come later… these are a very powerful addition to Jenkins pipelines and once you see how they work, you may also see benefits to migrating some of your common tasks over to them.
This is done in three simple and logical steps:
Create a Library and Publish it
Tell Jenkins about your nice new library
Calling the Global Library from my Jenkins Pipeline
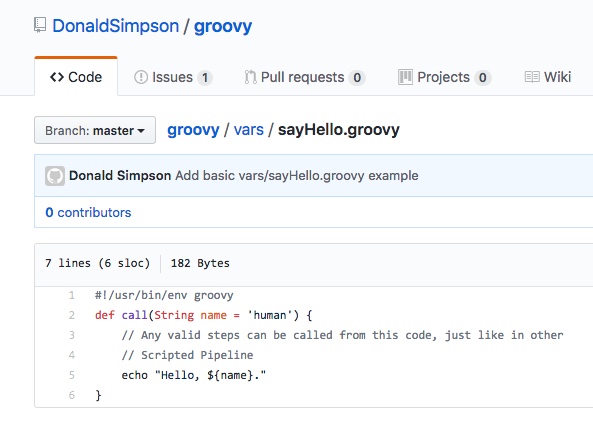
That’s all that’s needed for this most-basic example – here is the code in plain text, as taken from the guide here:
#!/usr/bin/env groovy
def call(String name = 'human') {
    // Any valid steps can be called from this code, just like in other
    // Scripted Pipeline
    echo "Hello, ${name}."
}
It is important to note that the file is in a “vars” directory, this is the naming convention Jenkins expects to find your groovy libraries within, and is best followed.
A. Note
Next step is to:
Tell Jenkins about your nice new library
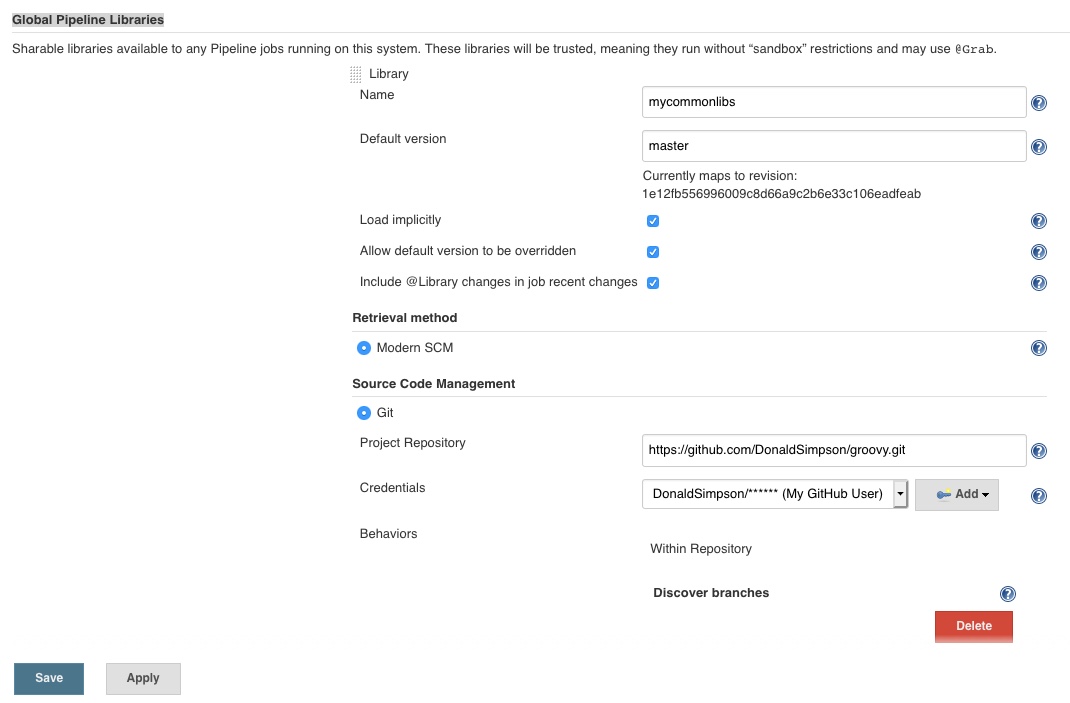
This is done by going to Manage Jenkins then Configure System, then scrolling down to Global Pipeline Libraries and defining a new instance of one, just like this:
The settings used here are:
Name: mycommonlibs // any “friendly” name you’d like to reference these libraries by
Default version: master // or use a branch or version number if you prefer
I then checked the three tick boxes, especially the Load implicitly which removes the need to load Libraries explicitly in your Jenkinsfile (you can do this, and it may be very useful depending on your needs, but I want simple and easy for now).
The final section tells Jenkins where this Library is:
That is all that is needed to set up a Library and tell Jenkins all about it.
Note that anyone with write access to the location of your defined Libraries will effectively have full access to your Jenkins instance – if they can update the code that’s being run…
W. Arning
And finally, it’s time for a test drive…
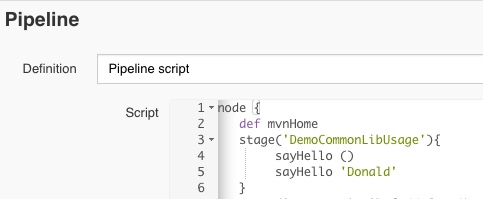
Calling the Global Library from my Jenkins Pipeline:
    sayHello ()
    sayHello 'Donald'
To end up with a mega-basic Pipeline that looks like this:
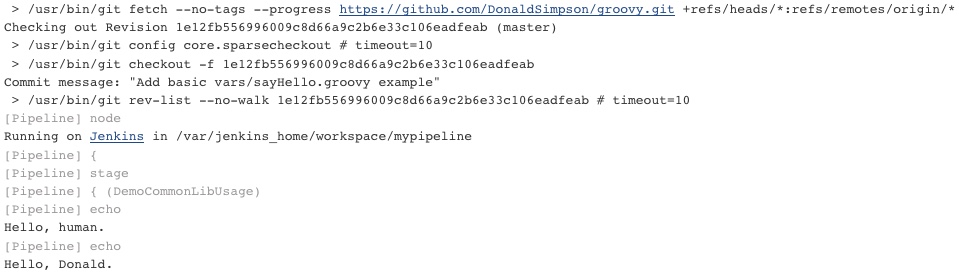
When this Jenkins Pipeline job is run, it generates the following output:
Summary
Which as you can see means that Jenkins has pulled in the Shared Library from GitHub, resolved and called the sayHello() method from the remote common library, called it again with a passed parameter (‘Donald‘) and produced the expected results. Yay. How neat and how easy was that?
There’s a whole lot more you can do with Global Pipeline Libraries in Jenkins. From this point you can easily add complexity and functionality to build up a library of powerful and useful utilities that will greatly improve the quality and manageability of your Pipelines. I generally start by finding common tasks and patterns and externalise those to shared libraries.
I plan to expand on some of these points in a later post, but hopefully this shows how to quickly and easily start using them.
Deploying Openshift to AWS with HashiCorp Terraform and Ansible
Tuesday, Oct 16, 2018, 6:15 PM
HAYS 7 Castle St, Edinburgh EH2 3AH Edinburgh, GB
30 Members Went
In this session we look at Infrastructure as Code and Configuration as Code, as we demonstrate how to use these approaches to deploy RedHat OpenShift to AWS with HashiCorp Terraform and Ansible. We start off with configuring AWS credentials, then use HashiCorp Terraform to create the AWS infrastructure needed to deploy and run our own RedHat OpenSh…
Hays office on the 2nd floor
7 Castle St, Edinburgh EH2 3AH · Edinburgh
What:
Deploying Openshift to AWS with HashiCorp Terraform and Ansible
Agenda:
In this session we look at Infrastructure as Code and Configuration as Code, as we demonstrate how to use these approaches to deploy RedHat OpenShift to AWS with HashiCorp Terraform and Ansible.
We start off with configuring AWS credentials, then use HashiCorp Terraform to create the AWS infrastructure needed to deploy and run our own RedHat OpenShift cluster.
We then go through using Ansible to deploy OpenShift to AWS, followed by a review of the Cluster, then take a quick look at troubleshooting any issues you may encounter.
There will be a break in the middle for beer & pizza courtesy of Hays, and we will wrap things up with a quick Q&A and feedback session.
If you would like to bring your own laptop and follow along, please do!
Who:
Intermediate Linux and some AWS knowledge is useful but not essential.
Automated IT Solutions are running a new Meetup in Edinburgh on Friday 18th May, check out the details and register for this free session here – beer, pizza and free HashiCorp stickers included!:
Vagrant from scratch to LAMP stack
Friday, May 18, 2018, 6:15 PM
HAYS 7 Castle St, Edinburgh EH2 3AH Edinburgh, GB
18 Members Attending
Automated IT Solutions are presenting a session on HashiCorp Vagrant: “from scratch to LAMP stack” by Adam Cheney. In this session you will learn: – Vagrant basics, introduction and usage – How to install and configure Vagrant – Provisioning VMs with Vagrant and Ansible followed by a live demonstration/workshop of building a LAMP stack within Vagra…
This post is the first in a series of 3 introducing the combined power of Jenkins, Docker, and the Jenkins DSL.
They should hopefully provide enough information to get to grips with both Docker and Jenkins – what they both do and how to use them – by showing some practical examples of them working together.
The first step, if you haven’t already, is to download and install Docker on your platform – the Docker website covers this in good detail for most platforms…
Once that’s done, you can try it out with the customary “Hello World” example…
I’m running Docker on an Ubuntu VM, but the commands and the results are the same regardless of platform – that’s one of the main Docker concepts.
You can then check which processes (docker containers) are running using the “docker ps” command – in my example you can see that there’s one Jenkins image running. If you run “docker ps -a” you will see all containers (including stopped ones, of which I have a few on this host):
and you can check your Docker version with:
root@ubuntud:~# docker --version
Docker version 1.13.0, build 49bf474
Now that the basic setup is done, we can move on to something a little more interesting – downloading and running a “Dockerised” Jenkins container.
I’m going to use my own Dockerised Jenkins Image, and there will be more detail on that in the next post – you’re welcome to try it out too, just run this command in your terminal:
docker run -d -p 8080:8080 donaldsimpson/dockerjenkins
if you don’t happen to have my docker image cached locally (like I do) then docker will automatically download it for you from Docker Hub then run it:
That command did a quite few important things, here’s a quick explanation of them all:
docker run -d
tells docker that we want to run the container in the background so that we can carry on and do other things while it runs. The alternative is -it, for an interactive/foreground session.
docker run -d -p 8080:8080
The -p 8080:8080 tells docker to map port 8080 on the local host to port 8080 in the running container. This means that when we visit localhost:8080 the request will be passed through to the container.
docker run -d -p 8080:8080 donaldsimpson/dockerjenkins
and finally, we have the namespace and name of the Docker image we want to run – my “donaldsimpson/dockerjenkins” one – more on this later!
You can now visit port 8080 on your Docker host and see that Jenkins is up and running….
That’s Jenkins up and running and being happily served from the Docker container that was just pulled from Docker Hub – how easy was that?!
And the best thing is, it’s entirely and reliably repeatable, it’s guaranteed to work the same on all platforms that can run Docker, and you can quickly and easily update, delete, replace, change or share it with others! Ok, that’s more than one thing, but the point is that there’s a lot to like here 🙂
That’s it for this post – in the next one we will look in to the various elements that came together to make this work – the code and configuration files in my Git repo, the automated build process on Docker Hub that builds and updates the Docker Image, and how the two are related.
Find out how to interact with Jenkins from within Eclipse, NetBeans, and IntelliJ IDEA
Develop custom solutions that act upon Jenkins information in real time
A step-by-step, practical guide to help you learn about extension points in existing plugins and how to build your own plugin
Who This Book Is For
This book is aimed primarily at developers and administrators who are interested in taking their interaction and usage of Jenkins to the next level.
The book assumes you have a working knowledge of Jenkins and programming in general, and an interest in learning about the different approaches to customizing and extending Jenkins so it fits your requirements and your environment perfectly.
Table of Contents
1: Preparatory Steps
2: Automating the Jenkins UI
3: Jenkins and the IDE
4: The API and the CLI
5: Extension Points
6: Developing Your Own Jenkins Plugin
7: Extending Jenkins Plugins
8: Testing and Debugging Jenkins Plugins
9: Putting Things Together
What You Will Learn
Retrieve and act upon Jenkins information in real time
Find out how to interact with Jenkins through a variety of IDEs
Develop your own Form and Input validation and customization
Explore how Extension points work, and develop your own Jenkins plugin
See how to use the Jenkins API and command-line interface
Get to know how to remotely update your Jenkins configuration
Design and develop your own Information Radiator
Discover how Jenkins customization can help improve quality and reduce costs
In Detail
Jenkins CI is the leading open source continuous integration server. It is written in Java and has a wealth of plugins to support the building and testing of virtually any project. Jenkins supports multiple Software Configuration Management tools such as Git, Subversion, and Mercurial.
This book explores and explains the many extension points and customizations that Jenkins offers its users, and teaches you how to develop your own Jenkins extensions and plugins.
First, you will learn how to adapt Jenkins and leverage its abilities to empower DevOps, Continuous Integration, Continuous Deployment, and Agile projects. Next, you will find out how to reduce the cost of modern software development, increase the quality of deliveries, and thereby reduce the time to market. We will also teach you how to create your own custom plugins using Extension points.
Finally, we will show you how to combine everything you learned over the course of the book into one real-world scenario.
In Part I, Information Radiators, I covered what they are, what the main benefits are, and the approach I usually use to set them up. This post goes in to more technical detail on how I extract this data from Jenkins.
My usual setup/architecture for Jenkins Information Radiators goes something along these lines:
TV screens running Mozilla Firefox or Google Chrome in Kiosk Mode, and Tab Mix Plus set up to rotate tabs (if required)
JSP Pages served via Tomcat on Linux server (which also runs the data extracting script described below)
MySQL database on Linux server – contains tables with data pulled from Jenkins and other sources, and the config data too (which URL’s to monitor)
And you’ll need some Jenkins instances/jobs to monitor too, obviously 🙂
The Jenkins XML API is very useful for automating tasks like this – if you simply append “/api/xml” to a
Jenkins job URL, it will serve up an XML version – note there is also a JSON API and a CLI and plenty of other options, but I’m using what suits me.
The Jenkins XML API
For example, if you go to one of your Jenkins jobs and add /api/xml like this:
That XML contains loads of very useful information inside handy XML tag descriptions – you just need a way to get at that data and then you can present it as you like…
XPAth queries and the Jenkins XML API
so to automate that, I used to extend that approach a to query Jenkins via the XML API using XPAth queries to bring back just the data I actually wanted, quite like querying a database.
For example, wget’ing this URL would return just the current value of the <building> tag in the above XML:
e.g. “true” or “false” – this was very useful and easy to do, but the functionality was removed/disabled in recent versions of Jenkins for security reasons, meaning that my processes that used it needed rewritten 🙁
Extracting the data – Plan B…
So, here’s the new solution I went for – the real scripts/methods do some error handling and cleaning up etc but I’m just highlighting the main functions and the high level logic behind each of them here;
get_url’s method:
query a table in MySQL that contains a list of the job names and URL’s to monitor
for each $JOB_NAME found, it calls the get_file method, passing that the URL as a parameter.
get_file method:
this takes a URL param, and uses curl to fetch and save the XML data from that URL to a temporary file (“xmlfile”):
curl -sL "$1" | xmllint --format - > xmlfile
Note I’m using “xmllint –format” there to nicely format the XML data, which makes processing it later much easier.
get_data method:
this first calls “get_if_building” (see below) to see if the job is currently running or not, then it does:
TRUE_VAR="true"
 if [[ "$IS_BUILDING" == "$TRUE_VAR" ]]; then
 RESULT_TEXT="building..."
 else
 RESULT_TEXT=`grep "result>" xmlfile | awk -F\> '{print $2}' | awk -F\< '{print $1}'`
 fi
get_if_building method:
this simply checks and sets the IS_BUILDING var like so:
My script then updates the MySQL database with the results from each check: success/failure, date, build number, user, change details etc
I then have JSP pages that read data from that table, and translate things like true/false in to HTML that sets the background colours (Red, Amber, Green), and shows the appropriate blocks and details per job.
If you have a few browsers/TV’s or Monitors showing these strategically placed around the office, developers get rapid feedback on the result of their code changes which speeds up development, increases quality and reduces development time and costs – and they can be fun to watch and set up too 🙂