Previous related posts:
- Kubernetes – setting up the hosts
- Kubernetes – from cluster reset to up and running
- Kubernetes – adding Helm and Tiller and deploying a Chart
- Kubernetes – adding persistent storage to the Cluster
- Kubernetes – Operators for monitoring with Prometheus and Grafana dashboards
Introduction/background
It’s pretty easy to deploy a functional Kubernetes dashboard to a Kubernetes Cluster, either using the stable Helm Chart or the official Kubernetes Dashboard project directly.
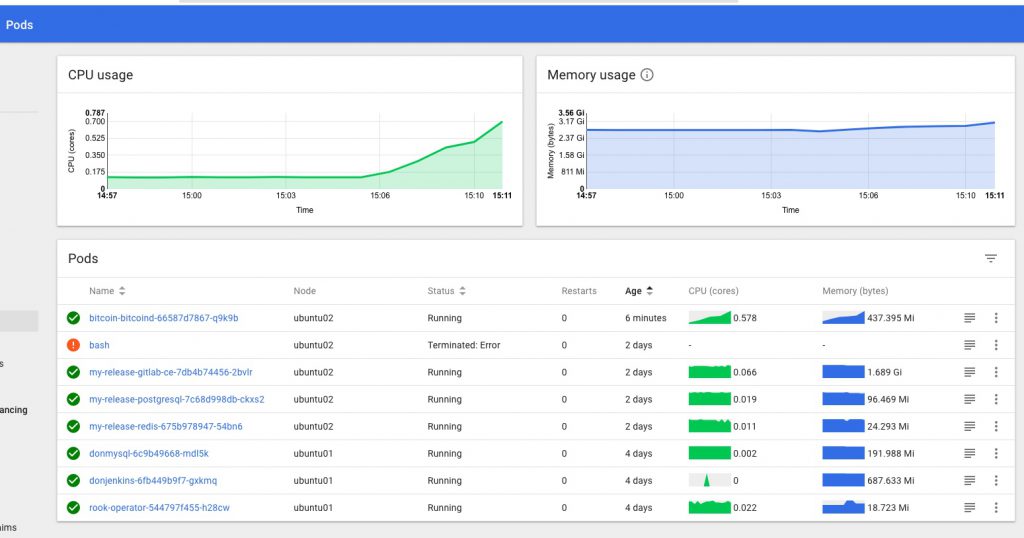
What was a little trickier, was getting live stats for my cluster – cpu and mem load etc – to show up inside the dashboard, so that you can see the status of the various deployments and pods on your cluster at a glance from one central location.
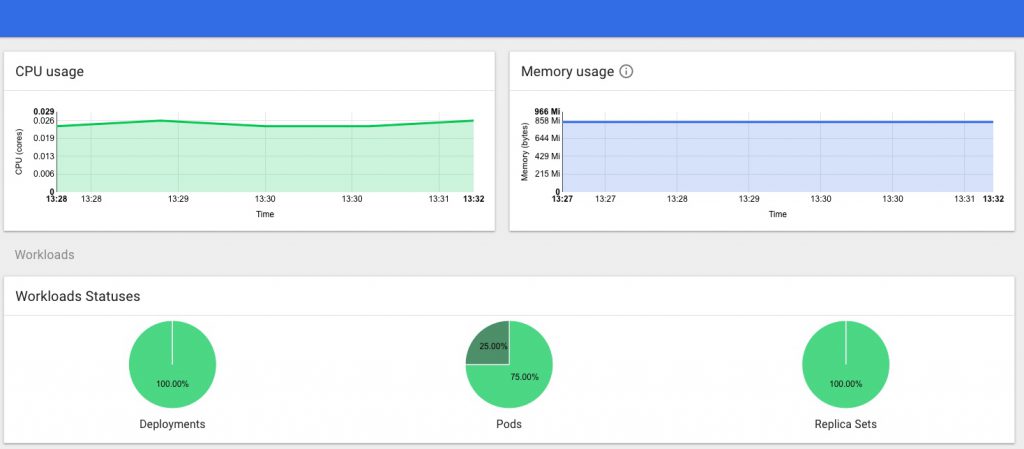
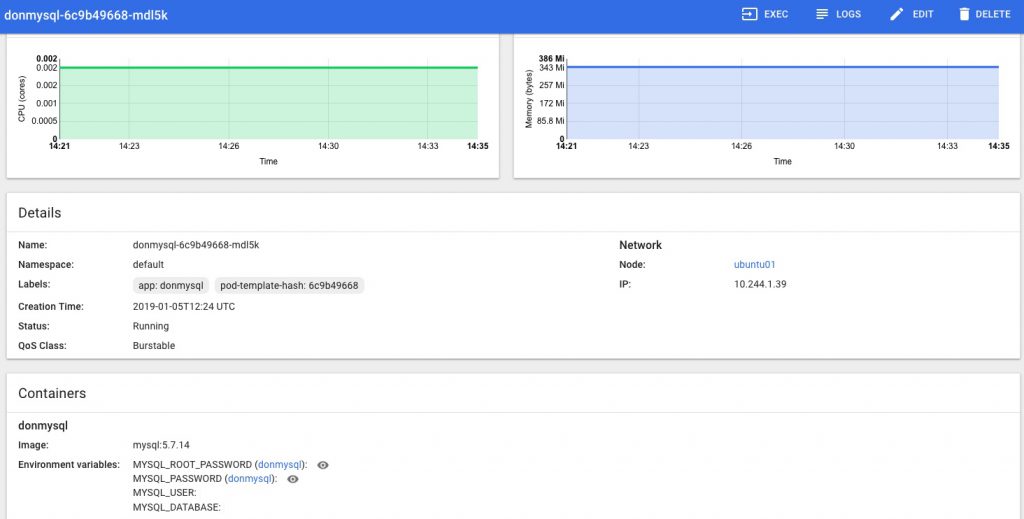
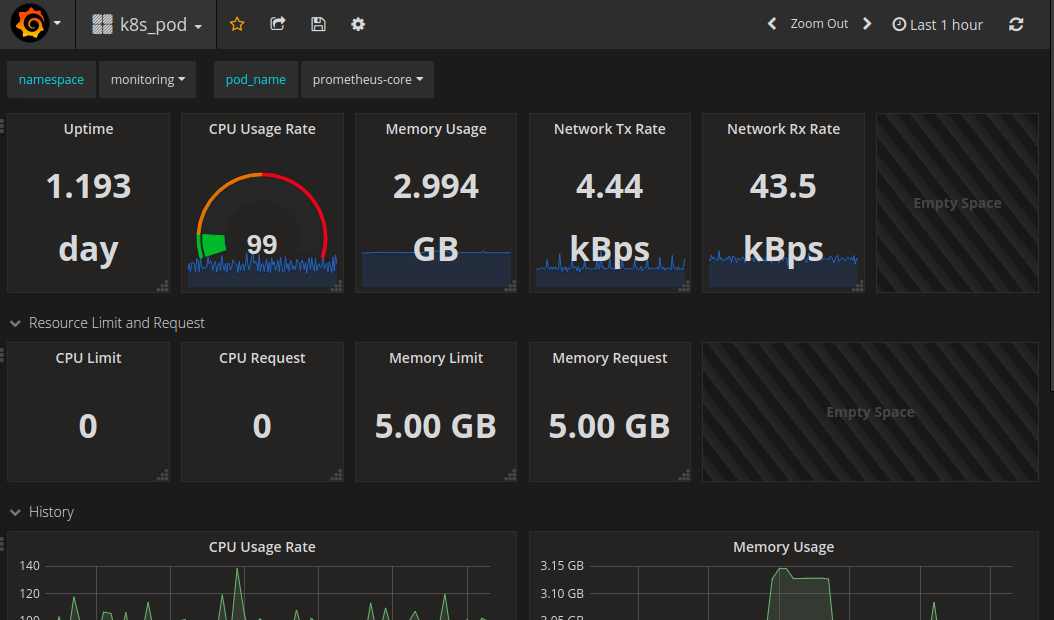
This combination of tools also makes it easy to add on Grafana dashboards that display whatever cluster stats you want from InfluxDB or Prometheus via Heapster, producing something along these lines:
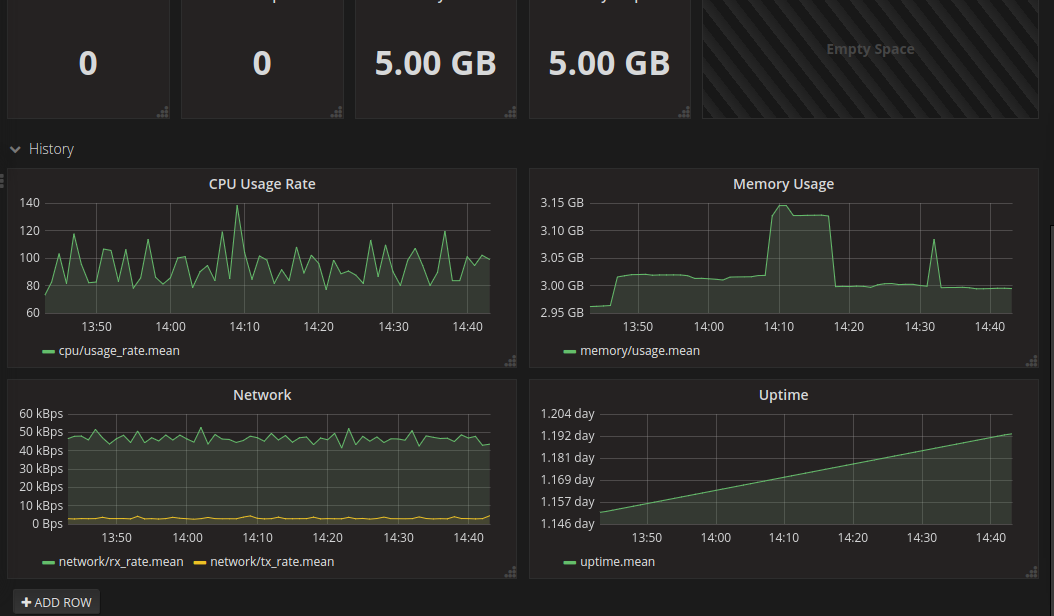
This post documents the steps I took to get things working the way I want them.
Adding Heapster to a Kubernetes Cluster
I’ve used Heapster before and found it did everything I wanted without any problem, especially with an InfluxDB backend, but it’s now being deprecated and replaced with the new metrics-server (and others), which at the time I was doing this doesn’t integrate with the kubernetes dashboard so wouldn’t give me the stats I was looking for., which are this kind of thing…
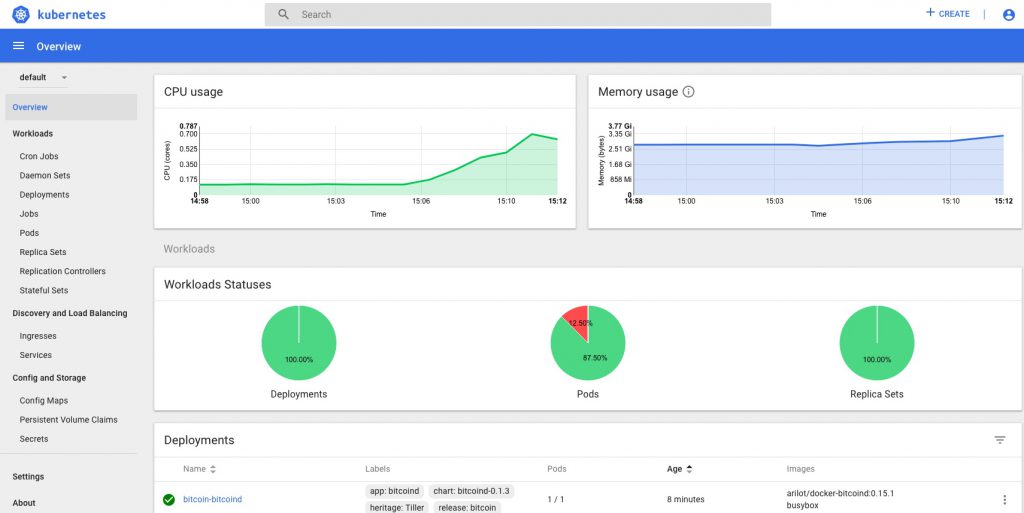
and this
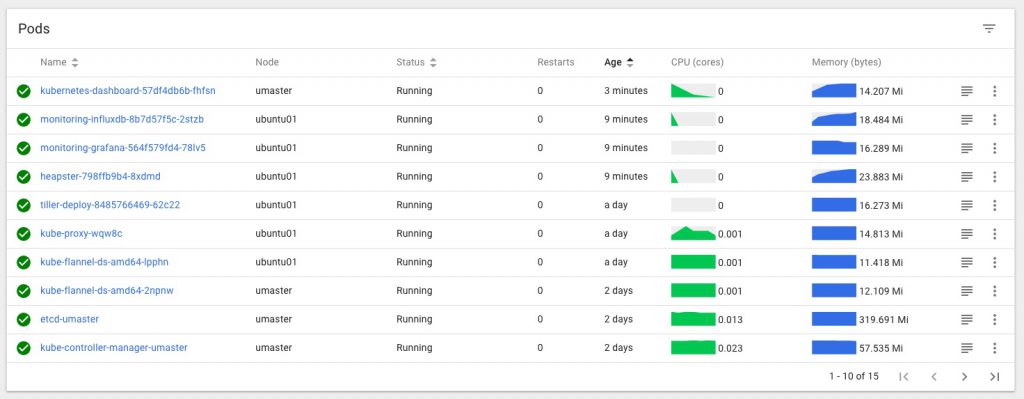
Note that it’s slightly easier to get Heapster stats working first, then when you add on the dashboard it’ll pick them up.
Heapster can be installed using the default project here, but it will not work with the current/latest version of Kubernetes Dashboard like that, and some changes are needed to make the two play nicely together.
I followed the steps in this very helpful post: https://brookbach.com/2018/10/29/Heapster-on-Kubernetes-1.11.3.html
and created my own fork of the official Heapster repo with the recommended changes then made to it, so now I can then simply (re)apply those settings whenever I rebuild my Cluster, and things should keep working.
My GitHub repo for this is here:
https://github.com/DonaldSimpson/heapster
and after cloning it (with the needed changes already done in that repo) locally I applied those files as described in the above post:
$ kubectl create -f ./deploy/kube-config/rbac/

then

$ kubectl create -f ./deploy/kube-config/influxdb/
Note that it may take a while for things to start happening…
The simplest test to see when/if Heapster is working is to check with kubectl top against a node or pod like so:
ansible@umaster:~$ kubectl top node umaster
 NAME CPU(cores) CPU% MEMORY(bytes) MEMORY%
 umaster 144m 3% 3134Mi 19%

ansible@umaster:~$ kubectl top node ubuntu01
 NAME CPU(cores) CPU% MEMORY(bytes) MEMORY%
 ubuntu01 121m 6% 2268Mi 59%
 ansible@umaster:~
If you get stats something like the above back things are looking good, but if you get a “no stats available” message, you’ve got some fundamental issues. Time to go check the logs and look for errors. I had quite a series of them until I made the above changes, including many access verboten errors like:
reflector.go:190] k8s.io/heapster/metrics/util/util.go:30: Failed to list *v1.Node: nodes is forbidden: User “system:serviceaccount:kube-system:heapster
Kubernetes Dashboard with user & permissions sorted
Next, I deployed the dashboard as simply as this:
https://github.com/kubernetes/dashboard
kubectl apply -f https://raw.githubusercontent.com/kubernetes/dashboard/v1.10.1/src/deploy/recommended/kubernetes-dashboard.yaml
but will probably use the Helm Chart for the kubernetes-dashboard next, which I think uses the same project.
Once deployed, I needed to edit
kubectl -n kube-system edit service kubernetes-dashboard
as per here:
https://github.com/kubernetes/dashboard/wiki/Accessing-Dashboard—1.7.X-and-above
and change
type: ClusterIP
to
type: NodePort
And I also applied these changes to create a Cluster Role and Service Admin account:
ansible@umaster:~/ansible01$ cat <<EOF | kubectl create -f -
 apiVersion: rbac.authorization.k8s.io/v1beta1
 kind: ClusterRoleBinding
 metadata:
   name: kubernetes-dashboard
   labels:
     k8s-app: kubernetes-dashboard
 roleRef:
   apiGroup: rbac.authorization.k8s.io
   kind: ClusterRole
   name: cluster-admin
 subjects:
 kind: ServiceAccount
 name: kubernetes-dashboard
 namespace: kube-system
 EOF
I then restarted the dashboard pod to pick up the changes:
kubectl delete pod kubernetes-dashboard-57df4db6b-4tcmk --namespace kube-system
Now it should be time to test logging in to the Dashboard. If you don’t have a service endpoint created already/automatically, you can find and do a quick test via the current NodePort by running
kubectl -n kube-system get service kubernetes-dashboard
Then hit your cluster IP with that PORT in your browser and you should see a login page like:
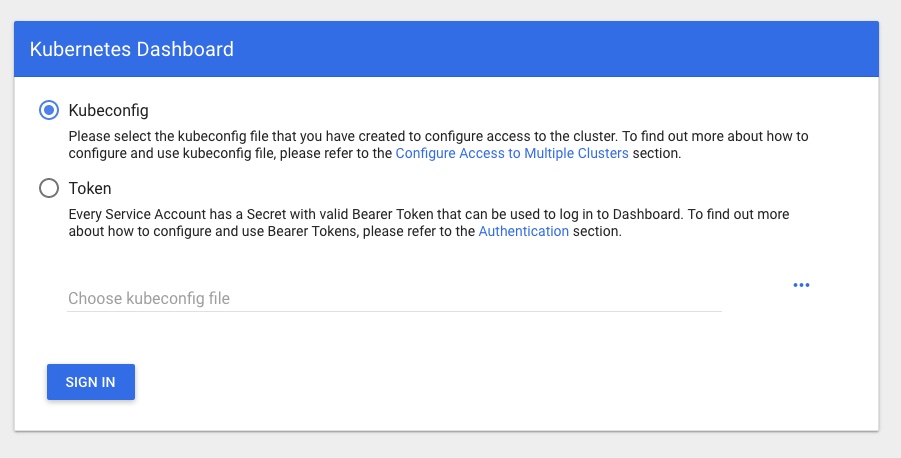
Presenting the next hurdle… how to log in to your nice new Dashboard and see all the shiny new info and metrics!
Run
sudo kubectl -n kube-system get secret
and look/grep for something starting with “kubernetes-dashboard-token-” that we created above. Then do this to get the token to log in with full perms:
sudo kubectl -n kube-system describe secret kubernetes-dashboard-token-rlr9m
or whatever unique name you found above – hitting tab after the last “-” should work if you have completion set up.
That should give you a TOKEN you can copy and log in to the Dashboard with.
You should now have full access in the dashboard, no more permissions errors, and be able to see the stats provided by Heapster too.

My TODO list to finish off this part of the project properly includes:
- exposing the dashboard as a service on a suitable free port
- resetting the cluster
- running through things again to ensure it all works first time
- see if using the Helm chart provides any benefits
- adding in monitoring and alerting via Grafana.
If you’re interested in monitoring and metrics for Kubernetes, this post takes things further: Kubernetes – Operators for monitoring with Prometheus and Grafana dashboards
Discover more from Don's Blog
Subscribe to get the latest posts sent to your email.

Great post, your repo worked very well for me. Thanks!
Thanks so much for putting this together – a huge help while between the deprecation of Heapster and the not-quite-yet inclusion of metrics-server in Dashboard.
One small thing – you have some misformatted YAML at https://github.com/DonaldSimpson/heapster/blob/master/deploy/kube-config/influxdb/grafana.yaml#L73-L83. I removed the duplicate ports definition, indented the NodePort type, and moved the volumes back up to the deployment template spec.