We are presenting a Kubernetes-related Meetup on Wednesday 5th June in Edinburgh.
This time we explore setting up a local development environment for Kubernetes using Minikube and Helm Charts. We will deploy NGINX to the Cluster and scaled it up and down, then use Helm Charts to deploy Jenkins, WordPress and MariaDB.
if you’d like to join in please book a space via our Meetup (below) – it’s free, and the Peoples Postcode Lottery are kindly hosting the event and providing the beer and pizza too! Wednesday 5th June 2019 from 6:30 PM in the Peoples Postcode Lottery offices at 28 Charlotte Square in Edinburgh.
Kubernetes – getting started with Minikube, Helm and Tiller
Wednesday, Jun 5, 2019, 6:30 PM
Wemyss House 28 Charlotte Square Edinburgh, GB
38 Members Went
In collaboration with Hays and the People’s Postcode Lottery, Automated IT Solutions are running a Meetup on Kubernetes with Minikube, Helm and Tiller. The session starts off with an overview of the main Kubernetes concepts and components, then runs through building your own local Kubernetes Cluster with Minikube. After deploying and scaling our fi…
I have been planning this session for ages, and hope that it will become the basis for several future talks and ideas, including deploying Blockchain to a Kubernetes cluster, then adding a Ruby and Sinatra based application that will use it.
This was made from a wind-fallen tree I chopped up about 3 years ago. I sealed the ends of some of the nicer logs and left them outside to dry out slowly.
This is the first bowl made from one of these logs, and I’m very pleased with the result – really nice spalting and not too many cracks, plus it was nice and easy to carve on the lathe too.
The unsorted selection of pics below show it on the lathe and on the log it came from, with the random traffic lamp for scale…
Recording progress on a large wind-fall Beech tree a neighbour has kindly let me have.
Most of this will be chopped up for firewood for next winter, but hopefully some of it will become bowls, planks, spoons, stools or other stuff over the next year – plan is to update this post with progress as that happens…
Some pics of the early stages and first few cuts:
This attempt at a panoramic pic shows the size of the tree better, pity I cut off the top of the photo though 🙁
Most of the first day was spent clearing the branches and chopping off the small bits in preparation to get at the multiple trunk sections next time.
And some shots of the first few tractor loads brought home and added to the woodpile – still nice and green….
This post runs through the steps required to start using Global Pipeline Libraries in your Jenkins Pipelines.
There are many reasons you may want to use this functionality, the main attraction for me is to provide centralised libraries that perform common functions for multiple instances of Jenkins. This removes a lot of complexity from the pipelines and also reduces code repition; for example, you may have 10 Jenkins instances all performing the same general task, each using slightly diferent code. If you want to update how this task is done, you may have to find and update each instance. Alteratively, using this approach, you can update the central version and know that all of your Jenkins Pipelines that consume it will be udpated.
There are many posts about these all over the ‘net, but they mostly seemed overly complex, too specific and none too helpful to me – I just wanted to know how to get the most basic example possible working quickly on my dev Jenkins instance, so I could see how they work in practice and take it from there.
That’s what this post covers – getting a simple “Hello World” type example library published and made available in Jenkins, then calling it very easily from within a Pipeline job with the expected results. More detail and advanced usage to come later… these are a very powerful addition to Jenkins pipelines and once you see how they work, you may also see benefits to migrating some of your common tasks over to them.
This is done in three simple and logical steps:
Create a Library and Publish it
Tell Jenkins about your nice new library
Calling the Global Library from my Jenkins Pipeline
That’s all that’s needed for this most-basic example – here is the code in plain text, as taken from the guide here:
#!/usr/bin/env groovy
def call(String name = 'human') {
    // Any valid steps can be called from this code, just like in other
    // Scripted Pipeline
    echo "Hello, ${name}."
}
It is important to note that the file is in a “vars” directory, this is the naming convention Jenkins expects to find your groovy libraries within, and is best followed.
A. Note
Next step is to:
Tell Jenkins about your nice new library
This is done by going to Manage Jenkins then Configure System, then scrolling down to Global Pipeline Libraries and defining a new instance of one, just like this:
The settings used here are:
Name: mycommonlibs // any “friendly” name you’d like to reference these libraries by
Default version: master // or use a branch or version number if you prefer
I then checked the three tick boxes, especially the Load implicitly which removes the need to load Libraries explicitly in your Jenkinsfile (you can do this, and it may be very useful depending on your needs, but I want simple and easy for now).
The final section tells Jenkins where this Library is:
That is all that is needed to set up a Library and tell Jenkins all about it.
Note that anyone with write access to the location of your defined Libraries will effectively have full access to your Jenkins instance – if they can update the code that’s being run…
W. Arning
And finally, it’s time for a test drive…
Calling the Global Library from my Jenkins Pipeline:
    sayHello ()
    sayHello 'Donald'
To end up with a mega-basic Pipeline that looks like this:
When this Jenkins Pipeline job is run, it generates the following output:
Summary
Which as you can see means that Jenkins has pulled in the Shared Library from GitHub, resolved and called the sayHello() method from the remote common library, called it again with a passed parameter (‘Donald‘) and produced the expected results. Yay. How neat and how easy was that?
There’s a whole lot more you can do with Global Pipeline Libraries in Jenkins. From this point you can easily add complexity and functionality to build up a library of powerful and useful utilities that will greatly improve the quality and manageability of your Pipelines. I generally start by finding common tasks and patterns and externalise those to shared libraries.
I plan to expand on some of these points in a later post, but hopefully this shows how to quickly and easily start using them.
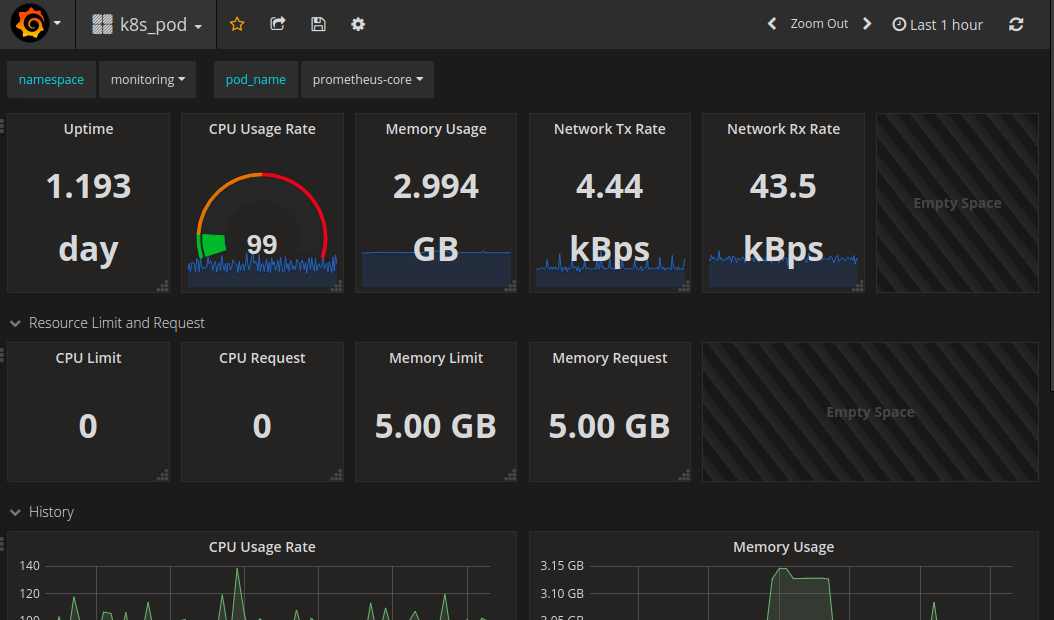
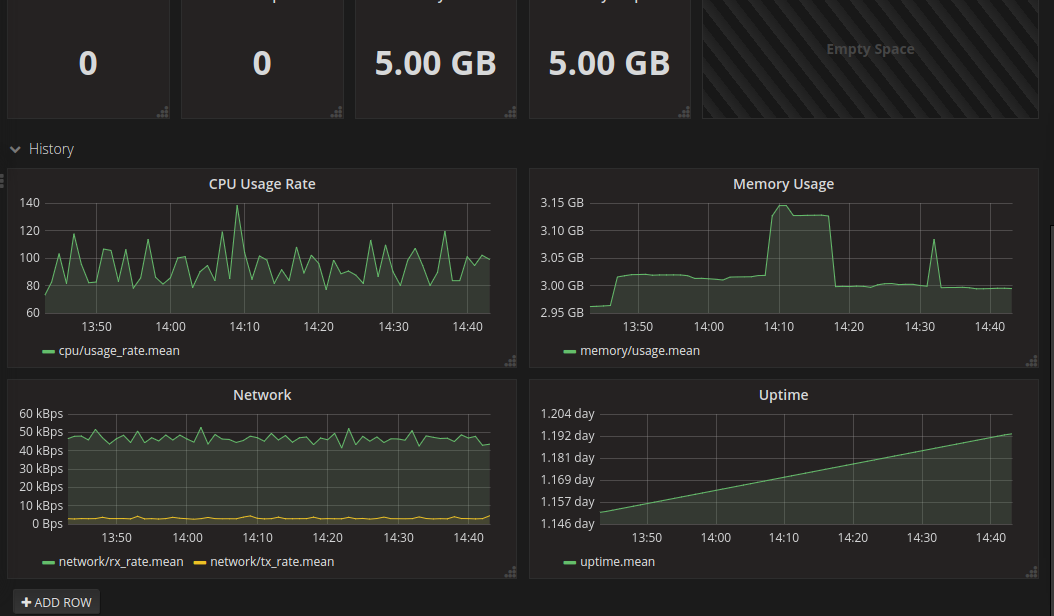
What was a little trickier, was getting live stats for my cluster – cpu and mem load etc – to show up inside the dashboard, so that you can see the status of the various deployments and pods on your cluster at a glance from one central location.
This combination of tools also makes it easy to add on Grafana dashboards that display whatever cluster stats you want from InfluxDB or Prometheus via Heapster, producing something along these lines:
This post documents the steps I took to get things working the way I want them.
Adding Heapster to a Kubernetes Cluster
I’ve used Heapster before and found it did everything I wanted without any problem, especially with an InfluxDB backend, but it’s now being deprecated and replaced with the new metrics-server (and others), which at the time I was doing this doesn’t integrate with the kubernetes dashboard so wouldn’t give me the stats I was looking for., which are this kind of thing…
and this
Note that it’s slightly easier to get Heapster stats working first, then when you add on the dashboard it’ll pick them up.
Heapster can be installed using the default project here, but it will not work with the current/latest version of Kubernetes Dashboard like that, and some changes are needed to make the two play nicely together.
and created my own fork of the official Heapster repo with the recommended changes then made to it, so now I can then simply (re)apply those settings whenever I rebuild my Cluster, and things should keep working.
Note that it may take a while for things to start happening…
The simplest test to see when/if Heapster is working is to check with kubectl top against a node or pod like so:
ansible@umaster:~$ kubectl top node umaster
 NAME CPU(cores) CPU% MEMORY(bytes) MEMORY%
 umaster 144m 3% 3134Mi 19%

ansible@umaster:~$ kubectl top node ubuntu01
 NAME CPU(cores) CPU% MEMORY(bytes) MEMORY%
 ubuntu01 121m 6% 2268Mi 59%
 ansible@umaster:~
If you get stats something like the above back things are looking good, but if you get a “no stats available” message, you’ve got some fundamental issues. Time to go check the logs and look for errors. I had quite a series of them until I made the above changes, including many access verboten errors like:
reflector.go:190] k8s.io/heapster/metrics/util/util.go:30: Failed to list *v1.Node: nodes is forbidden: User “system:serviceaccount:kube-system:heapster
Kubernetes Dashboard with user & permissions sorted
I then restarted the dashboard pod to pick up the changes:
kubectl delete pod kubernetes-dashboard-57df4db6b-4tcmk --namespace kube-system
Now it should be time to test logging in to the Dashboard. If you don’t have a service endpoint created already/automatically, you can find and do a quick test via the current NodePort by running
kubectl -n kube-system get service kubernetes-dashboard
Then hit your cluster IP with that PORT in your browser and you should see a login page like:
Presenting the next hurdle… how to log in to your nice new Dashboard and see all the shiny new info and metrics!
Run sudo kubectl -n kube-system get secret and look/grep for something starting with “kubernetes-dashboard-token-” that we created above. Then do this to get the token to log in with full perms:
There was an obvious flaw in the example MySQL Chart I deployed via Helm and Tiller, in that the required Persistent Volume Claims could not be satisfied so the pod was stuck in a “Pending” state for ever.
Adding Persistent Storage
In this post I will sort that out, by adding Persistent Storage to the Cluster and redeploying and testing the same Chart deployed via “helm deploy stable/mysql“. This time, it should be able to claim all of the resources it needs with no tweaking or hints supplied…
First a few notes on some of the commands and tools I used for troubleshooting what was wrong with the mysql deploy.
watch -d 'sudo kubectl get pods --all-namespaces -o wide'

watch -d kubectl describe pod wise-mule-mysql

kubectl attach wise-mule-mysql-d69788f48-zq5gz -i
The above commands showed a pod that generally wasn’t happy or connectable, but little detail.
Running “kubectl get events -w” is much more informative:
LAST SEEN   TYPE      REASON              KIND                    MESSAGE
17m         Warning   FailedScheduling    Pod                     pod has unbound immediate PersistentVolumeClaims
17m         Normal    SuccessfulCreate    ReplicaSet              Created pod: quaffing-turkey-mysql-65969c88fd-znwl9
2m38s        Normal    FailedBinding       PersistentVolumeClaim   no persistent  volumes available for this claim and no storage class is set
17m         Normal    ScalingReplicaSet   Deployment              Scaled up replica set quaffing-turkey-mysql-65969c88fd to 1
and doing “kubectl describe pod <pod name>” is also very useful:
<snip a whole load of events and details>
  Type     Reason            Age                    From               Message
  ----     ------            ----                   ----               -------
  Warning  FailedScheduling  5m26s (x2 over 5m26s)  default-scheduler  pod has unbound immediate PersistentVolumeClaims
Making it pretty clear what’s going on and exactly what is noticeably absent from the Cluster.
My initial plan had been to use GlusterFS and Heketi, but having dabbled with this before and knowing it wasn’t really something I wanted to do for this use case, it was a bit of Yak Shaving I’d really like to avoid if possible.
So, I had a look around and found “Rook“. This sounded much simpler and more suited to my needs. It’s also open source, Apache licensed, and works on multi-node clusters. I’d previously considered using hostPath storage but it’s a bit too basic even for here, and would restrict me to a single node cluster due to the (lack of) replication, missing a lot of the point of a Cluster, so I thought I’d give Rook a shot.
I tried to follow this but had some issues, which I will try and clarify when I run through this again – I’d made a bit of a mess trying a bit of Gluster and some hostPath and messing about with the default storage class etc, so it was quite possibly “just me”, and not Rook to blame here 🙂 This is some of my shell history:
I definitely ran through this more than once, and I think it also took a while for things to start up and work – the subsequent runs went much better than the initial ones anyway. I also applied a few patches to the rook user and storage class (below) – these and many other alternatives were recommended by others facing similar sounding issues, but I think for me the fundamental is solved further below, re the rbd binary missing from $PATH, and installing ceph:
kubectl get secret rook-rook-user -oyaml | sed "/resourceVer/d;/uid/d;/self/d;/creat/d;/namespace/d" | kubectl -n kube-system apply -f -
kubectl get secret rook-rook-user -oyaml | sed "/resourceVer/d;/uid/d;/self/d;/creat/d;/namespace/d" | kubectl -n default -f -
kubectl get secret rook-rook-user -oyaml | sed "/resourceVer/d;/uid/d;/self/d;/creat/d;/namespace/d" | kubectl -n default apply -f -
That all done, I still had issues with my pods, specifically this error:
MountVolume.WaitForAttach failed for volume “pvc-4895a379-104b-11e9-9d98-000c29702bc8” : fail to check rbd image status with: (executable file not found in $PATH), rbd output: ()
which took me a little while to figure out. I think reading this page on RBD gave me the hint that there was something (well yeah, the rbd binary specifically) missing on the hosts, but there’s a lot of talk of folk solving this by creating custom images with the rbd binary added to the $PATH in them, replacing core k8s containers with them, which didn’t sound too appealing to me. I had assumed that the images would include the binaries, but hadn’t checked this is any way.
This issue may well be part or possibly all of the reason why I ran the above commands repeatedly and applied all of those patches.
The simple yet not too obvious solution to this – in my case anyway – was to ensure that the ceph common package was available both on the master:
apt-get update && apt-get install ceph-common -y
and critically that it was also available on each of the worker nodes too.
Once that was done, I think I deleted and reapplied everything rook-related again, then things started working as they should, finally.
A quick check:
ansible@umaster:~$ kubectl get sc
 NAME                   PROVISIONER     AGE
 rook-block (default)   rook.io/block   22h
And things are looking much better now.
Checking the Dashboard I can see a Rook namespace with a number of Rook pods all looking green, and Persistent Volume Claims in the default namespace too:
Test with an example – “helm install stable/mysql”, take 2…
To verify this I re ran the same Helm Chart for mysql, with no changes or overrides, to ensure that rook provisioning was working, that it was properly detected and used as the default storage class in the Cluster with no args/hints needed.
The output from running “helm install stable/mysql” includes this info:
MySQL can be accessed via port 3306 on the following DNS name from within your cluster: donmysql.default.svc.cluster.local
3. Connect using the mysql cli, then provide your password: $ mysql -h donmysql -p
So I tried the above, opting to create an ubuntu client pod, installing mysql utils to that then connecting to the above MySQL instance with the root password like so:
ansible@umaster:~$  MYSQL_ROOT_PASSWORD=$(kubectl get secret --namespace default donmysql  -o jsonpath="{.data.mysql-root-password}" | base64 --decode; echo)
ansible@umaster:~$ echo $MYSQL_ROOT_PASSWORD
<THE ROOT PASSWORD WAS HERE>
ansible@umaster:~$ kubectl run -i --tty ubuntu --image=ubuntu:16.04 --restart=Never -- bash -il
If you don't see a command prompt, try pressing enter.
root@ubuntu:/#
root@ubuntu:/# apt-get update && apt-get install mysql-client -y
Get:1 http://archive.ubuntu.com/ubuntu xenial InRelease [247 kB]
Get:2 http://security.ubuntu.com/ubuntu xenial-security InRelease [107 kB]
<snip a load of boring apt stuff>
Setting up mysql-common (5.7.24-0ubuntu0.16.04.1) ...
update-alternatives: using /etc/mysql/my.cnf.fallback to provide /etc/mysql/my.cnf (my.cnf) in auto mode
Setting up mysql-client-5.7 (5.7.24-0ubuntu0.16.04.1) ...
Setting up mysql-client (5.7.24-0ubuntu0.16.04.1) ...
Processing triggers for libc-bin (2.23-0ubuntu10) ...
root@ubuntu:/# mysql -h donmysql -p
Enter password:
Welcome to the MySQL monitor.  Commands end with ; or \g.
Your MySQL connection id is 67
Server version: 5.7.14 MySQL Community Server (GPL)
<snip some more boring stuff>
mysql> show databases;
+--------------------+
| Database           |
+--------------------+
| information_schema |
| mysql              |
| performance_schema |
| sys                |
+--------------------+
4 rows in set (0.00 sec)
mysql> exit
Bye
root@ubuntu:/
In the Kubernetes Dashboard (loads more on that little adventure coming soon!) I can also see that the MySQL Pod is Running and looks happy, no more Pending or Init issues for me now:
and that the Rook Persistent Volume Claims are present and looking healthy too:
Conclusion & next steps
That’s storage sorted, kind of – I’m not totally happy everything I did was needed, correct and repeatable yet, or that I know enough about this.
Rook.io looks very good and I’m happy it’s the best solution for my current needs, but I can see that I should have spent more time reading the documentation and thinking about prerequisites, yadda yadda. To be honest when it comes to storage I’m a bit of a Luddite – i just want it to be there and work as I’d expect it to, and I was keen to move on to the next steps….
I plan to scrub the k8s cluster shortly and run through this again from scratch to make sure I’ve got it clear enough to add to my provisioning pipeline process.
Next, a probably not-too-brief post on how I got Heapster stats working with an InfluxDB backend monitoring stats for both the Master and Nodes, installing a usable Kubernetes Dashboard, and getting that working with suitable access/permissions, aaaaand getting the k8s Dashbaord showing the CPU and Memory stats from Heapster as seen in the Dashboard pic of the pod statuses above…. phew!
My aim here is to create a Kubernetes environment on my home lab that allows me to play with k8s and related technologies, then quickly and easily rebuild the cluster and start over.
The focus here in on trying out new technologies and solutions and in automating processes, so in this particular context I am not at all bothered with security, High Availability, redundancy or any of the usual considerations.
Helm and Tiller
The quick start guide is very good: https://docs.helm.sh/using_helm/ and I used this as I went through the process of installing Helm, initializing Tiller and deploying it to my Kubernetes cluster, then deploying a first example Chart to the Cluster. The following are my notes from doing this, as I plan to repeat then automate the entire process and am bound to forget something later 🙂
Helm is the best way to find, share, and use software built for Kubernetes.
I have been following this project for a while and it looks to live up to the hype – there’s a rapidly growing and pretty mature collection of Helm Charts available here: https://github.com/helm/charts/tree/master/stable which as you can see covers an impressive amount of things you may want to use in your own Kubernetes cluster.
Get the Helm and Tiller binaries
This is as easy as described – for my architecture it meant simply
and extract and copy the 2 binaries (helm & tiller) to somewhere in your path
I usually do a quick sanity test or 2 – e.g. running “which helm” as a non-root user and maybe check “helm –help” and “helm version” all say something sensible too.
Install Tiller
Helm is the Client side app that directs Tiller, which is the Server side part. Just like steering a ship… and stretching the Kubernetes nautical metaphors to the max.
Tiller can be installed to your k8s Cluster simply by running “helm init“, which should produce output like the following:
ansible@umaster:~/helm$ helm init
Creating /home/ansible/.helm
Creating /home/ansible/.helm/repository
Creating /home/ansible/.helm/repository/cache
Creating /home/ansible/.helm/repository/local
Creating /home/ansible/.helm/plugins
Creating /home/ansible/.helm/starters
Creating /home/ansible/.helm/cache/archive
Creating /home/ansible/.helm/repository/repositories.yaml
Adding stable repo with URL: https://kubernetes-charts.storage.googleapis.com
Adding local repo with URL: http://127.0.0.1:8879/charts
$HELM_HOME has been configured at /home/ansible/.helm.
Tiller (the Helm server-side component) has been installed into your Kubernetes Cluster
Please note: by default, Tiller is deployed with an insecure 'allow unauthenticated users' policy.
To prevent this, run `helm init` with the --tiller-tls-verify flag.
For more information on securing your installation see: https://docs.helm.sh/using_helm/#securing-your-helm-installation
Happy Helming
That should do it, and a quick check of running pods confirms we now have a tiller pod running inside the kubernetes cluster in the kube-system namespace:
So far so nice and easy, and as per the docs the next steps are to do a repo update and a test chart install…
ansible@umaster:~/helm$ helm repo update
 Hang tight while we grab the latest from your chart repositories…
 …Skip local chart repository
 …Successfully got an update from the "stable" chart repository
 Update Complete. ⎈ Happy Helming!⎈
 ansible@umaster:~/helm$ helm install stable/mysql
 Error: no available release name found
 ansible@umaster:~/helm$
Doh. A quick google makes that “Error: no available release name found” look like a k8s/helm version conflict, but the fix is pretty easy and detailed here: https://github.com/helm/helm/issues/3055
So I did as suggested, creating a service account cluster role binding and patch to deploy them to the kube-system namespace:
helm lsansible@umaster:~/helm$ helm ls
NAME             REVISION UPDATED                  STATUS   CHART        APP VERSION NAMESPACEdunking-squirrel 1        Thu Jan  3 15:38:37 2019 DEPLOYED mysql-0.12.0 5.7.14      defaultansible@umaster:~/helm$
and all is groovy
list pods with ansible@umaster:~/helm$ sudo kubectl get pods --all-namespaces -o wide
The MySQL pod is failing to start as it has persistent volume claims defined, and I’ve not set up default storage for that yet – that’s covered in the next step/post 🙂
If you want to use or delete that MySQL deployment all the details are in the rest of the getting started guide – for the above it would mean doing a ‘helm ls‘ then a ‘ helm delete <release-name> ‘ where <release-name> is ‘dunking-squirrel’ or whatever you have.
A little more on Helm
Just running out of the box Helm Charts is great, but obviously there’s a lot more you can do with Helm, from customising the existing Stable Charts to suit your needs, to writing and deploying your own Charts from scratch. I plan to expand on this in more detail later on, but will add and update some notes and examples here as I do:
For me and for now, I’m just happy that Helm, Tiller and Charts are working, and I can move on to automating these setup steps and some testing to my overall pipelines. And sorting out the persistent volumes too. After that’s all done I plan to start playing around with some of the stable (and perhaps not so stable) Helm charts.
As they said, this could well be “the best way to find, share, and use software built for Kubernetes” – it’s very slick!